Machine Learning based Crop Prediction System Using
Multi-Linear Regression
Prof. D.S. Zingade, Omkar Buchade, Nilesh Mehta, Shubham Ghodekar, Chandan Mehta
[email protected], [email protected], [email protected], [email protected],
B.E. Computer Dept., Aissms Ioit, Kennedy Road, Pune
ABSTRACT
India being an agricultural country, its economy predominantly depends on agriculture yield growth and allied agro industry products. In India, agriculture is largely influenced by rainwater which is highly unpredictable. Agriculture growth also depends on diverse soil parameters, namely Nitrogen, Phosphorus, Potassium, Crop rotation, Soil moisture, pH, surface temperature and weather aspects like temperature, rainfall, etc. India now is rapidly progressing towards technical development. Thus, technology will prove to be beneficial to agriculture which will increase crop productivity resulting in better yields to the farmer. The proposed project provides a solution for Smart Agriculture by monitoring the agricultural field which can assist the farmers in increasing productivity to a great extent. Weather forecast data obtained from IMD (Indian Metrological Department) such as temperature and rainfall and soil parameters repository gives insight into which crops are suitable to be cultivated in a particular area. This work presents a system, in form of an android based application and a website, which uses Machine Learning techniques in order to predict the most profitable crop in the current weather and soil conditions. The proposed system will integrate the data obtained from repository, weather department and by applying machine learning algorithm: Multiple Linear Regression, a prediction of most suitable crops according to current environmental conditions is made. This provides a farmer with variety of options of crops that can be cultivated. Thus, the project develops a system by integrating data from various sources, data analytics, prediction analysis which can improve crop yield productivity and increase the profit margins of farmer helping them over a longer run.
Keywords
Data Analytics, Prediction, Machine learning, Multiple linear regression.
1.
INTRODUCTION
Agriculture is one of the most important occupation practiced in our country. It is the broadest economic sector and plays an important role in overall development of the country. About 60 % of the land in the country is used for agriculture in order to suffice the needs of 1.2 billion people. Thus, modernization of agriculture is very important and thus will lead the farmers of our country towards profit. [1] Data analytic (DA) is the process of examining data sets in order to draw conclusions about the information they contain, increasingly with the aid of specialized systems and software. [2] Earlier yield prediction was performed by considering the farmer's experience on a particular field and crop. However, as the conditions change day by day very rapidly, farmers are forced to cultivate more and more crops. Being this as the current situation, many of them don’t have enough knowledge about
the new crops and are not completely aware of the benefits they get while farming them. Also, the farm productivity can be increased by understanding and forecasting crop performance in a variety of environmental conditions. Thus, the proposed system takes the location of the user as an input. From the location, the nutrients of the soil such as Nitrogen, Phosphorous, Potassium, forecasted weather is obtained. The proposed system applies Machine Learning and prediction algorithm like Multiple Linear Regression to identify the pattern among data and then process it as per input conditions. This in turn will propose the best feasible crops according to given environmental conditions. As past year production is also taken into account, the prediction will be more accurate. Thus, this system will suggest profitable crops providing a choice directly to the farmer.
2.
SYSTEM DESCRIPTION
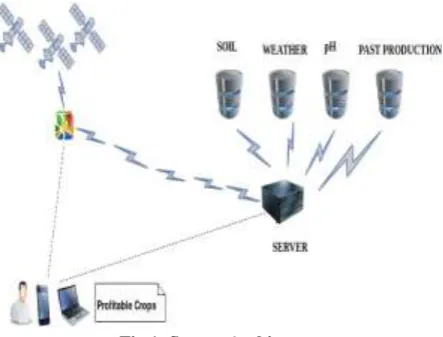
There is no system existing which recommends crops based on multiple factors such as Nitrogen, Phosphorus and Potassium nutrients in soil, pH and weather components which include temperature and rainfall. The proposed system suggests an android and a web based application, which can precisely predict the most profitable crop to the farmer. The user location is identified with the help of GPS. According to user location, the feasible crops in the respective location is identified from the soil, pH and weather database. These soils are compared with past year production database to identify the most profitable crop in the current location. After this processing is done at server side, the result is sent to the user’s android and web application. The previous production of the crops is also taken into account which in turn leads to precise crop proposition. Location is the only input for the extrapolation system. Depending on the numerous scenarios and additional filters according to the user requirement the most producible crop is suggested.
3.
PROPOSED SYSTEM ARCHITECTURE
Fig. 2: Proposed architecture of System
4.
ALGORITHMIC SURVEY
Regression: Regression analysis is a form of predictive modelling technique which investigates the association between a dependent (targets) and autonomous variable (s) (independent variables).
Fig. 3: Regression classification
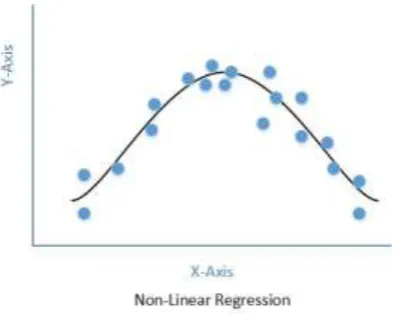
Non Linear Regression: Nonlinear regression is a form of regression breakdown in which observational data are displayed by a function which is a nonlinear amalgamation of
independent variables. The data is plotted by a technique of successive approximations.[9]
Fig. 4: Point plot of non-linear regression
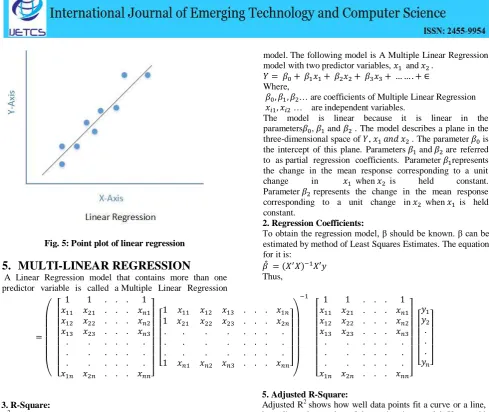
Fig. 5: Point plot of linear regression
5.
MULTI-LINEAR REGRESSION
A Linear Regression model that contains more than one predictor variable is called a Multiple Linear Regression
model. The following model is A Multiple Linear Regression model with two predictor variables, and .
Where,
… are coefficients of Multiple Linear Regression
… are independent variables.
The model is linear because it is linear in the parameters , and . The model describes a plane in the three-dimensional space of , . The parameter is
the intercept of this plane. Parameters and are referred to as partial regression coefficients. Parameter represents the change in the mean response corresponding to a unit change in when is held constant.
Parameter represents the change in the mean response corresponding to a unit change in when is held
constant.
2. Regression Coefficients:
To obtain the regression model, β should be known. β can be estimated by method of Least Squares Estimates. The equation for it is:
Thus, 3. R-Square:
R2 is the regression sum of squares divided by the total sum of squares. Alternatively, as demonstrated in this, since SSTO = SSR + SSE, the quantity r2 also equals one minus the ratio of the error sum of squares to the total sum of squares:
1. Since r2 is a proportion, it is always a number between 0 and 1.
2. If r2 = 1, all of the data points fall perfectly on the regression line.
3. If r2 = 0, the estimated regression line is perfectly horizontal.
4. Multiple R:
This is the correlation coefficient. It tells you how strong the linear relationship is. For example, a value of 1 means a perfect positive relationship and a value of zero means no relationship at all. It is the square root of r.
Thus,
5. Adjusted R-Square:
Adjusted R2 shows how well data points fit a curve or a line, but adjusts the number of data points in a model. If you add more and more useless variables to your model, adjusted R2 will decrease. If you add more useful variables to your model, Adjusted R2 will increase.
Where,
N = Number of points in data sample.
K = Number of independent regressors i.e. number of variables in model, excluding constant.
6. Standard Error:
Standard Error(S) represents the average distance of values from the regression line. It tells how wrong the regression model is. Smaller value of S is desirable as it indicates observations being close to regression line. It is calculated by,
7. ANOVA:
6.
MATHEMATICAL
REPRESENTATION OF ALGORITHM
FOR PROPOSED SYSTEM
Train data:
……. for i=1,2, …, n
Where, …are coefficients of Multiple Linear Regression
are independent variables.
X {weather attributes, soil attributes} Y{production}
Y- production matrix X- attributes matrix B- Partial coefficient matrix E- error control
= (X’X)-1 X’Y ………Least Square Estimate X’ - Transpose X-1
- Inverse of Matrix Prediction: = X
Result: res=
The system of equations involved in a Multiple Linear Regression can be represented as:
where,
Matrix X is called as Design Matrix which contains information about levels of predictor variables at which observations are obtained. Vector β represents all regression coefficients.
7.
IMPLEMENTATION
7.1
Datasets used
Fig. 6 Crop production for a sample crop Arcanut
Source: https://data.gov.in
Fig. 7 Database of Crops
Source: https://www.apnikheti.comFig. 8 Nutrients of different states in India
Source: Bhimashankar Industry (Sponsoring Firm)
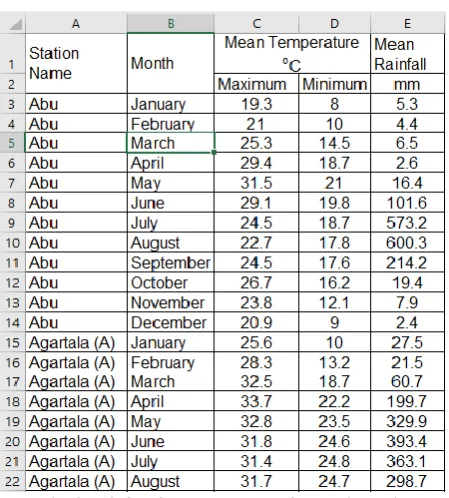
Fig. 9 Rainfall & Temperature of states in India
Source: Source: https://data.gov.in
7.2
Programming Environment:
1. Python:
model as it supports handful of libraries making implementation of machine learning easier for developer. Libraries used:
numpy: Used for working with N-dimensional array objects. Pandas: It is used for data analysis, including structures such as data frames.
Matplotlib: It is 2-D plotting library which has been used for publication of quality graphs helping in overall analysis of implemented project.
Scikit-learn: Used for splitting the data into training set and testing set. This library has a great impact on data analysis and data mining tasks.
2. Node.js
Node.js is an open source server framework which uses JavaScript on the server. It is a single-threaded, non-blocking, asynchronously programming, which is highly memory efficient.
1.body-parser: Takes body of your request and parse it to whatever one wants to receive in POST/PUT requests. 2.express: provides robust set of features for mobile and web applications.
3. python-shell: Simple way to run python scripts from node.js with efficient inter-process communication and error-handling.
3. HTML AND CSS:
HTML is a standard markup language for creating web pages. It is used for describing the structure of the web pages using mark up. CSS stands for Cascading Style Sheets that describes how HTML elements are displayed on screen, paper or in other media.
4. JavaScript:
JavaScript is an interpreted, light-weight, network-centric applications. It is complimentary to and integrated with Java. It supports event-driven, functional, and imperative programming styles.
5. Android:
Android is an Open Source and Linux based OS for mobile devices. It is based on Java programming language. For acquiring user location we use two of the following libraries: Geocoder: It is used for reverse geocoding i.e. retrieving address from location on Google Map.
Google Map API: It is used for displaying map on the website.
7.3
Farm First application Implementation
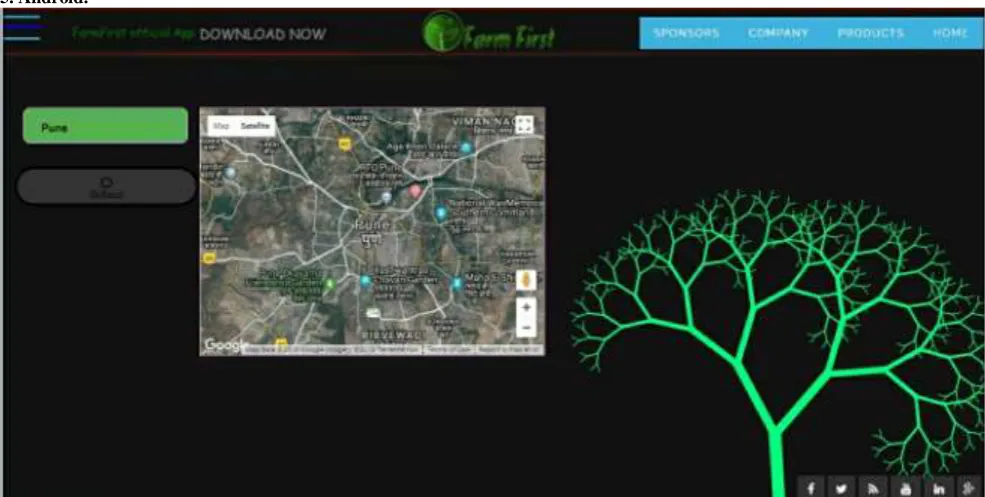
Fig. 11 Website home page
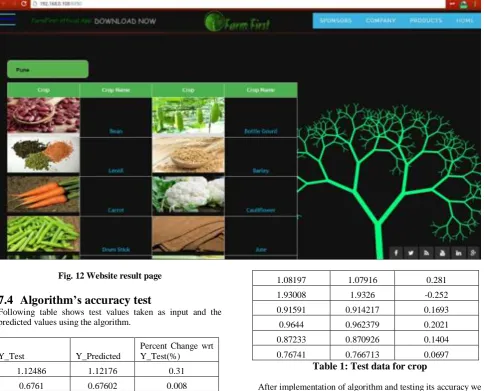
Fig. 12 Website result page
7.4
Algorithm’s accuracy test
Following table shows test values taken as input and the predicted values using the algorithm.
Y_Test Y_Predicted
Percent Change wrt Y_Test(%)
1.12486 1.12176 0.31
0.6761 0.67602 0.008
0.33509 0.317066 1.8024
0.8654 0.864045 0.1355
1.08197 1.07916 0.281
1.93008 1.9326 -0.252
0.91591 0.914217 0.1693
0.9644 0.962379 0.2021
0.87233 0.870926 0.1404
0.76741 0.766713 0.0697
Table 1: Test data for crop
After implementation of algorithm and testing its accuracy we can see that the percent deviation between the predicted values and tested values is very low making the algorithm efficient for real world applications. The figure below shows the deviation graphically.
Fig. 13 Graphical comparison between testing and predicted values
Y_Test 0
1 2
1 2
3 4
5 6
7 8
9 10
CONCLUSION AND FUTURE SCOPE:
The proposed system lists out all possible crops feasible in a particular area, helping the farmer in decision making of which crop to cultivate. A careful examination of the data related to soil, weather, pH and past year production has been done by the system and suggests which are the most profitable crops which can be cultivated in the apropos environmental condition. Also, this system examines the past production of data which will help the farmer get insight into the demand and the cost of various crops in market. As maximum types of crops will be covered under this system, farmer may get to know about the crop which may never have been cultivated. IOT may lead to connection of all farming devices together with help of internet in future. Different types of sensors employed in farm will give real time data of farm condition and the devices can be used to increase the moisture, acidity, etc. accordingly. Farm vehicles like tractor will be connected to internet in future which will, in real time pass data to farmer about crop harvesting and the disease crops may be suffering from thus helping the farmer in taking appropriate action. Further the best profitable crop can also be found in light of the monetary and inflation ratio.8.
REFERENCES
[1]https://en.wikipedia.org/wiki/Agriculture [2]https://en.wikipedia.org/wiki/Data_analysis
[3]JeetendraShenoy, YogeshPingle, “IOT in agriculture”, 2016 IEEE.
[4] M.R. Bendre, R.C. Thool, V.R.Thool, “Big Data in Precision agriculture”,Sept,2015 NGCT.
[5] Monali Paul, Santosh K. Vishwakarma, Ashok Verma, “Analysis of Soil Behavior and Prediction of Crop Yield using Data Mining approach”, 2015 International Conference on Computational Intelligence and Communication Networks. [6]Abdullah Na, William Isaac, ShashankVarshney, Ekram Khan, “An IoT Based System for Remote Monitoring of Soil Characteristics”, 2016 International Conference of Information Technology.
[7] Dr.N.Suma, Sandra Rhea Samson, S.Saranya, G.Shanmugapriya, R.Subhashri, “IOT Based Smart Agriculture Monitoring System”, Feb 2017 IJRITCC. [8] N.Heemageetha, “A survey on Application of Data Mining Techniques to Analyze the soil for agricultural purpose”, 2016IEEE.
[9] https://en.wikipedia.org/wiki/Nonlinear_regression [10] https://en.wikipedia.org/wiki/Linear_regression
[11] DhivyaB ,Manjula , Siva Bharathi, Madhumathi, “A Survey on Crop Yield Prediction based on Agricultural Data”, International Conferencence in Modern Science and Engineering,March 2017.
[12] GiritharanRavichandran, ,Koteeshwari R S “Agricultural Crop Predictor and Advisor using ANN for Smartphones”, 2016 IEEE.
[13]R.Nagini, Dr. T.V. Rajnikanth, B.V. Kiranmayee, “Agriculture Yield Prediction Using Predictive Analytic Techniques , 2nd InternationalConference on Contemporary Computing and Informatics (ic3i),2016