ORIGINAL ARTICLE
Effects of preheating temperature,
preheating time and their interaction
on the sandwich structure formation
and density profile of sandwich compressed
wood
Yanmei Wu
1, Li Qin
2, Rongfeng Huang
1*, Zhiqiang Gao
1,3and Ren Li
1,3Abstract
Effects of preheating times (4, 8, and 12 min), preheating temperatures (75–210 °C, with 15 °C interval), and their inter-actions on structures and density profiles of sandwich compressed poplar wood (Populus×euramericana cv. ‘Neva’) were studied to achieve better control of the position(s) of compressed layer(s), with the aim of better utilization of the low-density wood resources. Our findings revealed that, as a result of preheating temperature elevation or pre-heating time extension, compressed layers move gradually from wood surfaces to wood interior center, forming three types of sandwich compressed wood, namely, surface compressed wood, internal compressed wood, and central compressed wood. The characteristics of wood cell deformation in the sandwich compressed wood match well with the density distribution, and no obvious cell-wall cracks were observed. Effects of preheating temperature, preheating time, and preheating temperature–time interaction on the density of the compressed layer(s) are statistically insig-nificant. But their effects on the position and thickness of the compressed layer(s) in the sandwich compressed wood were statistically highly significant (p < 0.001), and the preheating temperature and compressed layer(s) positions were significantly related to the functions and fitted the polynomial of the fourth order.
Keywords: Sandwich compression, Preheating temperature–time interaction, Position of the compressed layer, Structural formation, Density profile
© The Author(s) 2019. This article is distributed under the terms of the Creative Commons Attribution 4.0 International License (http://creat iveco mmons .org/licen ses/by/4.0/), which permits unrestricted use, distribution, and reproduction in any medium, provided you give appropriate credit to the original author(s) and the source, provide a link to the Creative Commons license, and indicate if changes were made.
Introduction
Wood densification improves the physical and mechani-cal properties of solid wood by increasing the wood den-sity via reducing the void volume of the lumens [1–3]. Most studies on wood densification refer to wood sur-face densification, which is generally achieved by sursur-face pressing at high temperatures (higher than 140 °C) after long terms of conditioning for uniform moisture distribu-tion or after water spraying on surfaces [4–9]. However,
the position and thickness of the compressed layer(s) are not controllable. Recently, a novel wood sandwich com-pression technology has been developed by Huang et al. [2, 10]. For wood sandwich compression, solid wood is generally wetted on the surfaces, conditioned for around 20 h, then preheated and compressed to the target sand-wich compressed wood. Compared with the traditional wood compression, the signature advantage of sandwich compressed wood is that the compressed layer(s) can be controlled to any positions in wood interior. Wood sand-wich compression can minimize the volume loss of wood during compression, and also the physical and mechani-cal properties can be adjusted and thus controlled. Unlike wood surface densification where compression only occurs on the softened surfaces [11], wood sandwich
Open Access
*Correspondence: [email protected]
1 Key Lab of Wood Science and Technology of National Forestry
and Grassland Administration, Research Institute of Wood Industry, Chinese Academy of Forestry, Beijing 100091, China
compression technology can soften wood at different positions via adjusting preheating time and preheating temperatures [2, 12]. During the preheating process, tem-perature and moisture gradients are formed in the wood thickness direction, forming yield stress gradients inside wood. The layer with smaller yield stress is much easier to get compressed during pressing, forming the compressed layer, while other parts with higher yield stress are intact.
Wood softening is highly related to moisture and tem-perature [13], and complete softening of wood avoids fis-sure and fracture of wood cells in the compressed wood [14], and thus exerts no negative effects on the physical and mechanical properties of the compressed wood [15]. Moisture content in compressed wood depends on the pressing variables, but highly dependent of temperature and time [16]. It has been reported that pressing/preheat-ing temperature is the key parameter affectpressing/preheat-ing moisture diffusion and transferring rate in wood [17], while press-ing/preheating time mainly affects the heat-transfer scope and vapor pressure. Extending the heating time can increase both the temperature and moisture content in the core layers [18], thus forming temperature gradi-ent and moisture gradigradi-ent in wood. In addition, higher pressing/preheating temperatures accelerate moisture immigration and can thus reduce the required time for compression and drying [19, 20]. Thus, temperature, time, and their interaction are also the key factors affect-ing the position, thickness, and density, and the density peaks of the compressed wood.
Low heating temperature and short platens’ closing time contribute to a position of the compressed layer(s) close to wood surfaces, while higher heating tempera-ture or longer closing time induce the compressed lay-ers’ position toward the wood center. Compared with the results from compression for 0.5 min, 5 min of com-pression time was found to yield a smaller, larger den-sity peak, but more uniform denden-sity distribution, larger density thickness, as well as more central position of the density peak [6]. When the pressing time is 17 min, density is uniformly distributed along the wood thick-ness [21]. In our previous research [12], when wood was preheated at 60–210 °C for 12 min, distance between the compressed layer(s) and the wood surfaces increased
from 0 to 7.70 mm when the temperature elevated, and the thickness of the compressed layer(s) ranged from 4.98 to 8.10 mm and the average density of the compressed layer(s) is larger than 0.60 g/m3. Compressed wood
sam-ples with compressed layers either on the wood surfaces or the inside of wood were obtained after 10, 40, 240, and 420 s of preheating and being compressed at 180 °C [2].
Based on our previous study [2, 12], this study sys-tematically examines the effects of the preheating tem-perature, preheating time, and their interactions on the density distribution in the sandwich compressed wood and the deformation characteristics of the wood cells in the compressed wood. Besides, the functional relation-ship between the positions of the compressed layer(s) and the compression process parameters was established by applying the multiple nonlinear regression analysis method, which helps to provide an effective pathway for precisely tailoring the position of the compressed layer(s) in the sandwich compressed wood.
Materials and methods Materials
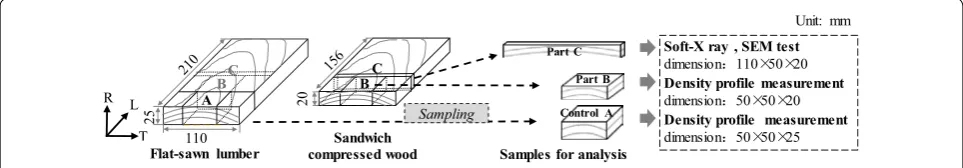
Poplar (Poplar ×euramericana cv. ‘Neva’) flat-sawn lumbers sourced from Guan County, Shandong Prov-ince, China, with a dimension of 500 mm (L) × 150 mm (T) × 30 mm (R) were kiln dried to a moisture content (MC) of 8.0%. Every lumber was cut into two sapwood lumbers with a dimension of 210 mm (L) × 110 mm (T) × 25 mm (R). 180 sapwood lumbers with the dimen-sion of 210 mm (L) × 110 mm (T) × 25 mm (R) were pre-pared, and these 180 specimens were separated into three groups for three preheating times of 4, 8, and 12 min. Each group contained 60 specimens. Sapwood lumbers were preheated at 75, 90, 105, 120, 135, 150, 165, 180, 195, or 210 °C, with six replicates for each condition. As shown in Fig. 1, control A with the size of 50 mm (L) × 50 mm (T) × 25 mm (R) was cut out from the sap-wood lumber specimen as the control before preheating. The rest part with a dimension of 156 mm (L) × 110 mm (T) × 25 mm (R) was used for the preparation of the sandwich compressed wood.
Samples for analysis BC
20
Sandwich compressed wood
Soft-X ray , SEM test
dimension˖110h50h20
Density profile measurement
dimension˖50h50h20
Density profile measurement
dimension˖50h50h25
Flat-sawn lumber
Part C
Part B
Control A
110
A
25
Unit: mm
Sampling BC
T R L
Methods
Preheating treatment and compression process
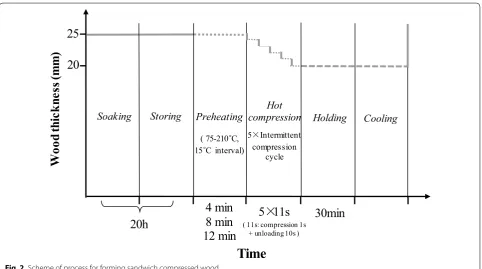
Before preheating and compression, the wood speci-mens were first coated with wax on the transverse sec-tions and then soaked in water. After 2 h soaking in water, the specimens were stored in sealed plastic bags for 18 h (MC ≈ 20%). After 18 h storage in plastic bags, six specimens were weighed and then placed immedi-ately on the lower preheated press platen. The distance between upper platen and bottom platen was adjusted to exactly 25 mm for preheating the specimens. After the preheating, each specimen was weighed and returned to the heating platen for intermittent com-pression. In all cases, the elapsed time from weighing the specimens to the start of intermittent compression was set as less than 1 min. Intermittent compression was applied on the preheated wood under 6.0 MPa at a rate of 1 mm/s. Each intermittent compression cycle consisted of 1 s of compression and 10 s of unloading. The specimens were compressed to 20 mm thickness from the original thickness of 25 mm after five com-pression cycles. The final compressed wood thickness of 20 mm was maintained for 30 min at the preheat-ing temperature. The heatpreheat-ing platens were then cooled down to 60 °C, and the sandwich compressed wood was removed from the hot press for further characteriza-tions. Conditions for the whole process are illustrated in Fig. 2.
Characterizations of sandwich compressed wood
Density measurement To minimize the error, part B with a dimension of 50 mm (L) × 50 mm (T) × 20 mm (R) was cut out from the sandwich compressed wood, as illustrated in Fig. 1. Control A and part B were then condi-tioned to constant weight at 20 °C in 65% relative humid-ity. Control A and part B were then scanned using an X-ray densitometer (DENSE-LAB mark 3, E.W.S. GmbH, Germany) at intervals of 20 µm from the top surface to the bottom surface, to measure the density in the sandwich compressed wood. An average value of the six specimens was applied for the evaluation.
Determination of compressed layer(s) The average den-sity of poplar wood was 0.44 g/cm3. Since compression
ratio of sandwich compressed wood was 20%, the com-pressed layer(s) is identified as the parts with a density that is 20% higher than the average density of the control specimen. The region with density less than the average density of the control is considered as the uncompressed layer. The number of the compressed layers is defined as the number of compressed layers in the thickness direc-tion of the compressed wood. The posidirec-tion of compressed layer(s) is defined as the distance from the edge of the compressed layer(s) to the corresponding surface(s) of the compressed wood. The compressed layers’ thickness is the sum of all the compressed layers’ thicknesses. The com-pressed layer(s) density and the peak density are the mean
Time
)
m
m(
ss
en
kci
ht
do
o
W
25
4 min
8 min
12 min
20
Holding
Soaking Storing Preheating
( 75-210eC, 15eC interval)
5
h
11s
( 11s: compression 1s + unloading 10s )
Cooling
30min
Hotcompression 5hIntermittent
compression cycle
20h
density and maximal density of the compressed layer(s), respectively.
Morphological structure As shown in Fig. 1, specimen with a dimension of 5 mm (L) × 5 mm (T) × 5 mm (R) that consisted of compressed layer and uncompressed layer was cut from part C of each compressed lumber (as shown in Fig. 1). The cutting surfaces were sputter-coated with gold, and the transverse surfaces of each specimen was scanned using scanning electric microscope (SEM) at magnifications of 30×, 200× and 400×, to investigate the morphological structure of the compressed wood.
Data statistical analysis
The analysis of variance (ANOVA) and fitting function calculation were applied for the data analysis using SPSS software (SPSS V18, USA).
Results and discussion
Structural formation of sandwich compressed wood
Density profiles analysis
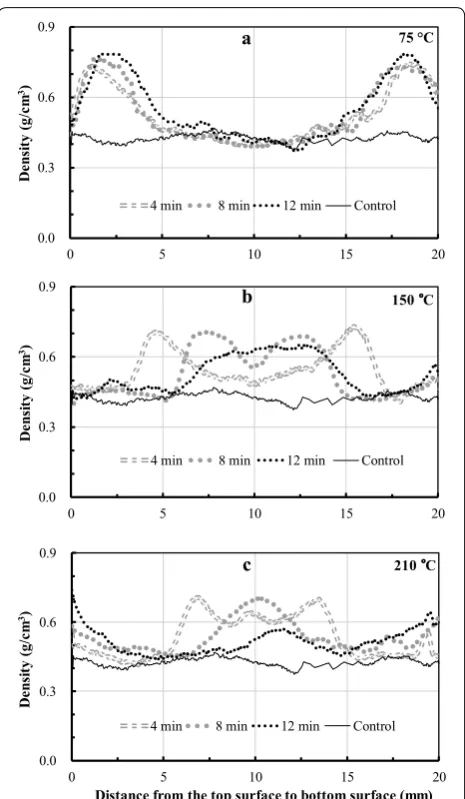
Figure 3a shows the density profiles of the sandwich com-pressed wood preheated at 75 °C for 4, 8, and 12 min. The density profile of the sandwich compressed wood preheated at 75 °C for 4 min has two compressed layers with a density peak of 0.75 g/cm3. The compressed layers
are formed at around 4 mm below the upper surface and 4 mm above lower surface, respectively. While the den-sity profile in the area that is 10 mm away from the center along the thickness of the compressed wood is almost the same as that of the control specimen, suggesting that the central layer is uncompressed. This sandwich com-pressed wood is defined as surface comcom-pressed wood. By adjusting the original moisture content of wood [12], a moisture gradient can be formed, namely high moisture content on the wood surfaces but low moisture content in the wood center. When moisture content is 20%, Tg of
lignin is only 80 °C [13]. Preheating temperature eleva-tion to the Tg is required for the wood surface softening
and compression. When the preheating time is extended to 8 or 12 min, the position of density peak in com-pressed layer(s) moves forward to the wood center, but the moving distance is comparatively small and the thick-ness of the compressed layer(s) increases a little. This is attributed to the fact that at low preheating temperature, moisture moves slowly and thus limits the wood soften-ing area.
Due to the preheating temperature elevation and pre-heating time extension before compression, density peak of the compressed layer(s) moved forward into the wood center (Fig. 3b). When wood is preheated at 150 °C for 4 min, two compressed layers with a density peak of 0.7 g/ cm3 in both the compressed layers are observed. The
density peaks are 3 mm above and below of the associated surfaces of the sandwich compressed wood. Extension of preheating time to 8 min leads to the integration of two compressed layers into single layer in the wood center, forming the central compressed wood. The conditions of 150 °C and 8 min are considered as the integration point for compressed layers, even though at this point, the compressed layers are not completely overlapped and two density peaks exist. When the preheated time is fur-ther extended to 12 min, the compressed layer becomes the one with only one density peak, but the density peak is lower than that of compressed layer(s) obtained from preheating for 4 or 8 min. During the preheating, water/ moisture move from higher moisture content areas to lower moisture content areas through cell cavities and
0.0 0.3 0.6 0.9
0 5 10 15 20
De
ns
ity
(g/c
m
3)
75 °C
4 min 8 min 12 min Control
0.0 0.3 0.6 0.9
0 5 10 15 20
De
ns
ity
(g/c
m
3)
150 eC
4 min 8 min 12 min Control
0.0 0.3 0.6 0.9
0 5 10 15 20
De
ns
ity
(g/c
m
3)
Distance from the top surface to bottom surface (mm) 210 eC
4 min 8 min 12 min Control a
b
c
pit openings, water/moisture, and heat transfer from the wood surfaces to the wood interior, and new tempera-ture and moistempera-ture gradients were formed in the compres-sion direction of wood [22]. Once pressure is loaded on the wood, a new yield stress gradient is formed, yielding various positions of compressed layers, and the distance between the wood surface and the associated edge of com-pressed layer (the comcom-pressed layer position) gradually increases, and the compressed layers eventually integrate to form a single layee in the wood center. In this process, the function of temperature gradient transfer from the thickness direction into horizontal direction is to transfer heat; the moisture vapor diffuses into the transverse sec-tion of wood, resulting in reduced moisture content and thereby decreasing the moisture gradient, forming a more uniform density distribution in wood. This observation is consistent with Wang’s report [21]. However, this finding varies with our previous report wherein higher preheating temperature resulted in higher density of the compressed layer [12], which could be resulting from the smaller spec-imen size and faster water loss during the preheating.
Figure 3c shows that when the preheating temperature is elevated to 210 °C and the preheating time is extended to 8 or 12 min, the surface density increases, and two compressed layers are formed on the surfaces of the resulting compressed wood, and one central compressed layer also appears in the wood center. This is due to the fact that the wood interior with lower yield stress can be compressed much more easily, while those with higher yield stress require higher pressures to get compressed. When the preheating temperature and preheating time are 210 °C and 4 min, respectively, a single overlapped compressed layer cannot be formed in the wood center, leading to the inference that even at high temperature, 4 min preheating time is not long enough for effective heat transfer from the surface to the center.
Microscopic analysis
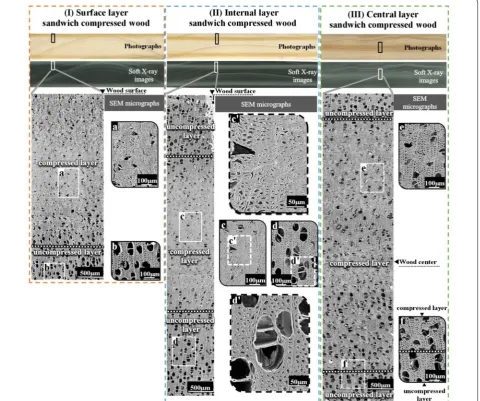
Microscopic imaging on the transverse sections of the compressed wood was performed to examine the charac-teristics of the wood cell’s deformation. Figure 4 presents soft X-ray and SEM images of specimens from the surface compressed wood, the internal compressed wood, and the central region of the central compressed wood. The density profiles are also presented for the transverse sections of the sandwich compressed wood specimens. The compressed layer is the dark area in the photographs, whereas in the soft X-ray images, the compressed layer is the high lumi-nance layer.
Wood sections as shown in the small box of the photo-graphs and X-ray images in Fig. 4 are used for SEM scan-ning. As illustrated by the SEM images, the compressed wood obtained via preheating at 75 °C for 4 min has
different degrees of flexion in the shape of the first layer from the surface layer to the depth of 3.5–4.0 mm below the surface (Fig. 4I). When the preheating temperature is 120 °C, the cell deformation occurs at the position of 1.5–2 mm below the surface, and the thickness of the compressed layer is approximately 4 mm (Fig. 4II). When the preheating temperature elevates to 180 °C and the preheating time extends to 12 min, all the cell walls locate in the area around 5 mm from the center of the thickness direction deform (Fig. 4III).
The microscopic observations also reveal that the ves-sels and the wood fiber cells are intact in the uncom-pressed layer. However, the lumen of some vessels and the wood fibers in the compressed layer(s) disappear, and some greatly deformed vessel lumens are also observed at low magnification (30×). Even though a large number of the deformed wood fiber cell lumens are observed at high magnification (200×), no obvious cell–wall fissure appears in SEM image of internal compressed wood with 400× magnification as shown in Fig. 4II. Small cracks in the surface compressed wood and central compressed wood are observed in Fig. 4I and III. However, simi-lar cracks are also found in untreated samples. Reason for this cracking might be resulting from kiln drying of wood [23]. Most of the vessels in the compressed layer of central compressed wood are greatly deformed, but only some of the vessel lumens completely disappear. Mean-while, most of the wood fibers slightly deform, and the cell lumens are still clearly visible, i.e., the compressed layer contains more cell lumens compared to that in the surface and interior compressed woods.
Scanning electric microscope observations are con-sistent with the density profiles. The regions with lower density correspond to areas with more voids, i.e., open vessels, whereas the vessels are completely closed in the high-density regions. The sandwich compression char-acteristics observed here and the degree of the wood cells deformation in the compressed layer are consistent with the density profile characteristics of the sandwich compressed wood, further confirming the feasibility of controlling the density distribution by adjusting the preheating time and temperature. In addition, the wood cells only deform in the compressed layer(s). Finally, it is observed that the cell deformation is caused by the buck-ling deformation of the wood cell wall in the compression direction and that the deformed cell wall is not broken.
Density profile of sandwich compressed wood
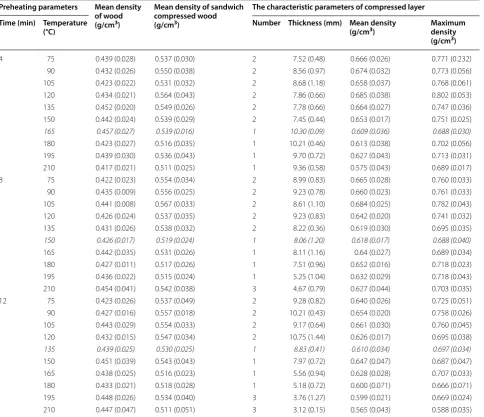
Thickness, density, and density peak of the compressed layer(s)
summarized in Table 1. Preheating at 135 °C for 12 min, 150 °C for 8 min, and 165 °C for 4 min are conditions for the convergence of the compressed layers.
The thicknesses of compressed layer(s) range from 3.12 to 10.75 mm. When the preheating time is 4 min, the thickness first decreases, then increases as a result of temperature elevation, and the top and bottom com-pressed layers integrate into one, reaching to the larg-est thickness of 10.30 mm when wood is preheated at 165 °C for 4 min. In contrast, when the preheating time is longer than 8 min, the thickness of the com-pressed layer first increases then reduces due to the preheating temperature elevation, and the largest com-pressed layer(s) thickness of 10.75 mm appears when
the preheating temperature and time are 120 °C and 12 min, respectively.
The average density of all the compressed layers is greater than 0.64 g/cm3, and the mean density and
maxi-mum density of the compressed layers tend to increase first, and then decrease as a result of the temperature elevation. For compressed wood preheated at 120 °C for 4 min, the highest average density and density peak are 0.685 and 0.802 g/cm3, respectively, which are 55.68 and
82.27% higher than that of the control. When the preheat-ing time is extended to 8 or 12 min, the highest average density of the compressed layers can be obtained at 105 °C.
Analysis of variance (Table 2) suggests that the pre-heating temperature and prepre-heating time–temperature
interaction both exert statistically highly significant effects on the position and thickness of the compressed layer (p < 0.001). The effect of preheating time on the position of the compressed layer is also statistically highly significant, while its effect on the thickness is just statistically significant. However, the density of the compressed layer is not significantly affected by the preheating time, preheating temperature, or preheating time–temperature interaction in the investigated ranges.
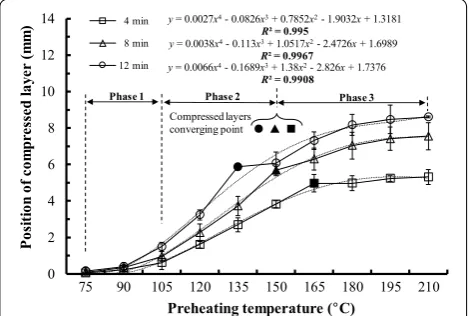
Position of compressed layer(s)
A multiple nonlinear regression equation is used to build up the relationship between the preheating temperature
and position of compressed layer(s). Position of com-pressed layer(s) is defined as the distance between the edge of the compressed layer(s) and the corresponding surface(s) of the compressed wood. As shown in Fig. 5, preheat-ing temperature and compressed layer(s) position are sig-nificantly related to the fitted function relationships, and the determination coefficients (R2) are 0.9967 and 0.9908,
respectively. All the curves have three turning temperature ranges with the elevated temperature: range (75–105 °C) for slow moving rate; range for the fast moving rate, 105 °C is the starting temperature point for the convergence of the compressed layers; and the third range is the platform area after the convergence of the compressed layers.
Table 1 Density profile characteristics of sandwich compressed wood formed under different preheating conditions
Each value in parenthesis is standard deviation of six specimens; italic emphasizes preheating at 135 °C for 12 min, 150 °C for 8 min, and 165 °C for 4 min are conditions for the convergence of the compressed layers; when there are three compressed layers, the thickness, mean density, and maximum density of the compressed layer are the results of the central compressed layer
Preheating parameters Mean density
of wood (g/cm3)
Mean density of sandwich compressed wood (g/cm3)
The characteristic parameters of compressed layer Time (min) Temperature
(°C) Number Thickness (mm) Mean density(g/cm3) Maximum density
(g/cm3)
4 75 0.439 (0.028) 0.537 (0.030) 2 7.52 (0.48) 0.666 (0.026) 0.771 (0.232)
90 0.432 (0.026) 0.550 (0.038) 2 8.56 (0.97) 0.674 (0.032) 0.773 (0.056)
105 0.423 (0.022) 0.531 (0.032) 2 8.68 (1.18) 0.658 (0.037) 0.768 (0.061)
120 0.434 (0.021) 0.564 (0.043) 2 7.86 (0.66) 0.685 (0.038) 0.802 (0.053)
135 0.452 (0.020) 0.549 (0.026) 2 7.78 (0.66) 0.664 (0.027) 0.747 (0.036)
150 0.442 (0.024) 0.539 (0.029) 2 7.45 (0.44) 0.653 (0.017) 0.751 (0.025)
165 0.457 (0.027) 0.539 (0.016) 1 10.30 (0.09) 0.609 (0.036) 0.688 (0.030)
180 0.423 (0.027) 0.516 (0.035) 1 10.21 (0.46) 0.613 (0.038) 0.702 (0.056)
195 0.439 (0.030) 0.536 (0.043) 1 9.70 (0.72) 0.627 (0.043) 0.713 (0.031)
210 0.417 (0.021) 0.511 (0.025) 1 9.36 (0.58) 0.575 (0.043) 0.689 (0.017)
8 75 0.422 (0.023) 0.554 (0.034) 2 8.99 (0.83) 0.665 (0.028) 0.760 (0.033)
90 0.435 (0.009) 0.556 (0.025) 2 9.23 (0.78) 0.660 (0.023) 0.761 (0.033)
105 0.441 (0.008) 0.567 (0.033) 2 8.61 (1.10) 0.684 (0.025) 0.782 (0.043)
120 0.426 (0.024) 0.537 (0.035) 2 9.23 (0.83) 0.642 (0.020) 0.741 (0.032)
135 0.431 (0.026) 0.538 (0.032) 2 8.22 (0.36) 0.619 (0.030) 0.695 (0.035)
150 0.426 (0.017) 0.519 (0.024) 1 8.06 (1.20) 0.618 (0.017) 0.688 (0.040)
165 0.442 (0.035) 0.531 (0.026) 1 8.11 (1.16) 0.64 (0.027) 0.689 (0.034)
180 0.427 (0.011) 0.517 (0.026) 1 7.51 (0.96) 0.652 (0.016) 0.718 (0.023)
195 0.436 (0.022) 0.515 (0.024) 1 5.25 (1.04) 0.632 (0.029) 0.718 (0.043)
210 0.454 (0.041) 0.542 (0.038) 3 4.67 (0.79) 0.627 (0.044) 0.703 (0.035)
12 75 0.423 (0.026) 0.537 (0.049) 2 9.28 (0.82) 0.640 (0.026) 0.725 (0.051)
90 0.427 (0.016) 0.557 (0.018) 2 10.21 (0.43) 0.654 (0.020) 0.758 (0.026)
105 0.443 (0.029) 0.554 (0.033) 2 9.17 (0.64) 0.661 (0.030) 0.760 (0.045)
120 0.432 (0.015) 0.547 (0.034) 2 10.75 (1.44) 0.626 (0.017) 0.695 (0.038)
135 0.439 (0.025) 0.530 (0.025) 1 8.83 (0.41) 0.610 (0.034) 0.697 (0.034)
150 0.451 (0.039) 0.543 (0.043) 1 7.97 (0.72) 0.647 (0.047) 0.687 (0.047)
165 0.438 (0.025) 0.516 (0.023) 1 5.56 (0.94) 0.628 (0.028) 0.707 (0.033)
180 0.433 (0.021) 0.518 (0.028) 1 5.18 (0.72) 0.600 (0.071) 0.666 (0.071)
195 0.448 (0.026) 0.534 (0.040) 3 3.76 (1.27) 0.599 (0.021) 0.669 (0.024)
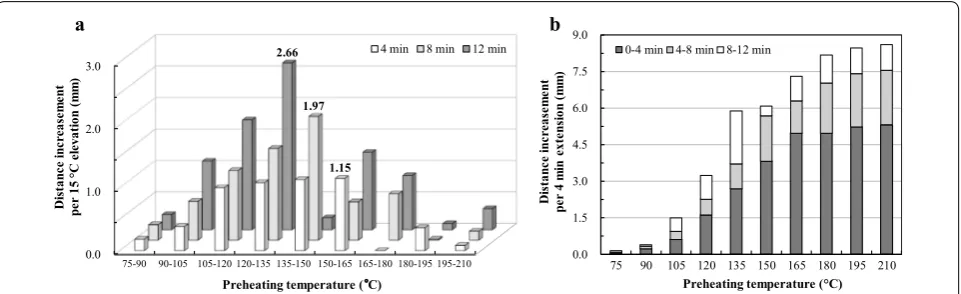
Range for slow moving rate (Phase 1): When the pre-heating temperature elevates from 75 to 105 °C, the dis-tance between the compressed layer and the compressed wood surface increase. And the rate of distance increas-ing increases with the increase in the extended preheat-ing time, rangpreheat-ing from 0.18 to 1.09 mm/°C (Fig. 6a). In contrast, the rate of distance increasing due to the pre-heating time extension reduces (Fig. 6b). For the sand-wich compressed wood preheated for 4, 8, or 12 min, distance from the edge of the compressed layer(s) to the corresponding surface(s) of the compressed wood increases sharply when the preheating temperature ele-vates from 90 to 105 °C, which is 2, 2.5, or 4.5 times of that attributed to the temperature elevation ranging from
75 to 90 °C, respectively. At 90 °C, water in wood moves slowly; when the temperature is above 100 °C, water in the wood exists as vapor and the vapor moving rate accel-erates, but water conversion into vapor requires more energy [12], and water vaporization retards the heating transfer [16]. Thus, the moving rate of the compressed wood in this temperature range is comparatively slow.
Range for fast moving rate (Phase 2): namely, from 105 °C to the converging point of the compressing lay-ers. Compared with the range for slow moving rate, the rate of increasing distance between the compressed layer and the compressed wood surface attributed to each 15 °C elevation is large and the compressed layers con-verge into one, and the distance changes become the highest, which are 1.15, 1.97, and 2.66 mm, respectively. Temperature elevation and time extension accelerate the rates of temperature transfer and water immigration, making the position of compressed layers move faster toward the wood center. As shown in Fig. 6b, the distance changes (between the compressed layer and the com-pressed wood surface) increase because the preheating time extensions from 0 to 4 min, 4 to 8 min, 8 to 12 min are higher when the preheating temperature is larger, and the highest distance changes are 4.97, 1.86, and 2.17 mm, respectively. It is obvious that the distance changes increase due to the preheating time extension from 0 to 4 min is much higher than that resulting from the pre-heating time extension ranges from 4 to 8 min, and from 8 to 12 min. This is due to the fact that at high tempera-tures, high moisture content contributes to a larger heat-transfer rate [6]. Meanwhile, higher temperatures lead to higher temperature gradient [12], while longer preheat-ing time makes the temperature gradient smaller, which slows down the moisture immigration and thus reduces the position of compressing layer’s moving rates.
Table 2 Effects of preheating time, temperature, and their interaction on the characteristic parameters of compressed layer
TIM—preheating time; TEM—preheating temperature; TIM × TEM —interactions between preheating time and preheating temperature; *, **, and *** indicate significances at the p < 0.05, p < 0.01, and p < 0.001 levels, respectively; ns indicates no significant difference
Characteristic parameters
of compressed layer Impact factor SS Df MS F Sig.
Position TIM 71.510 2 35.755 101.55 ***
TEM 699.434 6 116.572 331.07 ***
TIM × TEM 35.503 12 2.959 8.40 ***
Thickness TIM 7.409 2 3.704 3.54 *
TEM 56.802 6 9.467 9.04 ***
TIM × TEM 167.737 12 13.978 13.34 ***
Density TIM 0.386 2 0.193 0.75 ns
TEM 1.855 6 0.309 1.20 ns
TIM × TEM 3.062 12 0.255 0.99 ns
y= 0.0027x4- 0.0826x3+ 0.7852x2- 1.9032x+ 1.3181
R² = 0.995
y= 0.0038x4- 0.113x3+ 1.0517x2- 2.4726x+ 1.6989
R² = 0.9967
y= 0.0066x4- 0.1689x3+ 1.38x2- 2.826x+ 1.7376
R² = 0.9908
0 2 4 6 8 10 12 14
75 90 105 120 135 150 165 180 195 210
Posi
tion
of
co
mp
re
sse
d
la
ye
r
(mm)
Preheating temperature (°C)
4 min
8 min
12 min
Phase 1 Phase 2 Phase 3
Compressed layers converging point ƽ Ʒ Ƶ
Platform area after the convergence of the compressed layers (Phase 3): from the converging temperature to 210 °C, every 15 °C elevation (Fig. 6a) or every 4 min of preheating time extension (Fig. 6b) results in slow move-ment of the compressing layers. When the preheating temperature is higher than the converging point of the compressing layers, moisture content in the wood center increases and for heating up this part, more energy is required. Also, the lower the surface moisture content is, the higher the moisture content appears in wood. Changes of temperature gradient and moisture gradient decelerate moisture immigration. Meanwhile, the tem-perature elevation and the preheating time extension at high temperature (higher than 165 °C) reduce the mois-ture content of wood and thus decrease the vapor pres-sure as well as the heat transfer. Extension of preheating time from 8 to 12 min results in the rate of distance increasing to 0.25 mm/min, which is just one half of that resulting from the preheating time extension from 4 to 8 min (Fig. 6b). When preheating time extends from 0 to 4 min, the moisture content of wood is still compara-tively high, and the rate of distance increasing is around 1.25 mm/min.
Conclusion
In this study, three structure modes of sandwich com-pressed wood were achieved by controlling the pre-heating temperature and the prepre-heating time. The density characteristics of the sandwich compressed wood depended on the extent of the wood cell-wall deformation, which was affected by the preheat-ing temperature and time. No obvious cracks were observed in the cell wall of the compressed layer(s), regardless of the preheating temperature or preheating
time in the investigated ranges. Our findings revealed that effects of the preheating temperature, preheat-ing temperature/time interaction on the position, and thickness of the compressed layer(s) in the compressed wood were statistically highly significant. Effect of pre-heating time on the position of the compressed layer(s) was also statistically highly significant, while the effect of preheating time on the thickness of the compressed layer(s) was just statistically significant. In addition, the preheating temperature and compressed layer(s) position were significantly related to the functions that fitted the polynomial of the fourth order. However, effects of preheating temperature, preheating time, or preheating temperature–time interaction on the den-sity of the compressed layer(s) were insignificant.
Abbreviations
MC: moisture content; SEM: scanning electric microscope.
Authors’ contributions
RH and YW designed the experiments and were major contributors in writing the manuscript; YW and ZG performed the experiments; All authors contrib-uted to interpretation and discussed results. All authors read and approved the final manuscript.
Author details
1 Key Lab of Wood Science and Technology of National Forestry and Grassland Administration, Research Institute of Wood Industry, Chinese Academy of For-estry, Beijing 100091, China. 2 Planning and Design Institute of Forest Products Industry, National Forestry and Grassland Administration, Beijing 100714, China. 3 College of Materials Science and Technology, Beijing Forestry Univer-sity, Beijing 100083, China.
Acknowledgements
This research was sponsored by the National Natural Science Foundation of China (Grant No. 31670557): Formation Mechanism and Controllability of Wood Sandwich Compression by Hydro-thermal Control.
Competing interests
The authors declare that they have no competing interests. 0.0
1.5 3.0 4.5 6.0 7.5 9.0
75 90 105 120 135 150 165 180 195 210
Di
stan
ce
in
cr
ease
me
nt
pe
r
4
mi
n
exte
ns
io
n (
mm)
Preheating temperature (°C) 0-4 min 4-8 min 8-12 min
b
0.0 1.0 2.0 3.0
75-90 90-105 105-120 120-135 135-150 150-165 165-180 180-195 195-210
1.15 1.97 2.66
Di
stan
ce
in
cr
ease
me
nt
pe
r
15
°C
el
ev
at
io
n
(mm)
Preheating temperature (eC)
4 min 8 min 12 min a
Availability of data and materials
Data sharing is not applicable to this article as no datasets were generated or analyzed during the current study.
Funding
This research was sponsored by the National Natural Science Foundation of China (Grant No. 31670557).
Publisher’s Note
Springer Nature remains neutral with regard to jurisdictional claims in pub-lished maps and institutional affiliations.
Received: 25 October 2018 Accepted: 20 February 2019
References
1. Inoue M, Norimoto M, Otsuka Y, Yamada T (1990) Surface compression of coniferous wood lumber I. A new technique to compress the surface layer. Mokuzai Gakkaishi 36(11):969–975
2. Huang RF, Wang YW, Zhao YK, Lu JX, Zhang YM (2012) Sandwich compression of wood by hygro-thermal control. Mokuzai Gakkaishi 58(2):84–89 (in Japanese)
3. Song JW, Chen CJ, Zhu SZ et al (2018) Processing bulk natural wood into a high-performance structural material. Nature 554:224–228
4. Gong M, Lamason C, Li L (2010) Interactive effect of surface densifica-tion and post-heat-treatment on aspen wood. J Mater Process Technol 210:293–296
5. Rautkari L, Properzi M, Pichelin F, Hughes M (2010) Properties and set-recovery of surface densified Norway spruce and European beech. Wood Sci Technol 44:679–691
6. Rautkari L, Laine K, Laflin N, Hughes M (2011) Surface modification of Scots pine: the effect of process parameters on the through thickness density profile. J Mater Sci 46:4780–4786
7. Laine K, Rautkari R, Hughes M (2013) The effect of process parameters on the hardness of surface densified Scots pine solid wood. Eur J Wood Wood Prod 71:13–16
8. Zhan JF, Avramidis S (2016) Needle fir wood modified by surface densifi-cation and thermal post-treatment: hygroscopicity and swelling behavior. Eur J Wood Wood Prod 74:49–56
9. Laskowska AK (2017) The influence of process parameters on the density profile and hardness of surface-densified Birch wood (Betula pendula
Roth). BioResources 12(3):6011–6023
10. Gao ZQ, Huang RF, Lu JX, Chen ZJ, Guo F, Zhan TY (2016) Sandwich com-pression of wood: control of creating gradient on lumber thickness and properties of compressed wood. Wood Sci Technol 50(4):833–844 11. Rautkari L, Laine K, Kutnar A, Medved S, Hughes M (2013) Hardness and
density profile of surface densified and thermally modified Scots pine in relation to degree of densification. J Mater Sci 48:2370–2375
12. Li R, Gao ZQ, Feng SH, Chang JM, Wu YM, Huang RF (2018) Effects of preheating temperatures on the formation of sandwich compression and density distribution in the compressed wood. J Wood Sci 64(6):751–757 13. Furuta Y, Nakajima M, Nakanii E, Ohkoshi M (2010) The effects of lignin
and hemicelluloses on thermal-softening properties of water-swollen wood. Mokuzai Gakkaishi 56(3):132–138 (in Japanese)
14. Wolcott MP, Kamke FA, Dillard DA (1990) Fundamentals of flakeboard manufacture: viscoelastic behavior of the wood component. Wood Fiber Sci 22(4):345–361
15. Navi P, Girardet F (2000) Effects of thermo-hydro-mechanical treatment on the structure and properties of wood. Holzforschung 54:287–293 16. Kúdela J, Rousek R, Rademacher P, Rešetka M, Dejmal A (2018) Influence
of pressing parameters on dimensional stability and density of com-pressed beech wood. Eur J Wood Wood Prod 76(4):1241–1252 17. Hunter AJ (1993) On movement of water through wood—the diffusion
coefficient. Wood Sci Technol 27:401–408
18. Tu DY, Su XH, Zhang TT, Fan WJ, Zhou QF (2014) Thermo-mechanical den-sification of Populus tomentosa var. tomentosa with low moisture content. Bioresources 9(3):3846–3856
19. Ito Y, Tanahashi M, Shigematsu M, Shinoda Y, Ohta C (1998) Compressive-molding of wood by high-pressure steam-treatment: part 1. Develop-ment of compressively molded squares from thinnings. Holzforschung 52(2):211–216
20. Simpson WT, Danielson JD, Sidney Boone R (1988) Press-drying plantation-grown loblolly pine 2 by 4’s to reduce warp. Forest Prod J 38(11/12):41–48
21. Wang JY, Cooper PA (2005) Effect of grain orientation and surface wetting on vertical density profiles of thermally compressed fir and spruce. Holz als Roh- und Werkstoff 63(6):397–402
22. Zhan JF, Avramidis S (2017) Transversal mechanical properties of surface-densified and hydrothermally modified needle fir wood. Wood Sci Technol 51(4):721–738