Capacitive gas-phase detection in liquid nitrogen
Christoph Kandlbinder1, Alice Fischerauer1, Mario Mösch1, Tobias Helling1, Gerhard Fischerauer1, and Martin Siegl2
1Chair of Measurement and Control Systems, Center of Energy Technology (ZET), University of Bayreuth,
95440 Bayreuth, Germany
2Institute of Space Systems, German Aerospace Center (DLR), 28359 Bremen, Germany
Correspondence to:Chistoph Kandlbinder ([email protected])
Received: 13 August 2016 – Revised: 1 February 2017 – Accepted: 12 February 2017 – Published: 2 March 2017
Abstract. The main and upper stages of heavy lift launchers for space applications are often fuelled by cryo-genic liquids. In order to enable the re-ignition of a cryocryo-genic upper stage for orbital changes, it is crucial to study the behaviour of these fluids in microgravity. As gaseous bubbles entering the fuel lines of the engine can cause the destruction of the engine, these bubbles are a risk for the functionality of the re-ignition mode. To measure an evolving gaseous phase and its volume, a capacitive measurement system for two-phase mixtures was realised. Its electrodes are arranged in such a way that phase changes inside a vessel can be detected without parasitic heating under cryogenic conditions. Two cases have been investigated: a fill-level measurement involving a large gas bubble above a homogenous liquid on the one hand, and the identification of a bubble stream inside a liquid on the other hand. The system concept was tested in a cryogenic environment allowing the controlled generation of bubble streams inside liquid nitrogen and of a contiguous gaseous volume above the liquid. The characteristics of the measurable capacitances of different pairs of electrodes were experimentally determined and compared with finite-element simulations (Ansys). In addition, the electrical flux density was computed to corroborate the simulated capacitance curves with theoretical statements. The experimental findings closely agree with the sim-ulated results if possible disturbances due to the characteristics of the capacitance measurement hardware are properly taken into account. Thus, by measuring various capacitances, it was possible to determine the level up to which a receptacle inside a liquid-nitrogen tank was filled with liquid (the space above the liquid being taken up by gaseous nitrogen), to identify the existence of a bubble stream in the liquid nitrogen and to demonstrate that the capacitance measurement results enable one to differentiate between the two cases.
1 Introduction
For future space vehicles like the Ariane 6 rocket of the Eu-ropean Space Agency (ESA), re-ignition of the upper stage driven by cryogenic liquids will play a key role. Upper stages already surrounding Earth must re-ignite their thrust engine to change into a higher orbit. This possibility could open up new opportunities for space applications, like releasing one part of the payload into a lower orbit and another part into a higher orbit (Stolten and Emonts, 2016).
In order to observe fluid phenomena occurring in micro-gravity and to eventually influence their behaviour, it is cru-cial, especially for partially filled tanks, to determine the lo-cation of the liquid phase and the topology of the free surface.
As capillary forces are dominant under microgravity condi-tions, these forces determine the shape and position of the free surface. Additionally, gas bubbles can come into exis-tence by sloshing, changes in gravitational forces, or external heat input. If these bubbles enter the fuel lines of the turbop-umps, the pumps can be destroyed by cavitation effects. This would render a re-ignition impossible. To analyse these phe-nomena, experiments with suitable measurement systems are inevitable (Stolten and Emonts, 2016; Siegl et al., 2015).
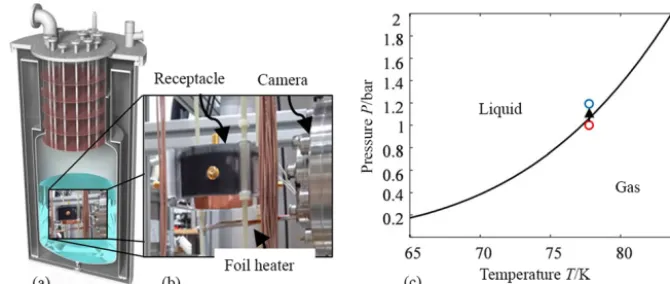
Figure 1.Cryostat as measurement environment.(a)Structure of the cryostat.(b)Built-in cylindrical receptacle with foil heater and camera. (c)Pressure–temperature (p−T) diagram of liquid nitrogen (LN2) (Span et al., 2000).
Current measurement systems for cryogenic environ-ments use gamma-ray-based (Carapelle and Colette, 2005), microwave-based (Ohira, 2004), radio-frequency-based (Fil-ippov et al., 2013), resistive, or capacitive (Jiang and Zhang, 2011) principles. Some of them intrude into the volume un-der investigation, and some can lead to a local heat input or other parasitic effects (Mukhopadhyay, 2010). Among them, capacitive sensors promise a high potential to not only de-termine the position of the surface of a liquid phase (i.e. the position of the liquid-to-gas interface), but to also be cost-efficient, simple, and to show fast reaction times (Carapelle and Colette, 2005; Medeova et al., 1998; De Kerpel et al., 2013). They neither disturb the liquid movement nor do they heat the liquid. The required electrodes can be integrated into walls of fuel lines or smaller tanks inside space sys-tems in such a manner that the tank geometry need not be modified (Nurge et al., 2003). The capacitive observability of a single gas–liquid phase boundary under cryogenic condi-tions has been demonstrated by Hennes and Barnard (1964) and Kügler et al. (1984) with liquid nitrogen (LN2) as the
liquid; based on this, a fill-level resolution of ±1 mm was reached. Successful fill-level measurements have also been reported by Matsumoto et al. (2011) with liquid hydrogen (LH2). The earlier studies, of course, did not have access to
modern electronics and thus had to limit themselves to very specific geometries and measurement purposes. But even the recent work in Matsumoto et al. (2011) did not aim for a de-tailed investigation of the electrode geometry, its influence on the measurable capacitances, the information which may be extracted from these capacitances on quantities other than the fill level, and the possibly error-producing influence of the capacitance measurement hardware. We have designed and tested a capacitive system for gas-phase detection under cryogenic applications. We specifically investigated the ca-pacitance measurement process itself and how well the sys-tem can differentiate between single-phase boundaries (large gas bubble above a sea of LN2 as it is assumed in
fill-level measurement) and multiple phase boundaries (stream
of many small gas bubbles rising in a sea of LN2) as such
effects are likely to occur in zero-gravity environments.
2 Hardware
2.1 Cryostat
Since the measurement system that will be described later has to be tested in cryogenic liquids, a cryostat is used as a test environment (Fig. 1a and b). The inner tank of the cryo-stat could be pressurised up to 4 bar while the space between the inner and outer tank could be filled with LN2for further
thermal isolation from the environment. Inside the inner tank, a foil heater was mounted for defined bubble generation by local heat input into the LN2.
The liquid–vapour system in the cryostat was either kept on the boiling curve or in a slightly subcooled state. By ad-justing the pressure, it was then possible to control the vol-ume of gaseous nitrogen inside the tank. When the pres-sure rose inside the cryostat upon clopres-sure of a valve, the gaseous volume shrank because of condensation processes, and the liquid assumed a subcooled state. This is visible in a pressure–temperature (p−T-) diagram (Fig. 1c). The work-ing point is marked by a red circle located on or slightly be-low the boiling curve. When the pressure rises, the working point moves upward into the region associated with the liq-uid state (blue circle). As a consequence, a gaseous volume trapped in a liquid phase condensates. By using these princi-ples, the gas-to-liquid ratio inside this trapped volume can be controlled.
However, the foil heater can generate bubbles by locally heating the LN2 so that subcooled nucleate or film boiling
can come into existence. These generated bubbles can rise until they reach the surface of LN2. If they are trapped while
Figure 2.Photograph of the circular cylindrical polycarbonate re-ceptacle with five electrodes of different shapes.
2.2 Measurement system
The exemplary configuration used in this work consists of a circular cylindrical polycarbonate receptacle open at the bot-tom, with a lid on top and mounted inside a LN2-filled
cryo-stat. This configuration allows the regulation of the fill level by (de-) pressurisation, as is the case in many space systems. Bubbles rising from the liquid volume below the receptacle are trapped by it. These local phase changes from liquid to gas are recognised by measuring the capacitances between different electrodes located on the inner surface of the cylin-der wall and the lid. The basis of the liquid-gas differentia-tion is the fact that the permittivities of liquid and gaseous ni-trogen differ from each other (εr,LN2≈1,43,εr,N2(g)≈1,0)
(Murphy and Morgan, 1937).
The geometry of the cylinder and its electrodes is shown in Fig. 2. The receptacle has an inner diameter of 80 mm and a height of 30 mm. Electrodes 2 and 4 have areas of 900 mm2 and electrodes 1 and 3 have areas of 1800 mm2. The circular ring electrode at the top of the lid has inner and outer di-ameters of 40 and 60 mm, respectively. The closest distance between electrodes 2 and 5 is 10 mm, and that between elec-trodes 1 and 3 is 80 mm. The geometry was chosen so as to evaluate the differences in capacitance due to different elec-trode geometries and their arrangement on the one hand, and to make an optical inspection possible on the other hand. The dashed lines shown in Fig. 2 mark the intersections of verti-cal planes (planes containing the cylinder axis) and the top side of the receptacle lid; field simulations in these planes will later be presented to support certain statements about the characteristics of the measurement system.
The desired capacitances were measured with integrated circuits (ICs) of the type Acam PCap02AD. This IC calcu-lates a capacitance by evaluating the discharge time of the unknown capacitor in series with a known resistor relative
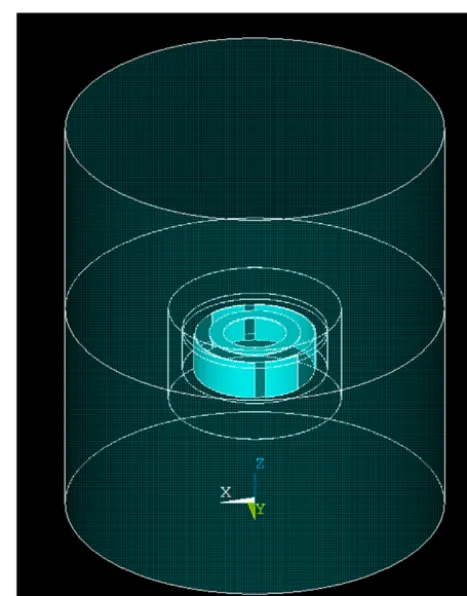
Figure 3.FE geometry of the receptacle and its environment.
to the discharge time of a known capacitor–resistor combi-nation. The IC handles both ground capacitances (one elec-trode active, all other elecelec-trodes of a multi-elecelec-trode system grounded) and mutual capacitances (two electrodes active, all other electrodes grounded) (Acam messelectronic GmbH, 2014; Schlegl et al., 2013). The respective advantages of these two measurement modes in our application have been compared and will be discussed after simulation results for the capacitances have been presented (see end of Sect. 3).
In the experiments conducted, gas bubbles were generated in LN2in a defined way by using the foil heater as described
before. These bubbles could be accumulated under the lid inside the cylindrical receptacle and united to form an ex-panding gaseous phase. By using a camera that observes the cylinder from the side, the fractional gas-phase ratio inside the cylinder could be observed while the capacitances were measured simultaneously.
3 Modelling and simulation of capacitances
Figure 5.Simulated ground capacitances of different electrodes as a function of the LN2fill level.(a)C10(b)C50.
Bubbles rising in the LN2 coalesce inside the receptacle,
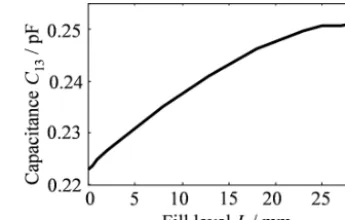
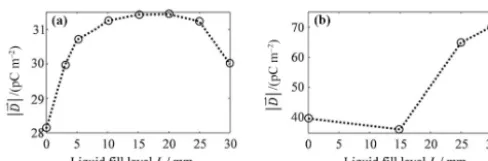
and as a consequence the liquid fill levelLinside the recep-tacle drops. The results of the simulation in Fig. 4 demon-strate how selected mutual capacitances Cij (measured be-tween electrodesiandj) depend onL. The numbering of the electrodes is the same as in Fig. 2.
A look at Fig. 4a reveals that the capacitance C13(L) de-pends quasi-linearly on L at small fill levels (L< 20 mm). At higher fill levels,C13 first peaks atL≈23 mm and then drops again for fill levels between 23 and 30 mm. For rea-sons of sensitivity and uniqueness,C13only lends itself for the measurement of fill levels below 20 mm. In contrast, with
C25(L), the slope and therefore the sensitivity of the
char-acteristic curve is nearly complementary (in other words, the functional graphC13(L) is concave from below whereas
the graph C25(L) is convex from below; Fig. 4b). This
mu-tual capacitance hardly changes with L at small fill levels (L< 20 mm), but is strongly sensitive to L at higher levels (L=20. . .30 mm). This makes sense as electrode 5 is located on the lid, and is therefore more affected by the fill level the higher the level is.
Similar, but not completely identical, remarks apply to ground capacitances such as C10(L) and C50(L) (Fig. 5). Their sensitivities (rates of change) increase withL at high fill levels, especially when the receptacle is nearly full of LN2. The overall change in capacitance from L=0 to L=Lmax=30 mm is higher for ground capacitances than for
mutual capacitances by an order of magnitude (some 0.1 pF vs. some 0.01 pF). Obviously, ground capacitances should be measured to observe phase changes near the electrodes in-volved. And mutual capacitances are needed for electrical capacitance tomography (ECT) to identify phase interfaces in the volume between the electrodes (Mühlbacher-Karrer
deviation of 2 % of the active-electrode potential.
and Zangl, 2015; Wang et al., 2010). The measurement of these mutual capacitances is influenced by non-ideal ground connections. This can be seen if Fig. 4a (C13 with perfectly
grounded electrodes 2, 4, and 5) is compared to Fig. 6 (C13
with electrodes 2, 4, and 5 on a potential that is 2 % of the active-electrode potential). Hence, when interpreting mea-sured capacitances, one must take such common imperfec-tions into account.
4 Electric-field simulation
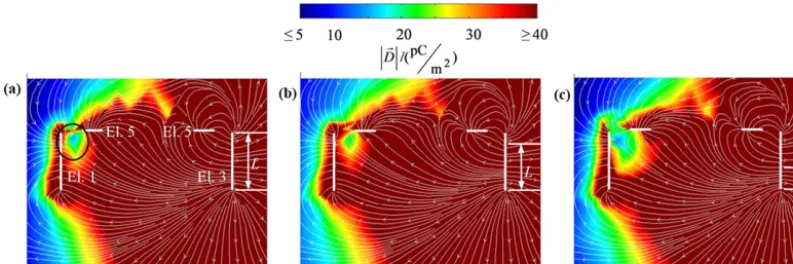
For a better understanding of the simulated capacitances, the electrostatic field in the region close to the electrode-carrying receptacle was investigated by FE calculations. As an exam-ple, this will first be discussed by looking at the potential distribution associated with the measurement of the mutual capacitanceC13(L). The dashed lines in Fig. 2 indicate the lines of intersection between the plane of projection and the two planes, normal to the plane of projection, in which the electric flux densityD(r) has been computed.
Figure 7 shows the magnitude and the field lines ofD(r) for three different LN2 fill levels in plane 1 (which runs
through the centres of electrodes 1 and 3) when electrode 3 is excited. Without gas inside the receptacle (Fig. 7a), the elec-tric field in the region G between electrodes 1 and 5 (marked by a black circle in Fig. 7a) is weaker than near the lower part of electrode 1 (note the colour codes). The field lines start-ing on the active electrode 3 end in part on electrode 1 and in part on electrode 5. With increasing gas volume (correspond-ing to decreas(correspond-ing LN2 level), the flux density in region G
increases (Fig. 7b). Fewer field lines than before end on elec-trode 5, because this elecelec-trode borders on the gaseous phase and the field concentrates in the LN2with its higher
permit-tivity. As the major part of electrode 1 reaches into the LN2,
some field lines that ended on electrode 5 in Fig. 7a now end on electrode 1, and the capacitanceC13 now is greater than
in Fig. 7a. At even larger gas volumes (lower LN2levels), the
Figure 7.Magnitude (colour-coded) and field lines of the electric flux density in plane 1 (see Fig. 2) when electrode 3 is active. The three figures correspond to three different LN2fill levels.(a)L=30 mm (cylinder fully filled with LN2).(b)L=25 mm.(c)L=10 mm. The black circle in(a)marks the region of interest G, in which the electric flux density is further examined, as described in the text.
Figure 8. Simulated magnitude (colour-coded) and field lines of the electric flux density in plane 2 (see Fig. 2) when electrode 5 is active. The two figures correspond to two different LN2fill lev-els.(a)L=30 mm (cylinder fully filled with LN2).(b)L=25 mm. The black circles mark two regions that are further considered for analysis, as described in the text.
electrode has lost its advantage at “catching” the field lines. As a consequence,C13decreases with decreasing fill level.
Another example is shown in Fig. 8. It refers to plane 2 of Fig. 2 (which runs through the small electrodes 2 and 4), and the active electrode is electrode 5. Without gas in the recep-tacle, the electric flux density is highest in the corner regions G (marked by black circles) between the top electrode 5 and the sidewall electrodes 2 and 4 (Fig. 8a). The situation is sim-ilar at lower LN2levels (Fig. 8b), but the field is somewhat
weaker in G. This explains the drop in capacitanceC25: there are just fewer field lines running from electrode 2 through the gaseous phase to electrode 5 than before, when the volume was completely filled with LN2.
Figure 9 is an extension of Fig. 8 to even lower fill lev-els (half-full receptacle in the case of Fig. 9a and completely empty receptacle in the case of Fig. 9b). The maximum flux density is smaller than before (0.5 vs. 1 nC m−2), and the field is more evenly distributed inside the gaseous region than before. Also, the field lines are almost straight inside the gaseous volume and somewhat chaotic outside, which
Figure 9.Simulated magnitude (colour-coded) and field lines of the electric flux density in plane 2 (see Fig. 2) when electrode 5 is active. The two figures correspond to two different LN2fill levels. (a)L=15 mm (cylinder half filled with LN2).(b) L=0 mm (no LN2present in the cylinder).
also shows that the field strength varies little from the top of the receptacle to the bottom and has its highest change at the top. The capacitance only changes very little compared to the changes observed when the gaseous phase begins to emerge. Note that the local density of the field lines in the figures does not represent the local field strength (as it should, but the software used simply selects a few lines regardless of the local field strength).
To visualize the variations in the region of the (left) black circle, the mean value of the magnitude of the electrical flux density in this region is shown in Fig. 10 for changing LN2
fill levels. The results bear some resemblance to Fig. 4, in which the change of capacitance over the fill level is plot-ted. Hence, the capacitance curves can be explained by the change of the flux density in the region near the two elec-trodes making up the measured capacitor.
5 Measurements and results
se-guide the eye.
lected capacitances were measured and the gas–liquid inter-face, as well as the activity of bubbles, was optically ob-served by the camera. The actual fill level was determined by using the pictures from the camera. As the resolution of the camera and the light source in the cryostat did not suffice for precise measurements, the fill level can only be deter-mined with an uncertainty of±2 mm from the video camera images. Figure 11 shows the measured LN2fill levelLas a
function of time for a typical experiment in which the mu-tual capacitancesC13 andC25were measured. The fill level L was calculated by inverting the theoretical characteristic curvesC13(L) andC25(L) from the results of the simulations (Fig. 6a, b). Also, the dashed curve with the associated light “belt” shows the fill level determined from the video camera images with an uncertainty band of±2 mm.
At the beginning of the measurement (t=0 s), the recep-tacle was partially filled with LN2. After a decrease of the
pressure in the cryostat, the existing gaseous phase inside the receptacle expanded until it was eventually completely filled with gaseous nitrogen (L=0) at t≈150 s. After that point, the pressure was increased again, and the gas–liquid phase boundary rose almost linearly with time until the receptacle was completely filled with LN2(L=30 mm) att≈450 s. The
heater was turned on att≈650 s. After that, bubbles rose in the LN2reservoir below the receptacle and replaced LN2in
the receptacle. After the beginning of this replacement pro-cess, the LN2fill level decreased with time. As expected,C13
is sensitive to the beginning of the bubble stream (t≈650 s) as the presence of bubbles leads to a lower effective permit-tivity of the fluid between electrodes 1 and 3. If one neglects this effective-permittivity effect and merely assumes a planar interface between a gaseous phase above a liquid “sea”, one underestimates the LN2 fill level. In contrast to this,C25 is
not influenced by the bubble stream. There is only a small amount of field lines from electrode 5 to electrode 2 running through the bubble stream, as can be seen from the geome-try of the cylinder and the position of the heater underneath. As mentioned before,C13(L) should be used to estimate the
LN2fill levelLin the region from 0 to 20 mm whereasC25(L)
is more suitable forLbetween 15 and 30 mm. As shown by
We would like to draw attention to the fourth photograph of the receptacle from the left in Fig. 11, which is a freeze-frame image of the video att≈650 s. At this instant, the LN2
fill levelL was decreasing owing to the bubble stream. Be-cause of the bubbles, the surface of the liquid is very agitated: it “boils”.
The entire situation can be modelled by a cylinder with the permittivity of LN2(=receptacle full of LN2) in which there
is embedded a slender cylinder of lower permittivity (bubble stream between electrodes 1 and 3). An effective relative per-mittivity ofεr=1.1 was chosen for the bubble stream region,
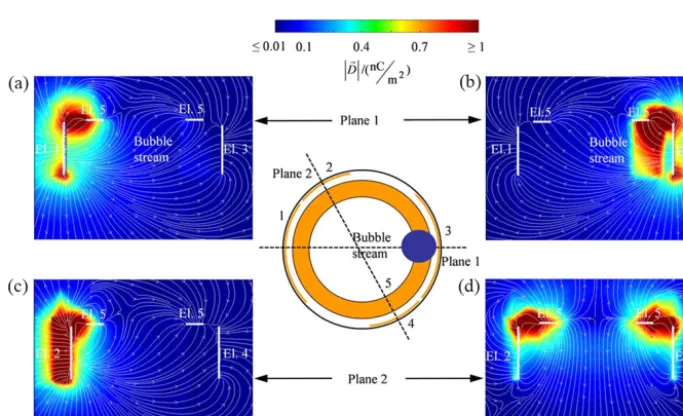
to represent a high bubble content. The bubble-stream region in the simulation was chosen such that it coincided with the bubble-stream region visible in the camera-recorded video. The simulation results are summarized in Fig. 12, where the numbering of the electrodes and the notation for the cross-sectional planes is the same as in Fig. 2. It is obvious that, for example, the mutual capacitanceC13and the ground capac-itanceC30will respond to the presence of the bubble stream as the associated field lines “probe” (run through) the bubble-stream region (Fig. 12a, b). In contrast, capacitanceC25will be hardly affected by the presence of the bubble stream as the associated field lines do not run through the bubble-stream region (Fig. 12c, d). Hence, not only can the fill level in a defined volume be detected, but so too can a change in per-mittivity (like a bubble stream or bubbles) inside a confined volume.
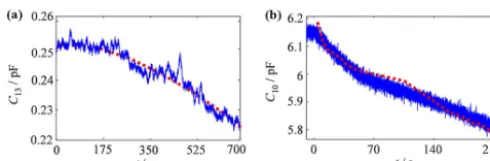
As a further corroboration of the calculation and measure-ment results, the gas volume increase due to a depressuriza-tion of the cryostat was observed. The change of the fill level from full to empty was nearly linear with time, so that the simulated capacitance curves from Fig. 6 can be superim-posed on the measured capacitance curves. For the mutual capacitances as well as for the grounded capacitances, the simulation results and the experimental findings agree very well (Fig. 13). The following conclusions can be drawn from these results:
– The measurement results can be correctly interpreted in a quantitative as well as in a qualitative way by using numerical simulations (of capacitances).
Figure 11.LN2fill level inside the receptacle measured via electrode pair 1–3 (red curve) and via electrode pair 2–5 (black curve) compared to the visually determined fill level (video camera images; dashed line with an uncertainty band of±2 mm). The photographs at the bottom are freeze-frame images from the video camera and serve to visualize selected situations.
Figure 12.Simulated magnitude (colour-coded) and field lines of the electric flux density in the presence of a bubble stream at the position indicated in the center sketch. (a, b)Field in plane 1 with excitation of(a)electrode 1 and(b)electrode 3.(c, d)Field in plane 2 with excitation of(c)electrode 2 and(d)electrode 5.
data. This can be done by using a model-based ap-proach.
– The measured capacitances are noisy. The amount of noise depends on both the capacitance and the permit-tivity distribution (LN2fill level). In general, the curves
have to be smoothed. In the case of Fig. 13a, a moving
crease of the LN2 level). (a)Mutual capacitanceC13. The same ground-potential error as in Fig. 6 has been assumed in the simu-lation. Smoothing of the measured curve as described in the text. (b)Ground capacitanceC10.
– The measured capacitances contain an additive offset that is characteristic for every combination of elec-trodes. The offset is due to cable capacitances and has to be subtracted from the raw data.
– Our specific hardware implementation could handle ca-pacitance changes of some femtofarads without prob-lems.
– The system can distinguish between a change in fill level and bubbles or another source of change in permit-tivity occurring inside a confined volume by using the information supplied by multi-electrode arrangements.
6 Conclusions
It has been demonstrated that phase changes in LN2can be
recognized in situ by measuring the electrical capacitance be-tween different electrodes of a multi-electrode system. The method is minimally invasive as it does not introduce heat into the LN2or otherwise disturb the fluid.
This may be generalized to infer that, depending on the geometry of the electrodes, phase changes of fluids with comparatively low changes in relative permittivity can be detected using measured mutual and ground capacitances. The properties of the system can be well described by using dedicated finite-element simulations. Both the agreement be-tween simulation and electrical measurements and the agree-ment between simulation and optical (camera-based) mea-surements are very good.
Data availability. Original data of the publication: doi:10.15495/M-10150282-0001 (Kandlbinder et al., 2017). The data was used to produce Figs. 1, 4, 5, 6, 7, 8, 9, 10, 11, 12, and 13.
References
Acam messelectronic GmbH: Data Sheet “PCap02A – Single-chip Solution for Capacitance Measurement”, Vol. 1, vers. 1.6, 29 May 2014.
Carapelle, A. and Colette, J.: Gamma-ray attenuation for measuring cryogenic slush mixture density, Nucl. Instr. Meth. Phys. Res. B, 229, 111–116, 2005.
De Kerpel, K., Ameel, B., T’Joen, C., Canière, H., and De Paepe, M.: Flow regime based calibration of a capacitive void fraction sensor for small diameter tubes, Int. J. Refrig., 36, 390–401, 2013.
Filippov, Y., Kakorin, I., and Kovrizhnykh, A.: New solutions to produce a cryogenic void fraction sensor of round cross-section and its applications, Cryogenics, 57, 55–62, 2013.
Hennes, J. and Barnard, L.: The Effects of Cryogenic Fuels on Ca-pacitance Type Mass and Level Measurement, SAE Technical Paper 640222, Air Transport and Space Meeting, New York, 27– 30 April, 10 pp., 1964.
Jiang, Y. and Zhang, P.: Density determination of slush nitrogen by the improved capacitance-type densimeter, Exp. Therm. Fluid. Sci., 35, 328–337, 2011.
Kandlbinder, C., Fischerauer, A., Mösch, M., Helling, T., Fischer-auer, G., and Siegl, M.: Original data of the publication: Ca-pacitive gas-phase detection in liquid nitrogen, University of Bayreuth (Centre of Energy Technology – ZET), 2017. Kügler, K.-J., Lindenberg, W., and Niehues, N.:
Non-power-dissipating continuous level monitors for liquid nitrogen and he-lium, Cryogenics, 24, 63–66, 1984.
Matsumoto, K., Sobue, M., Asamoto, K., Nishimura, Y., Abe, S., and Numazawa, T.: Capacitive level meter for liquid hydrogen, Cryogenics, 51, 114–115, 2011.
Medeova, M., Pavlik, V., and Skyba, P.: Simple continuous level meter for cryogenic liquids, Cryogenics, 38, 289–291, 1998. Mühlbacher-Karrer, S. and Zangl, H.: Light Weight Signal
Process-ing for a Wireless Capacitive SensProcess-ing Platform for Mobile Ap-plications, Proc. Sensor 2015, Nuremberg, Germany, 190–197, 2015.
Mukhopadhyay, M.: Fundamentals of cryogenic engineering, PHI Learning Pvt. Ltd., New Delhi, India, 2010.
Murphy, E. J. and Morgan, S. O.: The Dielectric Properties of Insu-lating Materials, Bell Systems Technical Journal, 14, 493–512, 1937.
cherauer, A., Kandlbinder, C., and Fischerauer, G.: Advanced Sensor technologies for cryogenic liquid propellant flow phe-nomena, Proc. 66th International Astronautical Congress (IAC), Jerusalem, 7 pp., 12–16 October, 2015.
VCH, Weinheim, Germany, 2016.