ORIGINAL ARTICLE DOI 10.1007/s10086-006-0818-z
T.-H. Yang · S.-Y. Wang · M.-J. Tsai · F.-C. Lin (*) School of Forest Resource and Conservation, College of Bio-Resource and Agriculture, National Taiwan University, Taipei 106, Taiwan, ROC
Tel. +886-23-366-3848; Fax +886-22-365-4520 e-mail: [email protected]
C.-J. Lin
Taiwan Forest Research Institute, Taipei, Taiwan, ROC Te-Hsin Yang · Song-Yung Wang · Cheng-Jung Lin Ming-Jer Tsai · Far-Ching Lin
Effect of laminate configuration on the modulus of elasticity of glulam
evaluated using a strain gauge method
Received: October 3, 2005 / Accepted: May 22, 2006 / Published online: October 26, 2006
Abstract The purpose of this study was to measure
the strain of glulam laminae by affixing a strain gauge at the central axis of the lateral face in order to determine the effect of the configuration of the glulam. Japanese cedar and southern pine were used in the study. The strain and stress of the laminae during the bending test were recorded, and the modulus of elasticity (MOE) was calculated. The influence of the MOE of the adhesive layers was also con-sidered. Results showed that the MOE of the laminated elements increased as its specific gravity increased, although the specific gravity was not the only factor evaluated. The
MOE of glulam (Ebsg) measured by the strain gauge method
was very close to the observed MOE of glulam (Eb) and a
significant linear relationship was identified. The MOE (e) of laminae measured by the strain gauge method was very close to that determined (E) under the “free condition” before bonding. The difference between the modified MOE
(Ebsa) and Ebsg was not significant. The MOE of glulams
made of heterogeneously graded lumbers were about 23% and 31% larger than the average MOE of their laminae for Japanese cedar and southern pine, respectively. The actual neutral axis was just below the longitudinal center line. It shifted slightly within the proportional limit range and moved downward when the load increased.
Key words Glulam · Configuration · Strain gauge ·
Lamination
Introduction
A glulam is made up of wood laminae, which are bonded together with adhesive. Its members are composed of indi-vidual pieces of dimension lumber that are end-jointed, in which the grain of all laminations runs parallel with the length of the member. Glulam is used widely in Europe and North America because it is an engineered wood product and is manufactured to meet a range of design stresses and large span.
The laminae of glulam can be evaluated by nondes-tructive methods before they are used in glulam manufac-ture.1–5
After accurate design of the configuration, glulam can meet various structural requirements. In previous re-ports,6,7
relationships of the lamina properties with visual grading, ultrasonic wave velocity, and transverse vibration were studied. Then the configuration of the glulam was designed based on the modulus of elasticity (MOE) of each lamination.
The properties of laminae are the important key factor of glulam. The configurations, selection, and strength of the laminations were studied in an earliuer report of glulam
design. Hernandez and Moody8
designed the configurations of glulam made of southern pine with a modulus of rupture (MOR) of 20.58 MPa and MOE of 13720 MPa. They indi-cated that the glulam could be configured with the outer 10% of laminations being E-rated to have an MOE of 15778 MPa, and the adjacent 15% of laminations being No.1D lumber with an average MOE of 13720 MPa. Similar results were also found in the study of hardwood. Manbeck et al.9
and Janowiak et al.10
designed the configuration of glulam made from red maple with MOR of 16.46 MPa and
MOE of 12348 MPa. Moody et al.11 also designed a glulam made from yellow poplar with the same strength properties.
On the other hand, Falk12
the service load is expected to create the highest stress. Conversely, lower-grade laminations are positioned in the areas or zones where the stress is expected to be lower. This use of multiple species and several different grades within a single glulam is distinctly different from glulam design in Europe, where glulam design is limited to a single grade (homogeneous layup) or two grades (combined layup). The relationship of MOR and MOE is linear in European glulam while it is nonlinear in American glulam. Falk and Colling13
also indicated that in the glulams in North America constructed with special tension laminations, the gradient of stiffness is sharper than that in the more homog-enous combinations of European glulams. This results in lower glulam bending strengths at higher lamination ten-sion strength levels and implies that European glulams pos-sess a more efficient structural balance between lamination tensile strength and glulam bending strength.
Lee et al.14
configured ten different types of glulam with three different grades of laminations which followed the criteria of ASTM D3737. In these glulams, three types were homogenous while the other seven were heterogeneous. Results shows that the MOR and MOE of glulams occurred
in the order of grade 1 > grade 2 > grade 3 in the
homoge-neous group. In the heterogehomoge-neous group, the highest strength glulam was configured with the highest grade as the outer lamination.
Although the target strength and differences between homogeneous and heterogeneous grades of glulam can be obtained through the configuration of laminations, the properties of interest are macromechanical properties and performance of the glulam rather than the laminations. The extent of research regarding the micromechanical proper-ties of laminae including the stress–strain relationship in both homogeneous and heterogeneous grades of glulams is limited. In addition, the distribution of longitudinal stress within the laminae must also be confirmed in order to deter-mine the neutral axis of the glulam. Hence, the purpose of this study was to measure the strain of the laminae by affixing a strain gauge at the central axis of the edge face. The strain and stress of laminae during bending were re-corded, and the modulus of elasticity was calculated. The results were used to determine the effect of laminate con-figuration on the MOE of glulam.
Materials and methods
Test materials
Two kinds of materials were used in the study: Japanese cedar (Cryptomeria japonica) and the southern pine (Pinus
spp.). The lumber dimensions were 38 × 89 mm in cross
section and 3600 mm in length. The average air-dried densi-ties of Japanese cedar and southern pine lumbers were
502 and 622 kg/m3
, respectively. A total of 144 pieces of Japanese cedar and 144 pieces of southern pine lumber were used, and each glulam was made of six elements. The average moisture content of the laminae was 14%.
Test of laminae
All lumber was subjected to the four-point bending
test, and the modulus of elasticity (E1–E6) was calculated
from the lumber deflection and relative proportional limit loading.
Configuration and manufacture of glulam
High-MOE laminae were assigned to the top and bottom positions in order to manufacture a glulam with better
me-chanical properties.15
Hence, the study distinguished differ-ences in glulam made with homogeneously graded lumber and heterogeneously graded lumber. Resorcinal resin
adhe-sive (RF) was applied with a spreading rate of 0.323 kg/m2
at a pressure of 0.98 MPa when the glulam was manufactured by the radio frequency method.
The allocation of each lamina was based on its bending stiffness.16
Considering the effect of the adhesive layer, as shown in Fig. 1, the bending stiffness of the glulam was the summation of all bending stiffness values of the adhesive
layers and laminae.17,18
E Ib =
∑
(
e Ij j+e Irj rj)
(1)where Eb is the MOE of glulam, I is the moment of inertia
of the glulam, ej and Ij are the MOE and moment of inertia
of the j-th layer of the laminae, respectively, and erj and Irj
are the MOE and moment of inertia of the j-th adhesive layer, respectively.
The glulam was made of six pieces of lumber in the study
and considering the existence of the adhesive layers, Eb
could be expressed as follows:
E e e e t
t e e
t
t t e e e
t t
t e e e t
t
r r
r r
b= −
(
−)
−(
−)
+(
− −)
+
(
− −)
3 3 2
2 3
3
3 2 1
1 3
3
3 3 2
2 3 3 3 2 1 1 3 3 3 3 2
3 2 (2)
The above formula was used to allocate the laminae of glulam in this study. All pieces of Japanese cedar lumber
L/2 t3 t2 t1
E1 E1 E2 E3 E2 E3 e3 e2 e1 e2 e1
e3 Strain gauge
tr er
tr er
tr er
tr er
tr er
g2(c) g3(c) g1(c) g2(t) g1(t) g3(t)
were graded into four groups (see Fig. 2): the
hetero-geneously graded combined group GJI (MOE at E3 was
13.7 GPa, MOE at E1 and E2 were both 9.3 GPa), and the
homogeneously graded combined groups of GJ3H (MOE 11.8 GPa), GJ2H (MOE 10.8 GPa), and GJ1H (MOE 9.3 GPa). Similarly, the pieces of southern pine lumber were also graded into four groups (Fig. 2): the heterogeneously
graded combined group GSI (MOE at E3 of 19.6 GPa,
MOE at E1 and E2 positions were both 11.8 GPa), and the
homogeneously graded combined groups of GS3H (MOE 17.6 GPa), GS2H (MOE 14.7 GPa), and GS1H (MOE 11.8 GPa).
Bending test and measurement of stress and strain
Static bending test
The bending test was carried out using the four-point loading method. The loading speed did not exceed 14.7 MPa/min. The MOE and MOR can be expressed as follows:
MOE PL
bh
= 23
108
3
3 D
d (3)
and
MOR PL
bh
= 2 (4)
where DP is the difference between the upper and lower
loading limits in the proportional limit region, d is the
deflection with respect to DP (mm), L is span (mm), b is the
width of the glulam (mm), h is the thickness of the glulam (mm), and P is the maximum loading (N).
Measurement of modulus of rigidity
The modulus of rigidity, G, of glulam was measured by the vibration test method. G was calculated from the following:
G f l
n
I K
T n
= × ×
× ×
− 2
2 r
t
where fT-n is the resonance frequency (Hz), n represents the
resonance mode, l is the length of the specimen (m), r is the
density of the specimen (kg/m3
), and I is the moment of
the inertia of the specimen (m4
). Kt is the torsional constant
(m4
), which is expressed as follows:
Kt=bh 3x
where b is the width of the specimen (m), h is the thickness
of the specimen (m), and x is calculated as follows:
x
p
p
= −
+
(
)
(
+)
= ∞
∑
13 1
192 1
2 1
2 1 2
5 5
0 h
b n
n b
h
n
tanh
Measurement of stress and strain
In order to study changes in the MOE of the laminae, a strain gauge (FLA-5-11, Tokyo Sokki Kenkyujo) was af-fixed to the lateral sides of the laminae (Fig. 1). The length
of the gauge was 5 mm, the resistance was about 120 ± 0.3Ω,
and the gauge factor was 2.12% ± 1%.
The measurement principle was based on the balance of a Wheatstone bridge circuit. Owing to changes in the wire length of the strain gauge, the resistance also changed. The signal was input to an eight-channel amplifier and stored in a digital data logger.
Before the strain gauge was affixed to the lumber, the surface was sanded in order to apply epoxy glue. A pair of 1-m-long wires was soldered to the wire terminal after the strain gauge was affixed. The strain and loading were re-corded from the compression side, the center axis, to the tension position, respectively. The data from the loading cell and strain gauge were stored in a data logger, the strain–stress relation was plotted, and MOE values of the laminae were calculated. The stresses of the laminae were
calculated from Eq. 5, and the values of e1, e2, and e3 were
calculated from Eq. 6:
s=
( )
∑
MEyE Ii i (5)e=s
e (6)
where M is the bending moment, E is the modulus of elas-ticity of the laminae, y is the offset distance of the laminae
from the neutral axis, I is the moment of inertia, and e is the
strain of the laminae.
In this study, “free condition” indicated that the laminae were not bonded together, while “constrained condition”
Heterogeneous group homogeneous group homogeneous group homogeneous group
(a) (b) (c) (d)
For Japanese cedar glulam: For Southern pine glulam: GJI group GJ3H group GJ2H group GJ1H group
GSI group GS3H group GS2H group GS1H group
13.7 GPa
11.8 GPa
10.8 GPa
9.3GPa
19.6 GPa
17.6 GPa
14.7 GPa
11.8GPa
indicated that laminae were bonded. Hence, comparison of e1, e2, and e3 (constrained condition) with E1, E2, and
E3 (free condition) can describe the bonding effect of the
glulam.
Relationship between the predicted and observed MOE
The predicted MOE (Eb) was calculated by substituting the
MOE of the laminae calculated from the strain gauge, the MOE of the RF adhesive (er) of 17.0 GPa, and thickness (tr)
of 0.218 mm, into Eq. 2.16
The observed MOE was calcu-lated from Eq. 3.
Position change of the neutral axis during bending test
To study the displacement of the neutral axis, the position of the strain gauge was assigned to the y-axis, and the value of the strain gauge was assigned to the x-axis. Because the longitudinal stress is zero at the neutral axis, the stress on the compressive side is negative while it is positive on the tensile side. The relationship of strain with its position can be expressed as a linear regressive formula of the form
y = a + bx. When x is set to zero, the value of y is the position of the neutral axis.
Results and discussion
Bending properties of laminae
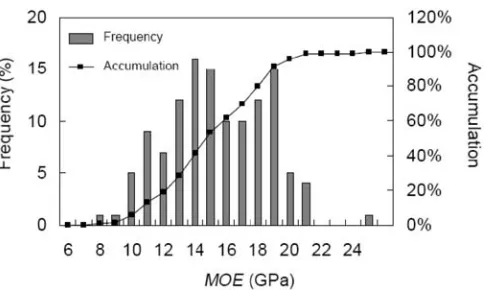
The MOE of the Japanese cedar laminae ranged from 8.0 to 16.4 GPa and the average was 10.5 GPa. Most were within 7.0–13.0 GPa which were 87.9% of total Japanese cedar specimens as shown in Fig. 3. On the other, the MOE of the laminae of southern pine ranged from 9.2 to 20.9 GPa and the average was 14.9 GPa. Most were within 11.0–19.0 GPa which were 86.2% of total southern pine specimens as shown in Fig. 4.
Generally, studies on the relationship between wood density and modulus of elasticity are based on small
clear wood. Markwart and Wilson19
induced the relation-ship and indicated that the density is the important factor affecting wood strength. In the study, although MOE increased with an increase in density and the statistical
result was significant, the determination coefficient, R2 =
0.28−0.31, was not high (Fig. 5). The value was very close to
R2 =
0.314 to 0.624 that Wang and Lin6
and Wang and Ko7
reported in their studies of the relationship between
MOE and MOR for Japanese cedar. Similarly, Doyle and
Markwart20
also found that both the MOR and MOE in-creased with an increase in the wood density in an investiga-tion of lumber of six different grades and four different
dimensions; however, the R2
values were only 0.244 and 0.377, respectively. Therefore, the effect of wood density on the strength of lumber was not as significant as it was on small clear wood pieces.
Burdzik and Nkwera4
also conducted similar research on
Eucalyptus grandis. Their results indicated that wood
den-sity cannot accurately predict the MOE and MOR because wood density is not the only or even an excellent factor for predicting the mechanical properties of wood.
Fig. 3. Frequency of MOE of laminae made of Japanese cedar
Fig. 4. Frequency of MOE of laminae made of southern pine
MOE = 0.020×r - 0.471, R2 = 0.28** MOE = 0.027×r - 2.043, R2 = 0.31**
0 5 10 15 20 25 30
200 400 600 800 1000
r (kg/m3)
MOE
(G
Pa
)
MOE of glulam
Ebf represents the MOE of the glulam under a free
condi-tion, obtained by substituting the values of E1–E3 into Eq. 2.
Ebsg represents the MOE of the glulam determined by
sub-stituting e1–e3 from the strain gauge method into the same
formula. Both results are shown in Table 1.
In the bending test, the results showed (Table 1) that the
MOE of the four groups occurred in the order of GJI >
GJ3H > GJ2H > GJ1H for Japanese cedar. Similar results
were obtained for the southern pine lumbers.
Analysis of variance (ANOVA) showed no significant difference between the heterogeneously graded combina-tion GJI group and the homogeneously graded combinacombina-tion GJ3H for Japanese cedar. The same was found for the heterogeneously graded combination GSI group and the homogeneously graded combination GS3H for southern pine. In other words, the heterogeneously graded combina-tion glulam improved the performance of the laminae over those of the homogeneously graded combination ones.
For prediction of the MOE of glulam made from
Japan-ese cedar, results showed that the predicted MOE (Ebf) of
glulam was about 0.2%–5.7% larger than the observed MOE
(Eb), and there was a linear relationship between them with
R2=
0.82 (Table 2). However, the observed MOE (Eb) of
glulam made from southern pine was about 0.5%–11.4%
larger than the predicted MOE (Ebf), and there was also a
linear relationship between them with R2=
0.96 (Table 2). The modulus of rigidity, G, of glulum ranged from 0.76 to 0.88 GPa for Japanese cedar glulam, and from 0.87 to 1.05 GPa for southern pine glulam. The value of G increased with increased glulam grading. The E/G ratio was calculated
from Eb and G of the first resonance mode; therefore, the E/
G ratios of Japanese cedar and southern pine were within
the ranges of 13.23–14.47 and 16.03–19.09, respectively.
Bodig and Jayne21
indicated that the E/G ratio of wood
ranged from 14 to 20, while Ohlsson and Perstorper22
found that the E/G ratio of clear Norway spruce is 10.7. Isoda et al.23
found that the E/G ratio ranged from 14.1 to 56 and the average was 28.3 in research of glulam bending and fracture. Owing to the bending beam being subjected to the mo-ment and vertical shear force, the actual deflection included a component due to shear. In other words, the shear deflec-tion should be considered in research, although its effect is
trivial. Bodig and Jayne21
also indicated that the pure MOE obtained by ignoring shear deflection can be described by the following expression:
MOE E
L h L
h C
p
=
( )
( )
+ 22
Table 1. The values of modulus of elasticity (MOE) of glulam
Glulam Ebf Eb Ebsg Ebsa G E/G Ep s MOR
(Gpa) (Gpa) (Gpa) (Gpa) (Gpa) (Gpa) (Mpa) (Mpa)
Japanese cedar
GJI 12.9a 12.7a 12.3 12.2 0.88 14.47 13.4a 54.2 61.9a
GJ3H 12.7a 12.2a 12.4 12.3 0.88 13.89 12.9a 49.3 61.1a
GJ2H 11.0b 10.6b 10.2 10.1 0.79 13.38 11.2b 42.9 53.2b
GJ1H 9.9b 10.0b 9.9 9.9 0.76 13.23 10.6b 38.4 48.3b
Southern pine
GSI 18.6a 19.6a 20.9 21.0 1.05 18.72 20.6a 68.0 78.4a
GS3H 18.2a 18.8a 19.6 19.6 0.98 19.09 19.8a 60.4 73.6a
GS2H 14.9b 16.1b 13.7 13.6 0.88 18.16 16.9b 59.4 73.1a
GS1H 12.5c 13.9c 13.5 13.5 0.87 16.03 14.6c 61.1 74.7a
Ebf, predicted MOE of glulam under a free condition; Eb, observed MOE of glulam; Ebsg, MOE of glulam calculated from the strain gauge method; Ebsa, MOE of glulam after the neutral axis was modified; Ep, pure MOE; MOR, modulus of rupture
Data followed by different lowercase letters are significantly different for each species (P < 0.05) by ANOVA
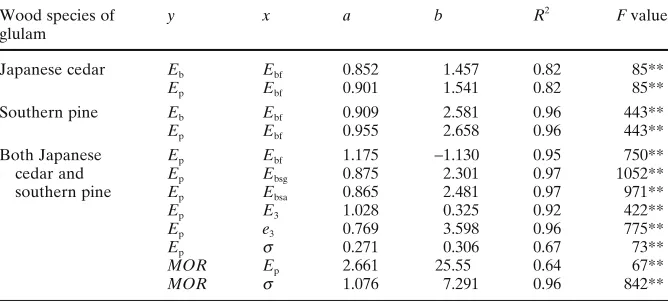
Table 2. The correlations among Eb, Ep, Ebf, Ebsg, Ebsa, E3, e3, MOR, and s values analyzed by the linear regression formula (y = ax + b) for Japanese cedar and southern pine glulam
Wood species of y x a b R2 F value
glulam
Japanese cedar Eb Ebf 0.852 1.457 0.82 85**
Ep Ebf 0.901 1.541 0.82 85**
Southern pine Eb Ebf 0.909 2.581 0.96 443**
Ep Ebf 0.955 2.658 0.96 443**
Both Japanese Ep Ebf 1.175 −1.130 0.95 750**
cedar and Ep Ebsg 0.875 2.301 0.97 1052**
southern pine Ep Ebsa 0.865 2.481 0.97 971**
Ep E3 1.028 0.325 0.92 422**
Ep e3 0.769 3.598 0.96 775**
Ep s 0.271 0.306 0.67 73**
MOR Ep 2.661 25.55 0.64 67**
where MOE is observed, and Ep is the pure MOE, L/h is the
ratio of span to thickness, and C is equal to 15.05 when the beam is subjected to four-point bending.
Theoretically, the pure MOE is larger than the observed
Eb; hence, the average Eb/Ep ratios of Japanese cedar and
southern pine are 0.946 and 0.952, respectively. Isoda et al.23
also indicated the Eb/Ep ratio is 0.98. The Ep of Japanese
cedar is about 1.3%–7.2% greater than Ebf, while Ep of
southern pine is about 8.4%–17.1% greater than Ebf.
Apparently, the MOR of laminae of Japanese cedar was less than that of southern pine. Hence, the overall MOR of the glulam made from Japanese cedar remained inferior to that of the glulam prepared from Southern pine. Consider-ing only the grade of the laminae and the properties of the glulam, the MOE of the homogeneously graded combina-tion glulam was very close to those of their laminae of Japanese cedar and southern pine. The MOE values of the heterogeneously graded combination glulam were 23% and 31% larger than the average MOE of their laminae for Japanese cedar and southern pine, respectively.
The MOR results for both Japanese cedar and southern pine are given in Table 1. After ANOVA analysis, the statistical results showed that there was no significant differ-ence between the heterogeneously graded combination group of GJI and the homogeneously graded combination group of GJ3H for Japanese cedar. No difference was found among any of the graded groups for southern pine. The overall MOR values of southern pine glulams were higher than those of Japanese cedar.
Furthermore, the regression analysis showed that there was a positive linear relationship between MOR and MOE
with R2=
0.64. A positive linear relationship was also found
between MOR and the ultimate bending stress (s) with R2=
0.96. The ultimate bending stress (s) also had a linear
rela-tionship with Ep of glulam with R
2=
0.67. Hence, s could
still predict the Ep of glulam.
Stress analysis of the glulam
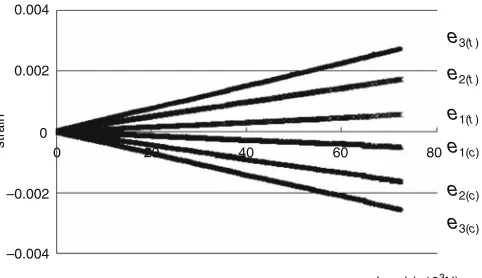
In the bending test, the load–strain diagrams of the glulams are shown as Figs. 6 and 7. In comparison of the strain of the
outermost laminae of all the glulams at the same loading, less strain was found to occur for higher grades of the exter-nal lamina. That is, the strain of the exterexter-nal lamina in-creased as its grade dein-creased.
On the other hand, the stress of the laminae of the glulam can be calculated from Eq. 5. According to Hook’s
0.004
0.002
–0.002
strain
–0.004 0
0 20 40 60 80
Load (¥103N)
e1(c)
e2(c)
e3(c)
e1(t)
e2(t)
e3(t)
Fig. 6. Load-strain diagram of GJI glulam. e1(c)–e3(c) shows the MOE of laminae on the compression side; e1(t)–e3(t) shows the MOE of laminae on the tension side
0.004
0.002
–0.002
strain
–0.004 0
0 20 40 60 80
Load (¥103N)
e1(c)
e2(c)
e3(c)
e1(t)
e2(t)
e3(t)
Fig. 7. Load–strain diagram of GSI glulam Table 3. The differences of lamina MOEs between the free condition and constrained condition
Type of glulam Position of the Homogeneously graded Heterogeneously graded
lamina combination combination
E/Ebf e/Ep E/Ebf e/Ep
Japanese cedar E1 0.91 (0.8) 0.73 (12.7) 0.63 (2.0) 0.57 (10.6)
E2 0.94 (0.6) 0.89 (11.3) 0.66 (2.0) 0.61 (9.9)
E3 1.00 (0.3) 0.97 (5.8) 1.12 (0.6) 0.99 (5.4)
Southern pine E1 0.93 (0.7) 0.91 (6.8) 0.65 (8.5) 0.68 (9.5)
E2 0.98 (0.3) 0.92 (9.2) 0.86 (0.5) 0.88 (11.8)
E3 1.02 (0.1) 1.00 (2.1) 1.07 (0.3) 1.09 (4.8)
Values in parentheses are coefficients of variation (%)
law, the modulus of elasticity (e) of the laminae can easily be calculated from the stress divided by the strain. When an individual MOE of a lamina is acquired and substituted into
Eq. 2, the Ebsg, (MOE of the glulam measured by the strain
gauge method) was calculated as shown in Table 1. The
average Eb was about 0.6%–3.6% larger than the Ebsg for
Japanese cedar; however, the average Eb was about 0.5%–
6.9% less than the Ebsg for southern pine. In other words,
the values of Eb and Ebsg were very similar.
Comparing pure MOE (Ep) with MOE calculated from
the strain gauge method, the Ep of Japanese cedar glulam
was about 4.0%–9.6% greater than its Ebsg. The observed
MOE before modification of southern pine was less than
Ebsg; however, the Ep was 0.9%–23.5% greater than Ebsg
except for the GSI group. The Ep of the GSI group was still
about 1.2% less than Ebsg.
In the analysis of the linear relationships of Ep with Ebf,
Ebsg, and Ebsa, the regression lines are shown in Fig. 8. Ep
increased with increases in Ebf, Ebsg, and Ebsa, and their R
2
values were 0.95, 0.97, and 0.96, respectively.
Considering the MOE of laminae in the free condition and the constrained condition, the e value measured by the strain gauge method was very close to the E value under a free condition. Previous results showed that the E value was greater than the e value for Japanese cedar; however, the e value was greater than the E values for southern pine. Dif-ferences in the MOE values between the free condition and the constrained condition of the laminae at the same level of observed MOE for the heterogeneously graded and ho-mogeneously graded combination glulams are listed in Table 3.
Because the outermost laminae of glulam had the great-est effect on the overall properties, the relationships of the
E and e values with Ep of the glulam were analyzed by linear
regression and the R2 were 0.92 and 0.96, respectively (Fig.
9). Hence, the properties of the glulam can accurately be predicted by the outermost laminae. Moreover, the e value
5.0 10.0 15.0 20.0 25.0
5.0 10.0 15.0 20.0 25.0
Ebf, Ebsg, Ebsa (GPa)
Ep (GPa) Ep = 1.175Ebf 1.130, R
2=0.95, F=750**
Ep = 0.875Ebsg+ –
2.301, R2=0.97, F=1052** Ep = 0.865Ebsg+ 2.481, R2=0.97, F=971**
Fig. 8. Relationships of Ep with Ebf, Ebsg, and Ebsa. Circles, Ebf; filled triangles, Ebsg; open triangles, Ebsa
5.0 10.0 15.0 20.0 25.0
5.0 10.0 15.0 20.0 25.0
E3, e3 (GPa)
Ep (GPa) E
p = 1.028E3+ 0.325, R2=0.92, F=422**
Ep = 0.769e3+ 3.59, 8, R2=0.96, F=775**
Fig. 9. Relationship of Eb of the glulam with E3 and e3 of the outermost lamina. Open squares, E3; filled squares, e3
Tension side
↑
↓
compression side
0.4 0.5 0.6 0.7
0.0 20.0 40.0 60.0 80.0 100.0
Load (×103N) x/h
GJ1H GJ2H GJ3H GJI
Fig. 10. Shift in the neutral axis in the glulam of Japanese cedar
Tension side
↑
↓
compression
side
0.4 0.5 0.6
0.0 20.0 40.0 60.0 80.0 100.0
Load (×103N) x/h
GS1H GS2H GS3H GSI
can predict the overall MOE more precisely due to its origin from the stress analysis.
Shift in the neutral axis of the glulam
The position of the neutral axis was determined by the strain gauge method. The position of the neutral axis is expressed as x/h, where x is the distance between the axis and the top lamina edge of the glulam, and h is the thickness of the glulam. The value of x/h ranges from 0 to 1 and equals to 0.5 if the beam is homogeneous. However, in such cases,
x/h is a little larger than 0.5 because wood is not a
homoge-neous material. That is, the actual neutral axis is below the central axis. Furthermore, the accuracy of the strain gauge also affects x/h. A shift in the neutral axis is slight within the proportional limit range. However, the tensile strength of wood is significant larger than the compressive strength, and the tensile deflection is smaller than the compressive deflection. The neutral axis shifts downward when the loading increases during the bending test and becomes significant in the plastic region (Figs. 10, 11). Kollmann and
Cote24
also indicated that the position of the neutral axis varies with the laminae properties of the glulam. Owing to the differences between the compression part and tensile part of the gluam, the tensile stress is larger than the com-pressive stress; hence, the neutral axis shifts downward.
The relationship of strain with its position can be
ex-pressed as a linear regression in the form of y = a + bx. When
x is set to zero, the y value is the position of the neutral axis.
After the actual neutral axis is acquired, the modified MOE
(Ebsa) of the glulam can be calculated. We compared Ebsg
measured with the strain gauge with Ebsa and found no
significant difference. Similarly, there was no significant
dif-ference between Ebsa and Ep. The average Ep was 4.1%–
11.3% larger than Ebsa for Japanese cedar; however, the
average Ep was 0.9%–24.5% larger than Ebsa for southern
pine except for the GSI group, for which the Ep values were
1.5% less than Ebsa.
Conclusions
The modulus of elasticity of the laminated element increases as its density increases; however, the wood density is not the
only evaluated factor. The MOE of glulam (Ebsg) measured
by the strain gauge method was very close to the observed
MOE of glulam (Eb) with a significant linear relationship.
The MOE (e) of the laminae measured by the strain gauge method was very close to that (E) under the “free condition” before bonding. The difference between the modified MOE
(Ebsa) and Ebsg was not significant. The MOE of glulams made
of heterogeneously graded lumbers were about 23% and 31% larger than the average MOE of their laminae for Japanese cedar and southern pine, respectively.
The actual neutral axis was just below the longitudinal central line. It shifted slightly within the proportional limit range and moved significantly downward when the load exceeded the limit.
Acknowledgments The authors thank the National Science Council of ROC for financial support under NSC91-2313-B-002-396, and Prof. Min-Chyuan Yeh, Department of Wood Industry, National Pingtung University of Science and Technology, for valuable suggestions and help.
References
1. Peterson J, Madson G, Moody RC (1981) Tensile strength of one-, two-, and three-ply glulam members of 2 by 6 Douglas-fir. Forest Prod J 31:42–48
2. Ross RJ, Pellerin RF (1994) Nondestructive testing for assessing wood members in structure: a review. FPL-GTR-70. USDA Forest Service, Forest Products Laboratory, Madison, WI
3. Erikson RG, Gorman TM, Green DW, Graham D (2000) Me-chanical grading of lumber sawn from small-diameter lodgepole pine, ponderosa pine, and grand fir trees from northern Idaho. Forest Prod J 50:59–65
4. Burdzik WMG, Nkwera PD (2002) Transverse vibration tests for prediction of stiffness and strength properties of full size Eucalyp-tus grandis. Forest Prod J 52:63–67
5. Wang X, Ross RJ, Mattson JA, Erickson JR, Forsman JW, Geskse EA, Wehr MA (2002) Nondestructive evaluation techniques for assessing modulus of elasticity and stiffness of small-diameter logs. Forest Prod J 52:79–85
6. Wang SY, Lin SH (1996) Effect of plantation spacing with quality of visually graded lumber and mechanical properties of Taiwan-grown Japanese cedar. Mokuzai Gakkaishi 42:435–444
7. Wang SY, Ko CY (1998) Dynamic modulus of elasticity and bend-ing properties of large beams of Taiwan-grown Japanese cedar from different plantation spacing sites. Mokuzai Gakkaishi 44:62– 68
8. Hernandez R, Moody RC (1992) Improved performance of south-ern pine structural glued-laminated timber. Research Paper FPL-RP-514. USDA Forest Service, Forest Products Laboratory, Madison, WI
9. Manbeck HB, Janowiak JJ, Blankenhorn PR, Labosky P, Moody RC, Hernandez R (1993) Red maple glulam timber beam perfor-mance. Research Paper FPL-RP-519. USDA Forest Service, For-est Products Laboratory, Madison, WI
10. Janowiak JJ, Manbeck HB, Hernandez R, Moody RC, Blankenhorn PR, Labosky P (1995) Efficient utilization of red maple lumber in glued-laminated timber beams. Research Paper FPL–RP–541. USDA Forest Service, Forest Products Laboratory, Madison, WI
11. Moody RC, Hernandez R, Davalos JF, Sonti SS (1993) Yellow poplar glulam timber beam performance. Research Paper FPL-RP-520. USDA Forest Service, Forest Products Laboratory, Madi-son, WI
12. Falk RH (1997) Design and performance aspects of United States and European glulam. Proceedings of the Conference on Research Standardization Applications, Institute for Steel Construction, Wood Construction, and Industrial Construction, Technical Uni-versity Graz, Austria, 6 June 1997, pp C/2-1–C/2-21
13. Falk RH, Colling F (1995) Laminating effect in glued-laminated timber beams. J Struct Eng ASCE 121:1857–1863
14. Lee JJ, Park JS, Kim KM, Oh JK (2005) Prediction of bending properties for structural glulam using optimized distributions of knot characteristics and laminar MOE. J Wood Sci 51:640–647 15. Yamada M, Takada M, Sano A (2001) Fire-resistance performance
of structural LVL (4). Abstracts of the 51st Annual Meeting of the Japan Wood Research Society, p 425
16. Wang SY, Cho JL (1985) Studies on the dynamic and acoustic behaviors of wood (III). Forest Prod Ind 4:2–26
17. Okuma M (1967) Studies on the mechanical properties of plywood. Bull Tokyo Univ Forest 63:1–60
18. Wang SY, Chang T (1978) Studies on the flexural properties of laminated beams with different wood species (1). Bending modu-lus of elasticity. Q J Chinese Forest 11:43–52
20. Doyle DV, Markwart LJ (1966) Properties of southern pine in relation to strength grading of dimension lumber. Research Paper FPL-64. USDA Forest Service, Forest Products Laboratory, Madi-son, WI
21. Bodig J, Jayne BA (1982) Mechanics of wood and wood compos-ites. Van Nostrand Reinhold, New York
22. Ohlsson S, Perstorper M (1992) Elastic wood properties from dy-namic tests and computer modeling. J Struct Eng ASCE 18:2677– 2690
23. Isoda H, Mori T, Sasagawa A (2000) The resistance and fracture mechanisms of glulam beams in bending. J Struct Construct Eng 529:13–20