RESEARCH
Chest CT scan and alveolar procollagen
III to predict lung fibroproliferation in acute
respiratory distress syndrome
Annabelle Hamon
1,2, Ugo Scemama
3, Jérémy Bourenne
2,4, Florence Daviet
1,2, Benjamin Coiffard
1,2,
Nicolas Persico
1,2, Mélanie Adda
1,2, Christophe Guervilly
1,2, Sami Hraiech
1,2, Kathia Chaumoitre
3,
Antoine Roch
1,2, Laurent Papazian
1,2and Jean‑Marie Forel
1,2*Abstract
Background: Lung fibroproliferation in ARDS patients is associated with mortality. Alveolar procollagen III (NT‑PCP‑III) is a validated biomarker of lung fibroproliferation. A chest CT scan could be useful for the diagnosis of lung fibroprolif‑ eration. The aim of this study was to identify lung fibroproliferative CT scan aspects in ARDS patients with high levels of NT‑PCP‑III.
Results: This retrospective study included ARDS patients who had at least one assessment of alveolar NT‑PCP‑III and a chest CT scan within 3 days before or after NT‑PCP‑III determination. An alveolar level of NT‑PCP‑III > 9 µG/L indicated fibroproliferation. The CT scan was scored on interstitial and alveolar abnormalities. Each lobe was scored from 0 to 5 according to the severity of the abnormalities. The crude score and the corrected score (related to the number of scored lobes in cases of important lobar condensation or lobectomy) were used. One hundred ninety‑two patients were included, for a total of 228 alveolar NT‑PCP‑III level and CT scan ‘couples’. Crude and corrected CT scan fibrosis scores were higher in the fibroproliferation group compared with the no fibroproliferation group (crude score: 12 [9–17] vs 14 [11–12], p= 0.002; corrected score: 2.8 [2.2–4.0] vs 3.4 [2.5–4.7], p < 0.001). CT scan fibrosis scores and NT‑PCP‑III levels were significantly but weakly correlated (crude score: ρ= 0.178, p= 0.007; corrected score: ρ= 0.184,
p= 0.005).
Conclusions: When the alveolar level of NT‑PCP‑III was used as a surrogate marker of histological lung fibroprolif‑ eration, the CT scan fibrosis score was significantly higher in patients with active lung fibroproliferation. Pulmonary condensation is the main limitation to diagnosing fibroproliferation during ARDS.
Keywords: Acute respiratory distress syndrome, Fibroproliferation, CT scan, Scoring, Procollagen, Lung fibrosis
© The Author(s) 2019. This article is distributed under the terms of the Creative Commons Attribution 4.0 International License (http://creat iveco mmons .org/licen ses/by/4.0/), which permits unrestricted use, distribution, and reproduction in any medium, provided you give appropriate credit to the original author(s) and the source, provide a link to the Creative Commons license, and indicate if changes were made.
Background
Acute respiratory distress syndrome (ARDS) is asso-ciated with a high mortality rate of 35% in intensive care units and 40% in hospitals [1]. Histological stud-ies show that an early inflammatory phase is followed by a fibroproliferative repair phase, leading to either the resolution of ARDS or irreversible lung fibrosis [2]. It
has been shown that this ARDS-associated lung fibrosis is linked to a poor outcome [3–5], an increase in the duration of mechanical ventilation [6] and an altera-tion in the quality of life [7]. Modulating excessive lung fibroproliferation could improve the ARDS progno-sis. Corticosteroid treatments have been shown to be effective in improving the number of days alive with-out mechanical ventilation [8, 9], although the effect on mortality is still controversial [10–13]. All these points plead for the use of diagnostic tools for the early diag-nosis of lung fibroproliferation during ARDS.
Open Access
*Correspondence: jean‑marie.forel@ap‑hm.fr
1 Médecine Intensive Réanimation Détresses Respiratoires et Infection
The gold standard for diagnosing ARDS-associated lung fibrosis remains an open lung biopsy (OLB) and histological examination, which is invasive and cannot be repeated easily [14]. Clinical parameters (oxygena-tion; compliance of respiratory system) remain insuffi-cient and unspecific for the diagnosis. The N-terminal peptide of alveolar procollagen III (NT-PCP-III) is vali-dated as an alternative diagnostic test [15]. A precursor of collagen III, NT-PCP-III represents the pulmonary turnover of collagen [16–18]. It has been shown that alveolar NT-PCP-III exceeding 9 µG/L on bronchoal-veolar lavage (BAL) is associated with histological lung fibroproliferation [15].
Chest CT scan is less invasive that fibroscopic bron-choalveolar lavage and is available everywhere, con-versely to NT-PCP-III. The radiologists describe frequently ground glass opacities, interlobular septal thickenings and sometime honeycombing in ARDS patients. The clinicians use frequently these findings for the lung fibrosis diagnostic in the clinical prac-tice. In the context of idiopathic pulmonary fibrosis, a chest CT scan allows the diagnosis and quantification of fibroproliferative lung lesions [19, 20]. Several stud-ies highlight its use in predicting morbidity and mor-tality during ARDS [6, 21, 22], although few studies have validated the diagnostic yield of CT scan for the diagnosis of fibroproliferation during ARDS. In the first 24 h of ARDS, Ichikado et al. [22] showed that a low lung fibroproliferation CT scan score was associated with a decrease in mortality (19.1 vs 57.9%, p < 0.0001) and an increase in the number of days alive and free of mechanical ventilation (14.3 vs 5.1 days, p < 0.0001). On the 14th day of ARDS evolution, Burnham et al. [23] showed the presence of CT scan signs of fibroprolifera-tion in patients with the lowest static respiratory sys-tem compliance.
The main objective of the present study was there-fore to quantify chest CT scan lesions in ARDS patients with a high alveolar level of NT-PCP-III, indicating a lung active fibroproliferation. The secondary aim was to determine the threshold for the CT scan fibrosis score compared to the alveolar level of NT-PCP-III.
Methods
Setting and participants
This study was designed retrospectively, but all the infor-mation needed to complete the datasheet was obtained prospectively. The study was carried out in the 14-bed intensive care unit of a teaching hospital from January 2013 to January 2017 and conducted according to French ethical law. The Institutional Review Board committee approved the research (Comité Informatique et Liberté AP-HM, 2017-0014). No interventional strategy was
tested. Informed consent was not required due to the ret-rospective nature of the study. Patient information was anonymized before the analysis.
From a patient data registry, we selected all patients who, during the evolution of ARDS, had at least one dose of alveolar NT-PCP-III (obtained by performing a BAL) and a chest CT scan within a maximum interval of 3 days (i.e. BAL within 3 days before/after the chest CT scan). If a patient presented at least one of the following diagno-ses, he/she was excluded: lung transplant, autoimmune diseases as vasculitis, chronic fibrotic lung disease or cor-ticosteroid treatment (> 200 mg/day of hydrocortisone or equivalent at any moment during the month preceding inclusion). When one patient had multiple chest CT scan and alveolar NT-PCP-III determination ‘couples’, each case was included in the analysis.
Measures
Bronchoalveolar lavage was performed according to a standardized procedure as part of clinical care. The BAL fluid was obtained from the most infiltrated lung area on chest X-ray according to a previously described technique [15]. Alveolar NT-PCP-III was measured using a radioimmunological method (UniQ-procollagen III Radioimmunoassay; Orion Diagnostica, Espoo, Fin-land). The alveolar NT-PCP-III threshold used to define lung fibroproliferation was > 9 µG/L [15]. The ‘lung fibro-proliferation group’ was defined by an alveolar level of NT-PCP-III > 9 µG/L, and the ‘no lung fibroprolifera-tion group’ was defined by an alveolar level of NT- PCP-III ≤ 9 µG/L.
The crude CT scan score was calculated as the sum of the points of each scored lobe. A non-evaluated lobe was counted as 0 points in the crude score, which could range from 0 to 25 for ground glass and from 0 to 25 for honeycombing. The total crude score ranged from 0 to 50. When a lobe could not be evaluated (important con-densation, lobectomy), the CT scan score was corrected for the number of evaluated lobes. The corrected fibro-proliferation CT scan score was calculated as the ratio of the sum of the points of each scored lobe to the num-ber of evaluated lobes (corrected score = crude score/ number of evaluated lobes). An analysis of 15 CT scans was performed jointly by the two radiologists to cali-brate the technique of interpretation and calculation of the score. The agreement of interpretation between the 2 radiologists was analysed by calculating the intraclass correlation coefficient. A collegial analysis between the 2 radiologists occurred in cases of a difference exceeding 10% between the 2 scores calculated by each radiologist. The mean of the scores calculated by the 2 radiologists was used for the statistical analysis. Among all selected patients, 10 patients had open lung biopsy [25] carried out within 7 days after BAL or CT scan.
Statistical analysis
Descriptive statistics included percentages for categorical variables and medians [interquartile range] for continu-ous variables according to the distribution. Comparisons between the 2 groups according to lung fibroproliferation for continuous variables were made using a linear mixed model. ICU mortality according to lung fibroproliferation was compared by generalized linear model (generalized equation estimation). Comparisons between the 2 groups for categorical variables were made using Pearson’s Chi-square test or Fisher’s exact test. Correlations between alveolar levels of NT-PCP-III and lung fibroproliferation CT scan scores were carried out by the Spearman test. Using the alveolar levels of NT-PCP-III as a reference (threshold 9 µG/L) [15], we calculated the sensitivity, specificity and predictive values of the CT scan fibrosis scores. The best cut-off value was chosen using Youden’s index. All two-tailed p values < 0.05 were considered to be statistically significant. The analyses were performed using SPSS version 20.0 (NY, USA).
Results
One hundred ninety-two patients were included. The flow chart of the study is presented in Fig. 1. Char-acteristics of the patients are summarized in Table 1. Twenty-eight (14.5%) patients had 2 NT-PCP-III samples associated with 2 different CT scans. Four (2%) patients had 3 NT-PCP-III samples associated with 3 different CT
scans. Finally, 228 ‘couples’ (cases) of alveolar NT-PCP-III level and CT scan (within 3 days) were analysed. At the threshold of NT-PCP-III > 9 µG/L, 53 cases (23.2%) had lung fibroproliferation.
The median delay between the onset of ARDS and the CT scan was 5 [0–14] days, between the onset of ARDS and the BAL was 5 [0–14] days, and between the BAL and the CT scan was 0 [− 1 to 1] days. In 73 (32%) cases, the BAL was performed on the same day as the CT scan; in 71 (31.3%) cases, before; and in 84 (36.9%) cases, after. Patients were comparable in regard to ventilatory param-eters and SOFA scores on the days of determination of the NT-PCP-III level and the CT scan (Additional file 2).
Values of lung fibroproliferation CT scan scores according to alveolar NT-PCP-III levels are given in Table 2. The median values of the crude and corrected scores were 12 [9–18] and 3.0 [2.2–4.2], respectively. Crude and corrected fibrosis scores were significantly higher in patients presenting alveolar NT-PCP-III > 9 µG/L. CT scan fibrosis scores were significantly but weakly correlated with alveolar NT-PCP-III levels (crude score: Spearman’s ρ= 0.178, p= 0.007; corrected score: Spearman’s ρ= 0.184, p= 0.005) (Fig. 2 and Additional file 3).
Figure 3 shows the CT scan fibrosis scores according to lung segmentation and alveolar NT-PCP-III. In 28 (12.3%) cases, the right upper lobe could not be evalu-ated, as well as 10 (4.4%) cases for the upper left lobe, 27 (11.8%) for the middle lobe, 64 (28.1%) for the lower right lobe, and 54 (23.7%) for the lower left lobe. The intra-class correlation coefficient calculated based on the two
radiologists’ results was 0.97 [95% confidence interval (CI) 0.96–0.98; p < 0.001]. No relationship was identified between the extent of lung fibroproliferation (deter-mined by alveolar NT-PCP-III or CT scan) and the delay between ARDS onset and of this assessment.
When the alveolar level of NT-PCP-III was used to define lung fibroproliferation with a threshold of > 9 µG/L, we showed that the corrected CT scan fibrosis score had a sensitivity of 68% (95% CI 54–80), a speci-ficity of 50% (95% CI 43–58), a positive predictive value of 29% (95% CI 22–38), and a negative predictive value of 71% (95% CI 62–78). The crude CT scan fibrosis score had a sensitivity of 47% (95% CI 34–61), a specificity of 66% (95% CI 58–73), a positive predictive value of 29% (95% CI 20–40) and a negative predictive value of 71% (95% CI 60–80).
ARDS characteristics, ventilatory parameters and outcome according to alveolar levels of NT-PCP-III (threshold > 9 µG/L) and corrected fibrosis scores (threshold ≥ 3.0) are presented in Table 3. Eleven (5.7%)
patients received corticosteroids for lung fibroprolifera-tion treatment according to the protocol described by Meduri et al. (methylprednisolone 2 mg/kg) [10]. No patient was treated prior to the BAL or CT scan.
Ten patients (among the 228 selected patients) had open lung biopsy for histological assessment. Table 4 reports the alveolar levels of NT-PCP-III and the CT scan fibrosis scores according to the histological lung fibroproliferation. The number of lobes evaluated by CT scan was same in the group with fibroproliferation Table 1 Characteristics of the patients at ARDS onset
Values are expressed as median [IQR], except for sex, cause of ARDS and ICU mortality [n (%)]
ARDS acute respiratory distress syndrome, SAPS II simplified acute physiologic score, SOFA sequential organ failure assessment, PBW predicted body weight,
PEEP positive end-expiratory pressure, ICU intensive care unit
a Chest trauma with lung contusion (n= 18), transfusion-related acute lung
injury (n= 10), hemoptysis (n= 4)
Variables All patients (n= 192)
Age (years) 60 [48–69]
Sex [n (%) men] 137 (71.4) Body mass index (kg/m2) 25.8 [21.9–29.2]
SAPS II 47 [38–69]
SOFA 8 [7–11]
Cause of ARDS [n (%)]
Pneumonia 104 (54.2)
Aspiration 28 (14.6)
Extra‑pulmonary sepsis 28 (14.6)
Othersa 32 (16.6)
Minute ventilation (L/min) 9.3 [6.6–10.8] Tidal volume (mL/kg PBW) 6.1 [5.0–6.7] Respiratory rate (cycle/min) 24 [18–27] Plateau pressure (cmH2O) 25 [21–28] Driving pressure (cmH2O) 13 [9–16] Total PEEP (cmH2O) 10 [8–13] Respiratory system compliance (mL/cmH2O) 26.5 [21.3–36.6]
pH 7.36 [7.29–7.43]
PaO2/FiO2 (mmHg) 129 [92–197]
PaCO2 (mmHg) 43 [36–50]
Ventilator‑free days at day 60 (days) 22 [0–46] Length of ICU stay (days) 24 [12–38] ICU mortality [n (%)] 69 (35.7)
Table 2 CT scan fibrosis scores according to lung fibroproliferation (NT-PCP-III > 9µG/L)
Values are expressed as median [IQR]. NT-PCP-III: N-terminal peptide for type III procollagen. Each lobe of the lung was scored on a scale of 0–5 points for both ground glass and honeycombing abnormality. In the case of lobectomy or when consolidation was observed in more than 75% of a lobe, the score was not used for this lobe. The CT scan crude fibrosis score was calculated as the sum of points obtained for each lobe. We corrected the score by reporting it to the number of lobes evaluated (corrected fibrosis score = crude fibrosis score/number of lobes evaluated)
p values were calculated by linear mixed model
No lung fibroproliferation (n= 175) (NT-PCP-III ≤ 9 µG/L)
Lung
fibroproliferation (n= 53)
(NT-PCP-III > 9 µG/L)
p value
Crude fibrosis score 12 [9–17] 14 [11–21] 0.002 Ground glass 7 [5–12] 9 [6–14] 0.007 Honeycombing 4 [4–5] 5 [3–5] 0.015 Corrected fibrosis
score 2.8 [2.2–4.0] 3.4 [2.5–4.7] < 0.001 Ground glass 1.8 [1.2–3.0] 2.3 [1.5–3.3] 0.003 Honeycombing 1 [1–1] 1 [1–1] < 0.001
or without histological fibroproliferation (4 [2–4] and 4 [4–4], p= 0.96, respectively). The median delay between the onset of ARDS and OLB was of 7 [5–23] days,
between LBA and OLB 3 [2–4] days, and between CT scan and OLB 3 [2–5] days.
Discussion
Alveolar NT-PCP-III and CT scan are useful diagnos-tic tools for lung fibroproliferation during ARDS. When the alveolar level of NT-PCP-III is used as a surrogate marker of histological lung fibroproliferation, CT scan fibrosis scores are significantly higher in patients show-ing active pulmonary fibroproliferation. Nevertheless,
Fig. 3 CT scan fibrosis score according to lung segmentation. Error bars represent standard error of mean (SEM), BAL bronchoalveolar lavage, NT-PCP-III N‑terminal peptide for type III procollagen
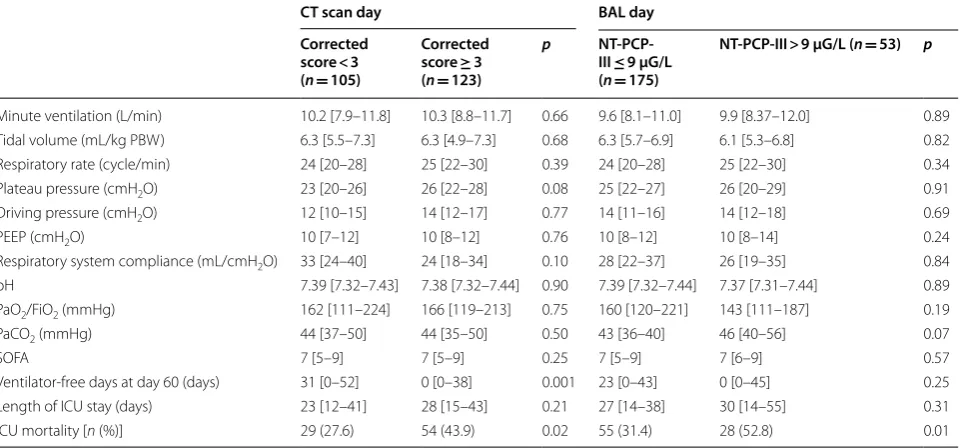
Table 3 Characteristics of ARDS, ventilatory parameters and outcome according to lung fibroproliferation and CT scan fibrosis score
Values are expressed as median [IQR]
ARDS acute respiratory distress syndrome, BAL bronchoalveolar lavage, PBW predicted body weight, PEEP positive end-expiratory pressure, SOFA sequential organ failure assessment, NT-PCP-III NT-peptide for type III procollagen
p values were calculated by linear mixed model, excepted for ICU mortality by generalized linear model (generalized equation estimation)
CT scan day BAL day Corrected
score < 3 (n= 105)
Corrected score ≥ 3 (n= 123)
p NT-PCP-III ≤ 9 µG/L (n= 175)
NT-PCP-III > 9 µG/L (n= 53) p
Minute ventilation (L/min) 10.2 [7.9–11.8] 10.3 [8.8–11.7] 0.66 9.6 [8.1–11.0] 9.9 [8.37–12.0] 0.89 Tidal volume (mL/kg PBW) 6.3 [5.5–7.3] 6.3 [4.9–7.3] 0.68 6.3 [5.7–6.9] 6.1 [5.3–6.8] 0.82 Respiratory rate (cycle/min) 24 [20–28] 25 [22–30] 0.39 24 [20–28] 25 [22–30] 0.34 Plateau pressure (cmH2O) 23 [20–26] 26 [22–28] 0.08 25 [22–27] 26 [20–29] 0.91 Driving pressure (cmH2O) 12 [10–15] 14 [12–17] 0.77 14 [11–16] 14 [12–18] 0.69 PEEP (cmH2O) 10 [7–12] 10 [8–12] 0.76 10 [8–12] 10 [8–14] 0.24 Respiratory system compliance (mL/cmH2O) 33 [24–40] 24 [18–34] 0.10 28 [22–37] 26 [19–35] 0.84 pH 7.39 [7.32–7.43] 7.38 [7.32–7.44] 0.90 7.39 [7.32–7.44] 7.37 [7.31–7.44] 0.89 PaO2/FiO2 (mmHg) 162 [111–224] 166 [119–213] 0.75 160 [120–221] 143 [111–187] 0.19 PaCO2 (mmHg) 44 [37–50] 44 [35–50] 0.50 43 [36–40] 46 [40–56] 0.07
SOFA 7 [5–9] 7 [5–9] 0.25 7 [5–9] 7 [6–9] 0.57
Ventilator‑free days at day 60 (days) 31 [0–52] 0 [0–38] 0.001 23 [0–43] 0 [0–45] 0.25 Length of ICU stay (days) 23 [12–41] 28 [15–43] 0.21 27 [14–38] 30 [14–55] 0.31 ICU mortality [n (%)] 29 (27.6) 54 (43.9) 0.02 55 (31.4) 28 (52.8) 0.01
Table 4 Relationship between the level of alveolar NT-PCP-III, CT scan fibrosis score and the histological lung fibroproliferation on open lung biopsies
Ten patients have an open lung biopsy within 7 days around the BAL and the chest CT scan. Values are expressed as median [IQR]
NT-PCP-III N-terminal peptide for type III procollagen, BAL bronchoalveolar lavage
No histological fibroproliferation (n= 7)
Histological fibroproliferation (n= 3)
p value
NT‑PCP‑III (µG/L) 1 [1–1] 13 [10–99] 0.01 Corrected fibrosis
score 2.5 [1.0–3.0] 3.0 [2.8–5.0] 0.14 Ground glass
score 1.5 [0.3–2.0] 2.0 [1.8–4.0] 0.14 Honeycombing
the sensitivity, specificity and predictive values of the CT scan fibrosis scores were poor (all ≤ 71%) compared to the alveolar levels of NT-PCP-III. Pulmonary condensa-tion is the main limitacondensa-tion to diagnosing fibroprolifera-tion by chest CT scan during ARDS.
This study is the first to describe the radiologic damage to the lungs caused by fibroproliferation during ARDS according to the alveolar levels of NT-PCP-III [15, 26]. Our results were drawn from a large series; however, these should be considered as preliminary and need to be interpreted cautiously. Indeed, the significant but weak correlation between the CT scan fibrosis scores and alveolar NT-PCP-III levels could be explained by the fact that the BAL was performed in the most condensed lobe of the thoracic X-ray (most of the time, one of the lower pulmonary lobes), whereas the lower lobes could not be evaluated by CT scan because of the condensations. We showed that the CT scan fibrosis scores in the right lower lobes were not significantly different according to alveolar NT-PCP-III levels (Fig. 3). Pulmonary condensa-tion was the main limitacondensa-tion for the assessment of the CT scan fibrosis score.
The second hypothesis to explain the low correlation between fibrosis scores and NT-PCP-III levels may be related to the chronological change in the lung fibro-proliferation process. Alveolar NT-PCP-III is an early marker of lung fibroproliferation. As a collagen III pre-cursor, alveolar NT-PCP-III precedes the deposition of type 1 collagen associated with histological lung fibrosis [26–28]. CT scans describe lung fibrosis signs that cor-respond to alterations in the pulmonary structure. We showed that when CT scan fibrosis scores are high, pla-teau pressures and respiratory system compliance tend to be higher and lower, respectively (Table 3). These results agree with the study by Burnham et al. [23], which showed that plateau pressures and static respira-tory system compliance were correlated with the pres-ence of crosslinking, ground glass and bronchiectasis on CT scans on the 14th day of ARDS. This difference in the age assessment of the lung fibroproliferative process could explain the weak correlation found in our study. Indeed, in the present study, alveolar levels of NT-PCP-III were measured relatively early in the ARDS history (5 [0–14] days). However, Forel et al. [15] showed that high alveolar levels of NT-PCP-III on the 6th day (median) of ARDS onset are associated with histological lung fibro-proliferation on lung biopsy performed on the 10th day (median). The different stage in the fibroproliferative process could explain why we did not find a significant difference in ventilatory parameters based on alveolar NT-PCP-III, including respiratory system compliance. In fact, it is the deposition of collagen I within the lung tis-sue that causes a decrease in elasticity and a reduction in
lung compliance. Demoule et al. [29] showed an inversely proportional logarithmic relationship between respira-tory system compliance and alveolar NT-PCP-III. We not observed a similar relationship. This difference could be explained by the use of different assay techniques to determine NT-PCP-III in Demoule and our study. The reduction in respiratory system compliance remains a complex matter of interpretation. Pulmonary volume reduction during ARDS appeared to be the main mech-anism for this reduction [29, 30], but lung damage and thoracic wall involvement also played a role, which was not analysed in our study. Moreover, in the present study, we registered respiratory system compliance on the day of BAL and CT scan, but we not analysed its changes during time which are relevant in the clinical practice.
Our study has others limitations. The CT scan fibro-sis score used was initially described for idiopathic pul-monary fibrosis [24]. Pulmonary condensation, which is common in ARDS patients, was the main limitation of the CT scan fibrosis evaluation in our study. Concern-ing alveolar abnormalities, ground glass is a non-specific sign due to ARDS and to any cause of partial filling of the alveolar air space [31]. Concerning interstitial abnormali-ties, only a few patients had honeycombing. This low pro-portion is in line with the results of Ichikado et al. [22] (in fact, none of their patients had honeycombing), but the difference could be explained by the early time period of the CT scan in their study (24 h) compared to ours (5 [0–14] days). When honeycombing was observed, it was not possible to identify whether distinct abnormalities existed prior to or were due to ARDS when no previ-ous chest CT examination was found. Septal thickening is a non-specific sign and can be the result of numer-ous causes: lung fibrosis due to ARDS, or any vennumer-ous, lymphatic or infiltrative diseases. Despite the rigorous selection of patients in our study, this bias was possible. Others CT scan fibrosis scores are described in the litera-ture [22, 23], but, unlike the score used [24], none were validated by histological data. To date, the alveolar level of NT-PCP-III can be considered as the best surrogate marker to an OLB for the diagnosis of lung fibroprolif-eration [15]. However, the treatment by corticosteroids of lung fibroproliferation remains discussed [10, 13]. Stein-berg et al. showed a trend in mortality reduction in the ARDS patients with high alveolar levels of NT-PCP-III and treated by methylprednisolone. We started a confir-mation study (PROCOCO, NCT03371498).
Conclusions
with active lung fibroproliferation. Nevertheless, pul-monary condensation is the main limitation to diagnos-ing fibroproliferation by CT scan durdiagnos-ing ARDS. Further studies are needed to determine the position of the CT scan in the strategy of early diagnosis for lung fibroprolif-eration in ARDS.
Additional files
Additional file 1. CT scan scoring system for lung fibrosis.
Additional file 2. Comparison of ventilatory parameters and organ dys‑ function score on CT scan and BAL days.
Additional file 3. Relationship between crude CT scan fibrosis score and alveolar levels of NT‑PCP‑III.
Abbreviations
ARDS: acute respiratory distress syndrome; BAL: bronchoalveolar lavage; CT scan: computerized tomography scan; NT‑PCP‑III: N‑terminal‑peptide type III procollagen; OLB: open lung biopsy; SOFA: sequential organ failure assessment.
Authors’ contributions
JMF, AH and LP designed the work. JB, FD, BC, MA and NP collected the data. AH, JMF and CG analysed, interpreted the patient data and wrote the manu‑ script. SH, AR and LP revised the manuscript. US and KC scored the chest CT scan and interpreted the radiological data. All authors read and approved the final manuscript.
Author details
1 Médecine Intensive Réanimation Détresses Respiratoires et Infection Sévères,
AP‑HM, CHU Nord, chemin des Bourrely, 13015 Marseille, France. 2 CER‑
eSS ‑ Centre for Studies and Research on Health Services and Quality of Life EA3279, Faculté de médecine, Aix‑Marseille University, Boulevard Jean Moulin, Marseille, France. 3 Imagerie Médicale, AP‑HM, CHU Nord, chemin des Bourrely,
13015 Marseille, France. 4 Médecine Intensive Réanimation des Urgences
Médicales, AP‑HM, CHU Timone, 13005 Marseille, France.
Acknowledgements
This manuscript was edited for proper English language, grammar, punctua‑ tion, spelling and overall style by one or more of the highly qualified native English‑speaking editors at American Journal Experts.
Competing interests
The authors declare that they have no competing interests.
Availability of data and materials
The data sets used and/or analysed during the current study are available from the corresponding author on reasonable request.
Consent for publication Not applicable.
Ethics approval and consent to participate
The study was approved by the Institutional Review Board committee (Comité Informatique et Liberté AP‑HM, 2017‑0014). According to French law, informed consent was not required due to the retrospective nature of the study.
Funding None.
Publisher’s Note
Springer Nature remains neutral with regard to jurisdictional claims in pub‑ lished maps and institutional affiliations.
Received: 27 November 2018 Accepted: 18 March 2019
References
1. Bellani G, Laffey JG, Pham T, Fan E, Brochard L, Esteban A, et al. Epidemiol‑ ogy, patterns of care, and mortality for patients with acute respira‑ tory distress syndrome in intensive care units in 50 countries. JAMA. 2016;315(8):788.
2. Ware LB, Matthay MA. The acute respiratory distress syndrome. N Engl J Med. 2000;342:1334–49.
3. Martin C, Papazian L, Payan M‑J, Saux P, Gouin F. Pulmonary fibrosis correlates with outcome in adult respiratory distress syndrome. Chest. 1995;107(1):196–200.
4. Clark JG, Type III. Procollagen peptide in the adult respiratory distress syn‑ drome: association of increased peptide levels in bronchoalveolar lavage fluid with increased risk for death. Ann Intern Med. 1995;122(1):17. 5. Marshall RP, Bellingan G, Webb S, Puddicombe A, Goldsack N, McAN‑
ULTY RJ, et al. Fibroproliferation occurs early in the acute respiratory distress syndrome and impacts on outcome. Am J Respir Crit Care Med. 2000;162(5):1783–8.
6. Ichikado K, Suga M, Muranaka H, Gushima Y, Miyakawa H, Tsubamoto M, et al. Prediction of prognosis for acute respiratory distress syndrome with thin‑section CT: validation in 44 cases. Radiology. 2006;238(1):321–9. 7. Burnham EL, Janssen WJ, Riches DWH, Moss M, Downey GP. The fibropro‑
liferative response in acute respiratory distress syndrome: mechanisms and clinical significance. Eur Respir J. 2014;43(1):276–85.
8. Meduri GU, Golden E, Freire AX, Taylor E, Zaman M, Carson SJ, et al. Meth‑ ylprednisolone infusion in early severe ARDS. Chest. 2007;131(4):954–63. 9. Meduri GU, Bridges L, Shih M‑C, Marik PE, Siemieniuk RAC, Kocak M.
Prolonged glucocorticoid treatment is associated with improved ARDS outcomes: analysis of individual patients’ data from four randomized trials and trial‑level meta‑analysis of the updated literature. Intensive Care Med. 2016;42(5):829–40.
10. Meduri GU, Headley AS, Golden E, Carson SJ, Umberger RA, Kelso T, et al. Effect of prolonged methylprednisolone therapy in unresolving acute respiratory distress syndrome: a randomized controlled trial. JAMA. 1998;280(2):159.
11. Meduri GU, Marik PE, Chrousos GP, Pastores SM, Arlt W, Beishuizen A, et al. Steroid treatment in ARDS: a critical appraisal of the ARDS network trial and the recent literature. Intensive Care Med. 2008;34(1):61–9.
12. Meduri GU, Siemieniuk RAC. Prolonged glucocorticoid treatment in acute respiratory distress syndrome. Lancet. 2017;389(10078):1516.
13. Steinberg K. Efficacy and safety of corticosteroids for persistent acute respiratory distress syndrome. N Engl J Med. 2006;354:1671–84. 14. Philipponnet C, Cassagnes L, Pereira B, Kemeny J‑L, Devouassoux‑
Shisheboran M, Lautrette A, et al. Diagnostic yield and therapeutic impact of open lung biopsy in the critically ill patient. PLoS ONE. 2018;13(5):e0196795.
15. Forel J‑M, Guervilly C, Hraiech S, Voillet F, Thomas G, Somma C, et al. Type III procollagen is a reliable marker of ARDS‑associated lung fibroprolifera‑ tion. Intensive Care Med. 2015;41(1):1–11.
16. Shahzeidi S, Mulier B, de Crombrugghe B, Jeffery PK, McAnulty RJ, Laurent GJ. Enhanced type III collagen gene expression during bleomycin induced lung fibrosis. Thorax. 1993;48(6):622–8.
17. Low RB, Giancola MS, King TE, Chapitis J, Vacek P, Davis GS. Serum and bronchoalveolar lavage of N‑terminal type III procollagen peptides in idiopathic pulmonary fibrosis. Am Rev Respir Dis. 1992;146(3):701–6. 18. Bjermer L, Lundgren R, Hallgren R. Hyaluronan and type III procollagen
peptide concentrations in bronchoalveolar lavage fluid in idiopathic pulmonary fibrosis. Thorax. 1989;44(2):126–31.
19. Chung JH, Lynch DA. The value of a multidisciplinary approach to the diagnosis of usual interstitial pneumonitis and idiopathic pulmonary fibrosis: radiology, pathology, and clinical correlation. Am J Roentgenol. 2016;206:463–71.
21. Ichikado K, Suga M, Müller NL, Taniguchi H, Kondoh Y, Akira M, et al. Acute interstitial pneumonia: comparison of high‑resolution computed tomog‑ raphy findings between survivors and nonsurvivors. Am J Respir Crit Care Med. 2012;165(11):1551–6. https ://doi.org/10.1164/rccm.21061 57. 22. Ichikado K, Muranaka H, Gushima Y, Kotani T, Nader HM, Fujimoto K, et al.
Fibroproliferative changes on high‑resolution CT in the acute respira‑ tory distress syndrome predict mortality and ventilator dependency: a prospective observational cohort study. BMJ Open. 2012;2(2):e000545. 23. Burnham EL, Hyzy RC, Paine R, Kelly AM, Quint LE, Lynch D, et al. Detec‑ tion of fibroproliferation by chest high‑resolution CT scan in resolving ARDS. Chest. 2014;146(5):1196–204.
24. Kazerooni EA, Martinez FJ, Flint A, Jamadar DA, Gross BH, Spizarny DL, et al. Thin‑section CT obtained at 10‑mm increments versus limited three‑level thin‑section CT for idiopathic pulmonary fibrosis: correlation with pathologic scoring. Am J Roentgenol. 1997;169(4):977–83. 25. Papazian L, Doddoli C, Chetaille B, Gernez Y, Thirion X, Roch A, et al. A con‑
tributive result of open‑lung biopsy improves survival in acute respiratory distress syndrome patients. Crit Care Med. 2007;35(3):755–62.
26. Farjanel J, Hartmann DJ, Guidet B, Luquel L, Offenstadt G. Four markers of collagen metabolism as possible indicators of disease in the adult respira‑ tory distress syndrome. Am Rev Respir Dis. 1993;147(5):1091–9.
27. Armstrong L, Thickett DR, Mansell JP, Ionescu M, Hoyle E, Clark Billinghurst R, et al. Changes in collagen turnover in early acute respiratory distress syndrome. Am J Respir Crit Care Med. 1999;160(6):1910–5.
28. Umberto Meduri G, Tolley EA, Chinn A, Stentz F, Postlethwaite A. Procol‑ lagen types I and III aminoterminal propeptide levels during acute respiratory distress syndrome and in response to methylprednisolone treatment. Am J Respir Crit Care Med. 1998;158(5):1432–41. 29. Demoule A, Decailliot F, Jonson B, Christov C, Maitre B, Touqui L, et al.
Relationship between pressure‑volume curve and markers for collagen turn‑over in early acute respiratory distress syndrome. Intensive Care Med. 2006;32(3):413–20.
30. Rouby J‑J, Puybasset L, Nieszkowska A, Lu Q. Acute respiratory distress syndrome: lessons from computed tomography of the whole lung. Crit Care Med. 2003;31:S285–95.