O R I G I N A L P A P E R
Open Access
A Nested Logit analysis of the influence of
distraction on types of vehicle crashes
Hesamoddin Razi-Ardakani
1, Ahmadreza Mahmoudzadeh
2*and Mohammad Kermanshah
1Abstract
Purpose:This work aims to study factors, such as driver characteristics, environmental conditions, and vehicle characteristics, that affect different crash types with a special focus on distraction parameters. For this purpose, distraction factors are divided into five groups: cellphone usage, cognitive distractions, passengers distracting the driver, outside events attracting the driver’s attention, and in-vehicle activities.
Methods:Taking the crashes that occurred in the USA into account, the crash types are divided into two main groups, single-vehicle crashes and two-vehicle crashes. Since there were different crash types (alternatives) in the dataset and the probable correlation in the unobserved error term, the Nested Logit model is developed.
Results:The results of model illustrate that all of the aforementioned distraction-related factors increase the probability of run-off-road crashes, collision with a fixed object, and rear-end crashes. Cognitive distraction increases the probability of collision with a pedestrian. Distractions caused by passengers or out-of-vehicle events increase the probability of sideswipe crashes.
Conclusion:By examining how a factor affects multiple crash type outcomes, it is possible to devise countermeasures, improvements to roadway geometry, and traffic control strategies, while minimizing unintended consequences. The results should be of value in the design of educational programs and propose road safety improvement techniques.
Keywords:Crash types, Distraction, Single-vehicle crashes, Two-vehicle crashes, Nested logit model
1 Introduction
Safety is one of the most important characteristics of trans-portation networks. It can be simply defined as arriving at the destination with no injuries and functional loss. A plethora of factors affect crashes and make them intricate, e.g. traffic conditions, road geometry, vehicle specifications, pavement specifications, and drivers’characteristics. Dam-ages caused by crashes have different economic, cultural, environmental, sanitary and psychological aspects. Accord-ing to the WHO reports in 2012, 24% of deaths among the world are caused by road traffic injuries. For people of ages 5 to 49, road crashes are among the four most widespread causes of death in the world, and road traffic injuries are the leading cause of death worldwide among those aged 15–29 years [1].
A work by “Traffic Safety Culture Survey” in 2008
showed that 35% of drivers feel unsafe while driving in
roads, and 31% of them introduce distraction as the most important cause of crashes [2]. Based on a report by Na-tional Highway Traffic Safety Administration, 0.04% of drivers in 2002 allocated their driving time to electronic devices (e.g. texting), while this share increased to 1% in 2008 [2]. It is also worth noting that driver distraction is not just defined as the usage of electronic devices and new technologies during driving, but it is defined as any activ-ity that influences drivers’ vision, hearing capabilities, reflection speed and decision making.
Generally, many scholars have widely discussed the subject of driver distraction. They have investigated the relations between crashes and driver distraction through
many different methods, such as watching driver’s
be-havior while driving, trying driving simulators, analyzing the statistics of crashes, and personally talking to drivers [3–5]. However, the effects of distraction on the crash types have been seldom studied.
Crash type is one of the important features of a collision. Zaloshnja et al. estimated the total cost per crash for
* Correspondence:[email protected]
2Zachry Department of Civil Engineering, 3136 Texas A&M University, College
Station, Texas 77843-3136, USA
Full list of author information is available at the end of the article
© The Author(s). 2018Open AccessThis article is distributed under the terms of the Creative Commons Attribution 4.0
International License (http://creativecommons.org/licenses/by/4.0/), which permits unrestricted use, distribution, and
different types of crashes by considering different aspects like property damage or lost productivity [6]. It is also worth noting that based on Highway Safety Improvement Program (HSIP), analyzing the crash types is put into action to measure the safety of a road [7].
Most of the researchers usually investigate the relations between distraction factors and the occurrence of crashes [8–10], while this work mainly focuses on the influences of driver distraction on crash types. For this purpose, it defines a hypothesis at first and then tests it by the aid of police re-ports about various crashes. Few works have been per-formed to study driver distraction, but this one, though in a limited scope, significantly magnifies and investigates it. Ef-fects of driver distraction on crashes are perused in the presence of other different factors, too. Factors related to drivers’characteristics (e.g. age, gender, physical abilities or health), and other factors such as time of crash, lighting, and weather conditions are discussed. Other important fac-tors are road and vehicle specifications, such as number of lanes, super elevation, slope, curves, vehicle type, and age.
2 Literature review
There are a few studies that analyze different types of crashes by modeling techniques. One of the primary studies in this area was conducted by Khattak et al. [11]. They ex-amined the factors affecting single-vehicle and two-vehicle crashes. They also compared the rear-end crashes with sideswipe crashes in their work. Driving over the speed limit, urban areas, daily traffic volume, peak hours, wet sur-faces, and straight roads with grade were the factors that in-crease the probability of rear-end crashes when compared with sideswipe crashes. On the contrary, male drivers, in-crease of driver’s age, trucks, short age of vehicles, increase of number of lanes, increase of allowed speed limit, frozen surface, and driving on the road with curvature increase the probability of sideswipe crashes [11].
Kim et al. [12] investigated crashes which occurred at rural intersections. The results showed that clear weather increases the probability of angular and sideswipe crashes in the same direction, and decreases the probability of rear-end and sideswipe crashes in the opposite direction. Wet surface conditions increase the probability of side-swipe crashes in the same direction, while the dry surface conditions increase the probability of angular, rear-end, and sideswipe crashes in the opposite direction [12].
In terms of modeling, Bham et al. [13] analyzed
single-vehicle and multivehicle crashes by developing the Multinomial Logit model. They examined various factors affecting the crashes, e.g. light conditions, surface condi-tions, road’s curvature, sloped roads, and time of crashes [13]. Yu et al. conducted a study in 2013 to investigate the effect of weather conditions and road characteristics on three types of crashes that occurred on a mountainous freeway. The crashes included rear-end, sideswipe and
single-vehicle crashes. The developed mixed Logit model revealed that single-vehicle crashes are more probable at
snow season [14]. Romo et al. developed mixed Logit
models in order to explore the factors that lead into three types of crashes. Based on General Estimates System data-base (GES) collected from 2005 to 2008, they found effect-ive vehicular factors and factors related to driving quality among cars and trucks [15].
At the time of this research, Chu conducted the most re-cent study on this subject in 2015. Based on the GES crash database for the crashes, which occurred between 2011 and 2013 in the USA, a mixed random parameter Multinomial Logit model was developed to measure the probability of different crashes. The study analyzes single light vehicle col-lisions and colcol-lisions between two light vehicles. The results show that all of crash types are less likely to occur in in-clement weather and between midnight and 7 AM. Among the roadway characteristics, angular and rear-end crashes are less likely to occur on curved roads. Among driver behaviors, reckless drivers are more likely to experience head-on, angular, and rear-end crashes [16].
It is important to note that this paper focuses on analyz-ing factors instead of frequency of different crash types. The frequencies of different crash types can be used to pre-dict the number of crashes [17–21]; however, this study wants to assess the importance of factors. The factors are chosen based on driver’s characteristics, conditional and en-vironmental properties, vehicles and road characteristics.
Previous studies show that both single-vehicle and multivehicle crashes have not been well investigated yet. The studies usually consider all types of single-ve-hicle crashes as one type of crash, and start to develop models. However, in order to have a broader view, each type of crash should be treated separately in the model for investigating the effect of driver distraction. After-wards, the effect of driver distraction factor between different kind of crashes can be analyzed. It is also worth noting that all of the studies have been per-formed considering the independence of irrelevant al-ternatives (IIA) as an assumption, which is not always true, particularly for both types of sideswipe crashes and different single vehicle crash types. This study then aims to overcome the weakness of previous studies by using developed Nested Logit model and considering eight different crash types.
Cognitive distraction has the major share of crash reasons among the distraction factors [22].
By the authors’ knowledge, there are only three studies focusing on the effect of driver distraction-related factors on different crash types [23–25]. Neyens and Boyle [23] as pioneers in this topic, studied the effect of distraction-re-lated factors on the crash types of teenage drivers [23]. They utilized three main collision types of angular, rear-end, and collision with fixed objects as dependent vari-ables for developing the models. They also considered four main distraction-related factors: distractions due to the presence of passengers, distractions due to the usage of cellphones, cognitive distractions, and distractions due to in-vehicle activities. They developed a Multinomial Logit model to anticipate the probability of each of the three mentioned crash types. The results showed that the prob-ability of rear-end crashes increases when the driver is dis-tracted due to the presence of passengers or usage of cell phone. In-vehicle activities increase the probability of colli-sion with fixed objects in comparison with angular crashes. Cognitive distraction increases angular and rear-end crashes compared with collision with fixed objects [23]. They also utilized the same data to investigate the effect of distraction-related factors on the crash severity [24].
Ghazizadeh and Boyle [26] explored the effects of
distraction-related factors on the probability of crash
types happening in Missouri, considering all drivers’
ages. They analyzed the three collision types of angular, rear-end, and single-vehicle crashes. Distraction-related factors are classified into three groups: distractions re-lated to cell phones, distractions rere-lated to electronic devices, and passenger-related distractions. The results showed that distractions caused by passengers increase the probability of rear-end and angular crashes com-pared with single-vehicle crashes, while distractions caused by electronic devices increase the single-vehicle crashes compared with rear-end and angular crashes. Distraction caused by cell phone usage also increases the probability of angular crashes [26].
As we see, the effect of distraction was studied on a few types of crashes. The implications of considering more types of crashes and more distraction factors help the authorities to have a broader overview on this topic. Therefore, this study tries to fill this gap by con-sidering more type of crashes. In addition, more dis-traction factors are considered for the study. In the following sections, the paper describes methodology, used data, modeling techniques and finally, results and conclusion.
3 Methodology
According to Gumbel distribution for errors in the Nested Logit model, the observation probability function of nest
“i”is defined as:
pni ¼ e
βixniþϕiLSni
X
∀I
eβIxnIþϕILSnI ð1Þ
Where,
Pni= Unconditional probability of crashes for driver “n”in alternative“i”
xni= Vector of measurable characteristics
βi= Vector of estimable coefficients
LSni= Inclusive Value (IV) or logSum which is
calcu-lated from the alternatives“i”in (3).
It should be mentioned thatβcoefficients for alternative
“I,”is calculated by Logit model, based on (1).
pn(j|i)= The probability of crash types “j” for the driver “n” in a situation that the alternative places in nest“i.”Equation (2) defines how it is calculated.
pnð Þ ¼jji e
βjjixnj
X
∀J
βJjixnJ ð
2Þ
LSni ¼Ln
X
∀J
eβJjixnJ
" #
ð3Þ
McFadden interpreted an inclusive value (IV) (the co-efficient of logsum =ϕ) as the following:
1. Ifϕis greater than one, the compatibility with utility
maximization is violated.
2. If it stands between zero and one, it means that increase of utility increases the probability of
choosing the nest and the alternatives inside the nest. It shows that there is an unobserved correlation between the alternatives placed in a nest. 3. If the coefficient of logsum is equal to one, the
Nested Logit model turns into Multinomial Logit model. It should be mentioned that both of these models are from generalized extreme value model
(GEV) [27].
In order to estimate the Nested Logit model, the Full Information Maximum Likelihood (FIML) approach is used.
Lð Þ ¼β YN n¼1
Y
j
Pnj ynj ð4Þ
Where L(β) is the likelihood function. Whenever the
crash type“j”is observed for the driver“n”, ynjis equal to
LLð Þ ¼β XN n¼1
X
J
ynj lnPnj ð5Þ
3.1 Data
This section describes how to extract data to investigate how distraction factors affect crash types. The data for the study is obtained from the General Estimates System database (GES) that is related to crashes occurred annually in the USA in 2010, as a subset of National Automotive Sampling System from more than 5 million police-reported crashes. The fatal crashes, crashes with injury, or with major property damages are included in this dataset. Many scholars have used this data to conduct their research in the field of safety modeling, showing the reasonably reliabil-ity of this data [25,28–31]. Each GES record has a weight that is applied to permit projection to the national crash frequencies. The data includes characteristics of drivers and vehicles, crashes and roads, and environmental properties.
The crash type is defined by the “First Harmful Event” (first damaging producing event) variable at the accident. Crashes generally are categorized into two divisions: single-vehicle and two-vehicle. A single-vehicle crash can be subcategorized into three divisions; run-off-road, colli-sion with fixed objects (e.g. parked vehicles), and collicolli-sion with a pedestrian (or animal). A two-vehicle crash is also subcategorized into five divisions of rear-end crashes, head-on crashes, angular crashes, sideswipe crashes in an oppos-ite direction, and sideswipe crashes in the same direction. The remaining types of crashes are expunged from this study, since they are either unrecognized or scarce. The omitted data is almost 2% of the whole dataset. Thus, eight types of crashes are investigated in this study. It is also worth noting that to elaborate on the distraction factors, in-vehicle activity and cognitive distraction should be dis-cussed. The distractions engendered by the following items are considered as in-vehicle activities: a moving object in the vehicle, adjusting audio or climate controls, using other component/controls integral to vehicle, using or reaching for device/object brought into vehicle, eating or drinking, and smoking related activities. The distraction caused by looking but not seeing accurately, being inattentive and be-ing lost in thought are considered as cognitive distractions. To elaborate on that, The NHTSA report mentions that identification of some driver-related tasks which affect dis-traction has been challenging, within the NHTSA dataset and in dataset that have been reported by police. So, the crashes that are reported to involve distraction without list-ing a specific driver behavior are listed as havlist-ing the source
“other distraction”. Based on the NHTSA, a person can as-sume that some portion of the crashes involves electronic devices [32]. The police officers were reporting distraction by investigating the observers and the people who were in
the vehicle. The author clarifies that this might engender some bias into the study; for instance, police-reported dis-traction might not be 100% accurate. Due to the wide-spread use of this dataset, the author decided to implement it in this study; however, collecting a 100% reliable data re-lated to distraction might not be possible.
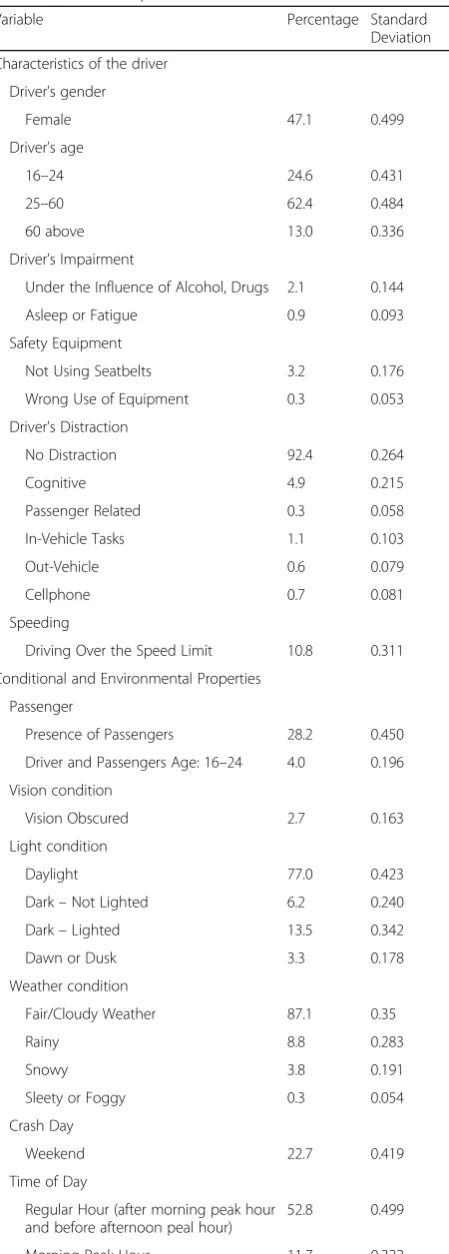
According to the exploited variables, the observations that have missing values are excluded from the study. Sub-sequently, in order to develop a model, a random sample of the weighted data, having no missing value with the approximate sample size of 14,500 (27% of the data), is selected. In the final sample, run-off-road crashes are 11% of the crashes, collisions with fixed objects are 2.3% of the crashes, collision with individuals are 5.1% of the crashes, rear-end crashes are 37.4% of the crashes, head-on crashes are 3.1% of the crashes, angular crashes are 31.4% of the crashes, sideswipe crashes in an oppos-ite direction are 1.2% of the crashes, and the last type of crashes, sideswipe crashes in the same direction are 8.5% of the total crashes. The methodology for selecting a random sample with the lower number of data with-out the changes in the distribution of the variable has been previously reported in the GES data studies [33]. According to the randomization of data, the results of this study can be broadened and applied to society [34, 35]. Table 1 demonstrates the analytical characteristics of the samples.
3.2 Modeling of crash type
In this section, the modeling technique is discussed. According to General Estimates System (GES) data, the crash data are classified into eight different types which were previously illustrated.
In addition to 5 types of distraction-related factors, the independent variables that are employed in the model in-clude driver’s characteristics, environmental conditions, and vehicle’s characteristics. Regarding the available alter-natives, the methodological approach, and the peculiarities of crash’s data, Multinomial Logit has been selected. In order to find the effective variables and the order of add-ing variables in the model, two Multinomial Logit models have been developed. The first model contains four differ-ent crash types; run-off-road crashes, collision with a ped-estrian, collision with an object and two-vehicle crashes. The second models contain six different crash types; rear-end crashes, head-on crashes, angular crashes, side-swipe crashes in the opposite directions, sideside-swipe crashes in the same direction and single-vehicle crashes.
t-test. By considering the goodness of fit and t-test results, we determined the best way to enter the age variable was the interval mode. In the final model, based on the coeffi-cients, all the variables that had no statistical difference with zero have been eliminated in a significant level of 5%. The t values of all the coefficients are greater than 1.96, which means that coefficients of all of the variables are at the 5% significant level.
Developing two discussed models, lead to develop-ment the Multinomial Logit model with eight different crash types. It is also worth noting that one of the major assumptions of Multinomial Logit model is indepen-dencies of alternatives, which may be violated when single-vehicle or two-vehicle crashes are considered. One of the tests to investigate this assumption is devel-oping a Nested Logit model. The models in the study are developed by Nlogit 4 software. If the results of
de-veloped Nested Logit model reveals that ∅is between 0
and 1 and significantly far from them both, then the Multinomial Logit model is found not to be a proper model and coefficients are found inaccurately, conclud-ing that the Nested Logit should be used.
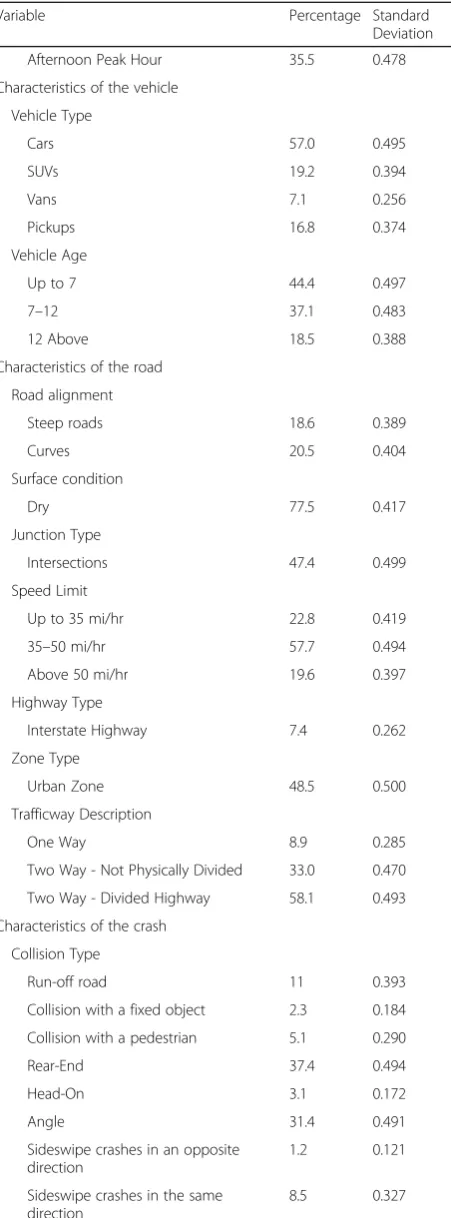
In order to detect the most proper model and test the assumption, the Nested Logit model has been developed. The most challenging issue to develop the mentioned models is to find a suitable structure to place the alterna-tives in the nests. The nest structure should be logical and also lead into developing the best-fitted model through the data. According to the nature of various crashes, a lo-gical structure is found, which is presented in Fig.1.
According to Fig.1a, it is clear that various single-ve-hicle crashes have been located in one nest due to their similar specifications. Two-vehicle crashes all have the same characteristic of involving two vehicles (drivers) in the accident– have also been located in the other nest. In this structure, the sideswipe crashes are also in the same nest on the third level, due to the similarity of their characteristics.
By considering the suggested structure, the Nested Logit model has been developed. The outcomes dem-onstrate that the assumption of the Nested Logit
model is invalidated (∅> 1). Consequently, various
Nested Logit models have been developed. By consid-ering the structural parameter and fitting the model through data, the best-fitted Nested Logit model has
been developed. Figure 1b unveils how the best-fitted
Nested Model is developed for analyzing the data. The proposed structure is similar to the primary structure suggested, except for shifting from two levels to three levels.
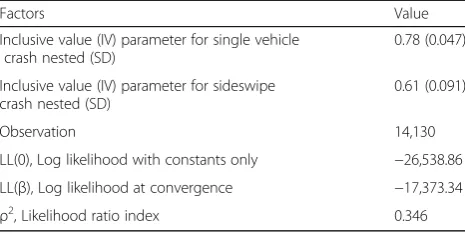
The characteristics of final developed model based on Fig.1b structure, is observed in Table2. The likelihood ratio index is equal to 0.35, which is acceptable. Ac-cording to the first hypothesis, to investigate the
Table 1Data Descriptive
Variable Percentage Standard
Deviation
Characteristics of the driver
Driver’s gender
Female 47.1 0.499
Driver’s age
16–24 24.6 0.431
25–60 62.4 0.484
60 above 13.0 0.336
Driver’s Impairment
Under the Influence of Alcohol, Drugs 2.1 0.144
Asleep or Fatigue 0.9 0.093
Safety Equipment
Not Using Seatbelts 3.2 0.176
Wrong Use of Equipment 0.3 0.053
Driver’s Distraction
No Distraction 92.4 0.264
Cognitive 4.9 0.215
Passenger Related 0.3 0.058
In-Vehicle Tasks 1.1 0.103
Out-Vehicle 0.6 0.079
Cellphone 0.7 0.081
Speeding
Driving Over the Speed Limit 10.8 0.311
Conditional and Environmental Properties
Passenger
Presence of Passengers 28.2 0.450
Driver and Passengers Age: 16–24 4.0 0.196
Vision condition
Vision Obscured 2.7 0.163
Light condition
Daylight 77.0 0.423
Dark–Not Lighted 6.2 0.240
Dark–Lighted 13.5 0.342
Dawn or Dusk 3.3 0.178
Weather condition
Fair/Cloudy Weather 87.1 0.35
Rainy 8.8 0.283
Snowy 3.8 0.191
Sleety or Foggy 0.3 0.054
Crash Day
Weekend 22.7 0.419
Time of Day
Regular Hour (after morning peak hour and before afternoon peal hour)
52.8 0.499
superiority of the Nested Logit model over the Multi-nomial Logit model in this study, the likelihood ratio tests should be conducted [27]:
χ2¼−2 LL β MLM
ð Þ−LL βNLM
ð6Þ
In the aforementioned equation, the LL(βMLM)is the log likelihood at the convergence of the Multinomial Logit model, and LL(βNLM) is the log likelihood at the convergence of the Nested Logit model. The chi-square index is equal to−2[−17,384 + 17,372] =24.
The degrees of freedom for chi-square index is equal to 2, which is calculated as a difference between the number of parameters between the Multinomial Logit and Nested Logit models. Finally, the chi-square index determines that the likelihood ratios of the models are not equal and the Nested Logit model is more interesting than Multi-nomial Logit model (Significant level = 1%). It is also worth noting that the inclusive value for single-vehicle crashes and sideswipe crashes is located in a place be-tween zero and one, which are 0.78 with the standard de-viation of 0.047 for the former and 0.61 with the standard deviation of 0.091 for the latter.
The developed Nested Logit model explains that there is a correlation between the mentioned alternatives. It also demonstrates that the developed nesting structure is appropriate. The results reveal that independency hypothesis between alternatives is revoked, leading into incorrect results by Multinomial Logit model.
4 Results and discussions
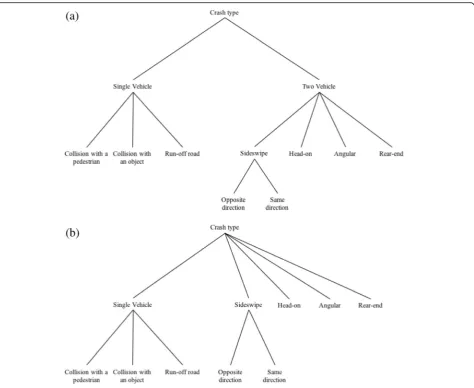
According to the alternatives, eight different utility func-tions have been estimated and assigned to the crash type. In the following table (Table3), the coefficients of the var-iables for each crash type have been presented. The t sta-tistics of all variables are greater than 1.64 with a significance level of 10%; in other words, the coefficients are statistically significant at the level of 0.1. To investigate the multicollinearity between the variables, the variance inflation factor (VIF) is calculated, which is less than 3 for all variables. Kutner et al. [36] suggested a VIF of 5 as the threshold that indicates a presence of serious multicolli-nearity. The results of the study showed that there is no multicollinearity between the variables. It is also worth noting that the coefficients of variables in the utility func-tions are estimated to be the same if there is not any sig-nificant difference between them, and the difference is calculated by t statistics. Table 3 demonstrates the out-comes and the coefficients of the developed model. In the following sections, the results regarding each of the crash types will be discussed.
Table 1Data Descriptive(Continued)
Variable Percentage Standard
Deviation
Afternoon Peak Hour 35.5 0.478
Characteristics of the vehicle
Vehicle Type
Cars 57.0 0.495
SUVs 19.2 0.394
Vans 7.1 0.256
Pickups 16.8 0.374
Vehicle Age
Up to 7 44.4 0.497
7–12 37.1 0.483
12 Above 18.5 0.388
Characteristics of the road
Road alignment
Steep roads 18.6 0.389
Curves 20.5 0.404
Surface condition
Dry 77.5 0.417
Junction Type
Intersections 47.4 0.499
Speed Limit
Up to 35 mi/hr 22.8 0.419
35–50 mi/hr 57.7 0.494
Above 50 mi/hr 19.6 0.397
Highway Type
Interstate Highway 7.4 0.262
Zone Type
Urban Zone 48.5 0.500
Trafficway Description
One Way 8.9 0.285
Two Way - Not Physically Divided 33.0 0.470
Two Way - Divided Highway 58.1 0.493
Characteristics of the crash
Collision Type
Run-off road 11 0.393
Collision with a fixed object 2.3 0.184
Collision with a pedestrian 5.1 0.290
Rear-End 37.4 0.494
Head-On 3.1 0.172
Angle 31.4 0.491
Sideswipe crashes in an opposite direction
1.2 0.121
Sideswipe crashes in the same direction
4.1 Single-vehicle crash
According to the developed Nested Logit model, the sig-nificant variables for each of the crash types and the effect of the variables are investigated, which are provided in Table3. In the following parts, each crash type and signifi-cant factors will be discussed.
4.1.1 Run-off-road
According to the data, the most widespread type of sin-gle vehicle crash is the run-off-road crashes. As Table3 shows, all distraction-related factors have significant and positive effects on this type of crash. The positive signs show that distraction-related factors increase the prob-ability of run-off-road crashes. The authors think that the drivers usually become distracted when there is not any interference with other vehicles. In other words, the absence of another vehicle causes drivers to feel safe, and this feeling facilitates distractions causing drivers to crash. To rationalize the sentence, it can be applied in
cases where there is not any other vehicle by having any influence on the crash.
The results show that being under the influence of alco-hol or drugs increases the probability of this crash type. Difficulties to control the vehicle by drivers who are under the influence of alcohol or drug is highly expected. Thus, they have a higher crash probability in comparison with normal drivers. The drivers who do not fasten the seat-belts are more probable to experience this type of crash.
Safety equipment variable can represent the driver’s
law-breaking risks when not using seatbelts. So, reckless drivers are more probable to experience this type of crash. Driving over the speed limit has been another reason for run-off-road crashes. It increases the occurrence probabil-ity of run-off-road crashes more than all other considered variables. It appears that driving over the speed limit in crowded places heads to collision with another vehicle, though run-off-road crashes happen more often in less crowded areas. It is also worth noting that driving over
the speed limit will diminish the ability to control the ve-hicle, i.e., with any little interference on the road, the driver runs-off-road. Moreover, increasing the speed al-lowance to more than 50 miles per hour has a significant positive effect on the occurrence of this type of crash. The results show that increasing the allowed driving speed in-creases the tendency of driving over the speed limit, which increases the probability of occurrence of this type of crash. In the conditional and environmental situations, rainy or snowy weather conditions have a significant positive ef-fect on the probability of the crashes, proving that inclem-ent weather increases the odds of this crash. In rainy or snowy weather, the vehicles will slip over the route which increases the probability of this crash type.
Roads with curvatures increase the probability of crashes, which is so rational. While in curvatures, the driver changes the direction of the vehicle, and controlling the vehicle becomes more challenging. The results also show that in the vicinity of junctions like intersections, squares or ramps, the odds of encountering this type of crash reduces. These places are most likely crowded with heavy traffic which diminishes the odds of experiencing this type of crash. It can be applied to when in the vicinity of junctions as well.
It is also figured that increasing the number of lanes, re-duces the odds of experiencing this crash. The routes hav-ing fewer lanes, let the driver move off-road easier which reduce his control on the vehicle, so driving on such roads increase the odds of experiencing this crash that seems to be rational.
4.1.2 Collision with an object
Collision with a fixed object or a parked vehicle is in-cluded in this type of crash, which has the characteristics of single-vehicle crashes (i.e. only one vehicle involved in the crash). Results were similar to run-off-road crashes. The positive sign of all distraction-related factors demon-strated, that they increase the probability of experiencing this type of crash. It is also concluded that same as colli-sion with an object, weekends and smooth traffic act as distraction-related factors. The magnitude of the variables’ coefficients reveals that distractions, caused by passengers
and in-vehicle activities, more than all other distractions increase the probability of collision with an object. The re-sults show that many variables affecting this type of crash are similar to those of run-off-road crash.
Conducting a statistical test confirms that the coefficients of passengers’ presence variable and an increase in lane number variable, do not have any significant difference in the utility functions of the aforementioned crash-types. As a result, the coefficient of the variables has been considered equal in model development.
The coefficients of speed limit variables show that the relation between them and occurrence of this crash is U-shaped. Limiting the driving allowance speed to below 35 miles per hour and above 50 miles per hour, increases the probability of this crash occurrence. Usually, the auxil-iary roads have lower allowed driving speed, and there are many more curbed parked vehicles or fixed objects in these places in contrast with the areas with higher allowed driving speed, thus the probability of the crash increases.
4.1.3 Collision with a pedestrian
Among the distraction-related factors, cognitive distraction is the only significant factor that increases the probability of this type of crash. Comparing the results of this crash type with those of the last two can show that cognitive distraction source became significant in all the single vehicle’s crash types. It shows the importance of this distraction source in such crashes. It shows that the probability of engaging in a cognitive distraction can be more in single-vehicle crashes. It can be due to the safe environment that the driver im-agines for himself (due to the low traffic), the other thoughts that comes to his mind, etc. [26].
The presence of passengers and young drivers has re-duced the probability of this type of crash occurring. It seems that young drivers have more flexibility, faster re-sponse, and more powerful maneuverability that let them prevent collisions with pedestrians. It appears that obscur-ing the driver’s vision in bad (lousy) lighting conditions leads to collision with pedestrians. It seems that in this situ-ation, the driver is not able to detect the pedestrians, and hits them.
The shortage of sunlight, e.g., the dark condition with-out light, dark condition with artificial light, or driving at dawn or dusk, raises the occurring probability of this type of crash. It is evident that in these situations, detecting the pedestrian in the driving path is challenging.
The sign of speed limits higher than 50 miles per hour is also positive. In these zones, pedestrians cannot pre-cisely estimate the vehicle’s speed, and drivers also have less control over the vehicle due to their high speed, thus the probability of crashes in high-speed limit zones in-creases. It is figured that in urban areas, the probability of collision with a pedestrian increases due to the presence
Table 2Crash Types Estimation of Nested Logit Model
Factors Value
Inclusive value (IV) parameter for single vehicle crash nested (SD)
0.78 (0.047)
Inclusive value (IV) parameter for sideswipe crash nested (SD)
0.61 (0.091)
Observation 14,130
LL(0), Log likelihood with constants only −26,538.86
LL(β), Log likelihood at convergence −17,373.34
ρ2
of many pedestrians in these places. Increasing the num-ber of lanes has reduced the probability of this crash type. It raises the level of services of the roads, leading to the construction of more underpasses and overpasses for pe-destrians and reducing the probability of their presence in the driving path.
4.2 Two-vehicle crashes
In order to model two-vehicle crashes, each driver acts as a single observation. In the other words, the developed model investigates the engagement probability of each driver in each crash class. To decrease the collinearity of each crash’s observations, the variables related to drivers’ different characteristics and similar conditions of area and crash’s location have been entered to the model. The sup-plemented variables can minimize the dependency be-tween two samples. It is also worth noting that the studied sample considers only two-vehicle crashes that do not have the multicollinearity of adding multi-vehicle crashes.
4.2.1 Rear-end crash
Rear-end crashes are the most common type of two-vehicle collisions. According to the data used in this work, 37.4% of all crashes are rear-end, the highest share of crash percent-ages. All of the distraction-related factors become signifi-cant and increase the probability of rear-end collisions. In recent years, many studies have focused on the effects of distraction factors on driving quality, as well as making the driver’s reaction time longer [3–5,37–39]. The authors be-lieve that drivers’distraction prevents them from braking at the right time, making them collide with the front vehicle. It is also worth mentioning that the driver looks at the road less frequently when he is distracted. This means that whenever the driver does not look ahead, he will hit the backside of the front vehicles if they brake unexpectedly. So, it can be said that the probability of rear-end crashes between two vehicles due to drivers’ distraction increases. Conversely, if the front driver is distracted and brakes late, the driver behind cannot brake at the right time, and the crash might happen. The magnitude of the distraction-re-lated factors’ coefficients show that out-of-vehicle and in-vehicle distractions have the most prominent effects on increasing the probability of rear-end crashes.
The drivers’ age has a different effect on this type of crashes in comparison with single-vehicle ones, such that young and old drivers have been less involved in rear-end crashes. Young drivers react and brake faster, diminishing the probability of this crash type. Although old drivers react slower than young drivers, they are less involved in these crashes. The authors believe that It is because they drive more carefully, adequately distant from the front ve-hicles, and with lower driving speed.
When driving over the speed limit, a longer time is re-quired for braking, and the probability of brakes locking
increases. Driving over the speed limit and its effect on the brakes have increased this type of crash probability.
In the realm of environmental factors, darkness decreases the probability of this crash type. Rear end light are visible at night allowing follower drivers to brake on time when-ever is needed. Furthermore, drivers drive more carefully at nights and keep a safe distance from the front vehicle. It is also worth noting that the developed model shows the same results for the daylight conditions when the front ve-hicle is visible more easily. Rainy or snowy weather has in-creased the probability of this crash. These weather conditions cause the slippage of vehicles on the road sur-face, preventing drivers from braking on time and making them experience a rear-end collision. The magnitude of the coefficients determines that the snowy weather has a higher impact than rainy weather. Cold air in snowy weather, makes the road surface freeze and increases the probability of rear-end crashes.
At intersections or junctions, the probability of this crash type reduces, which is because of driver’s awareness of the conditions and readiness to brake before arriving at these places.
In places with lower speed limits, elapsed time to brake and stop is short, since the vehicle’s speed is low. There-fore, it is rational that the probability of rear-end crashes decreases in this situation. The positive sign of interstate highway variable demonstrates that the probability of rear-end crashes increases there, which is because of higher driving speed.
4.2.2 Head-on crash
Only a small share of all crashes are head-on crashes (3.1% of all crashes), but there are many studies focusing on this type of crash. This attention demonstrates the importance of studying the factors that cause this type of crash. The utility function of this crash type contains fewer significant variables than prior utility functions. Among distraction-re-lated factors, only cellphone usage is significant and increases the probability of head-on crashes. The reason for this is the inability of drivers who use cellphones to control the vehicle from deviations to the left. Because the main reason for these crashes is overtaking in two-way paths, it appears that cellphone-using drivers are less able to control the vehicle and more probable to crash.
The coefficients of two variables related to brightness show that driving in darkness increases the probability of the crash. The following two reasons can explain this re-sult: First, the high-beam headlight at night bothers the opposite direction driver’s vision and makes it difficult for the driver to measure the distance accurately and increases the probability of the crash. Second, driving in darkness causes drowsiness and deviation to the left and increases the probability of a head-on crash.
Driving on road curves increases that probability as well. It can be said that on road’s curves–especially in moun-tainous areas–drivers cannot see the opposite direction well. Also, on road’s curves, maintaining the driving route and controlling the vehicle is more difficult for the drivers, and deviation from route causes a head-on crash.
The probability of a crash is reduced when driving on intersections or junctions. The coefficient of two-way roads variable has a positive sign, showing that the prob-ability of a crash increases in these areas. It should be no-ticed that generally, this type of crash occurs on two-way roads, so the presence of this variable in the model is in-teresting. Further processing of modeling data clarifies that sometimes drivers who are under the influence of al-cohols or drugs, drive in opposite direction on a one-way road. In these situations, the mentioned variable shows the significant effects of two-way roads on head-on crashes rather than one-way roads.
4.2.3 Angular crash
This type of crash is the most widespread crash at the vicinity of intersections. As it was previously mentioned, the probability of other types of crashes occurring at junc-tions or intersecjunc-tions has reduced, whereas it has in-creased for this type of crash. The very simple form of the utility function is because of where this type of crash hap-pens; many variables have a very limited interval of changes and are negligibly useful to explain the crash. The positive sign of a coefficient related to the unfastening seatbelt variable shows that drivers who do not fasten the seatbelts have been more probable to experience an angu-lar crash. These drivers are negligent about the laws and pay less attention to signs and traffic lights. Therefore, they are more probable to have an angular crash, which seems thoroughly plausible. Adverse weather condition also increases the probability of this type of crash, while it shows a decrease on weekends. It is because during week-ends, the passages are less crowded.
4.2.4 Sideswipe crash in opposite direction
This type of crash account for only 1.2% of all crashes and has the smallest share. Among the distraction-related fac-tors, passengers’ distraction has increased the probability of this crash. The positive sign of age variable (for ages be-tween 16 and 24) shows that young drivers are less
probable to involve in this type of crashes. Different vari-ables like being under the influence of alcohols or drugs, driving over the speed limits, darkness without light, rainy or snowy weather, weekends, and high allowed driving speed, increase the probability of this crash type.
The increase of the number of lanes also decreases this crash probability. Highways and freeways usually have more lanes; therefore, the vehicles have enough space for maneuver, the direction of the road is divided, and this crash type is less probable to occur. It is also worth noting that the two-way variable coefficient is positive, showing that the probability of this type of crash increases in these ways. The reason for the entrance of this variable into the model is the same as that of head-on crashes.
4.2.5 Sideswipe crash in same direction
Among the distraction-related factors, cognitive and out-of-vehicle factors increase the probability of this type of crash. Driving over the speed limits also has the same ef-fect. One of the principal reasons why sideswipe crashes occur is the driver’s inability to prevent the vehicle from de-viation. Any small deviation of the steering wheel at high speeds causes transverse displacement of the vehicle, which leads into a sideswipe crash. Obscuring the driver’s vision reduces the probability of this type of crash, since it might force the driver to reduce the speed and avoid obstacles. Snowy weather increases the probability of this type of crash too, which is due to the slippery surface of the road that leads into the deviation of vehicles from their paths.
When passing the road curves, the probability of this type of crash increases, since controlling the vehicle in driving path and keeping the line is more challenging at curves and deviation may cause a sideswipe crash. On the other hand, driving at intersections or junctions and the places with lower posted speed limits decreases the prob-ability of the crashes which is expectable. The probprob-ability of this crash increases when driving on interstate highways where there are more lanes and drivers drive faster. The positive coefficient of urban places variable also shows that the probability of this crash increases in these areas. According to the negative sign of two-way traffic variable, the probability of this type of crash in one-way traffic ways (which have more lanes) increases.
5 Study limitation and future work
might help scholars to consider other important variables which are missed here, such as drowsiness in explaining the run-off-road crashes.
6 Conclusion
In this study, the effect of distraction-related factors, drivers’ characteristics, conditional and environmental properties, and features of cars and roads on the occur-rence of eight different crash types (including three kinds of single-vehicle crashes and five kinds of two-vehicle crashes) were investigated. Considering single-vehicle crashes along with two-vehicle crashes made this study unique. To inves-tigate the aforementioned effects, the Nested Logit model, which has rarely been used in previous studies was devel-oped. By examining how a factor affects multiple crash type outcomes, it is possible to devise countermeasures, im-provements to roadway geometry, and traffic control strat-egies, while minimizing unintended consequences. The results should be of value in the design of educational pro-grams; for example, according to the results of run-off-road crashes, drivers’distraction increases the probability of this type of crash. One of the best ways to reduce this type of crash is to highlight the devastating effects of distraction in safety improvement programs even in uncrowned roads and roads with light traffic. Furthermore, results can help in road safety improvement, for example reducing the brightness of roads increases the probability of run-off-road crashes. Therefore, in addition to increasing the brightness, increasing the number of reflecting traffic signs or pieces of reflector paint at the curbs also help drivers detect the path more accurately. Reduction of brightness also increases the probability of collision with a pedestrian. It is recom-mended that authorities provide an enough lightening equipment at the locations which are used by pedestrians. Also, pedestrians can equip some reflectors stuck to their clothes, letting them be easily detected by drivers at night.
Publisher’s Note
Springer Nature remains neutral with regard to jurisdictional claims in published maps and institutional affiliations.
Author details
1Department of Civil Engineering, Sharif University of Technology, Azadi
Avenue, P.O. Box 11365-8639, Tehran, Iran.2Zachry Department of Civil
Engineering, 3136 Texas A&M University, College Station, Texas 77843-3136, USA.
Received: 10 April 2018 Accepted: 13 September 2018
References
1. WHO (2014) Injuries and violence: the facts 2014 2. NHTSA (2008) Driver Electronic Device Use.184, DOT HS 811
3. Sena P, d’Amore M, Brandimonte MA et al (2016) Experimental framework for simulators to study driver cognitive distraction: brake reaction time in different levels of arousal. Transp Res Procedia 14:4410–4419
4. Haque MM, Washington S (2014) A parametric duration model of the reaction times of drivers distracted by mobile phone conversations. Accid Anal Prev 62:42–53
5. Strayer DL, Cooper JM, Turrill J, et al (2013) Measuring cognitive distraction in the automobile
6. Zaloshnja E, Miller T, Council F, Persaud B (2004) Comprehensive and human capital crash costs by maximum police-reported injury severity within selected crash types. Annu Proc Assoc Adv Automot Med 48:251–263
7. Herbel S, Laing L, McGovern C (2010) Highway Safety Improvement Program (HSIP) manual
8. Seo D-C, Torabi MR (2004) The impact of in-vehicle cell-phone use on accidents or near-accidents among college students. J Am Coll Heal 53:101–108 9. McEvoy SP, Stevenson MR, Woodward M (2006) Phone use and crashes
while driving: a representative survey of drivers in two Australian states. Med J Aust 185:630–634
10. Regan M (2006) Preventing traffic accidents by mobile phone users. Med J Aust 185:628–629
11. Khattak A, Kantor P, Council F (1998) Role of adverse weather in key crash types on limited-access: roadways implications for advanced weather systems. Transp Res Rec J Transp Res Board 1621(1):10–19
12. Kim D-G, Lee Y, Washington S, Choi K (2007) Modeling crash outcome probabilities at rural intersections: application of hierarchical binomial logistic models. Accid Anal Prev 39:125–134
13. Bham GH, Javvadi BS, Manepalli URR (2011) Multinomial logistic regression model for single-vehicle and multivehicle collisions on urban us highways in Arkansas. J Transp Eng 138:786–797
14. Yu R, Abdel-Aty MA, Ahmed MM, Wang X (2013) Crash-type propensity analysis with bayesian models using microscopic traffic and weather data. Transp Res Board 92nd Annu Meet.https://trid.trb.org/view/1240626. 15. Romo A, Hernandez S, Cheu RL (2013) Identifying precrash factors for cars
and trucks on interstate highways: mixed logit model approach. J Transp Eng 140:4013016
16. Chu AA-I (2015) A comprehensive mixed logit analysis of crash type conditional on a crash event. DISS, Doctoral Dissertation
17. Pei X, Sze NN, Wong SC, Yao D (2015) Bootstrap resampling approach to disaggregate analysis of road crashes in Hong Kong. Accid Anal Prev 95:512–520 18. Mothafer GIMA, Yamamoto T, Shankar VN (2016) Evaluating crash type
covariances and roadway geometric marginal effects using the multivariate Poisson gamma mixture model. Anal Methods Accid Res 9:16–26 19. Deng J, Castro M, Bhat CR (2015) A novel approach to modeling and
predicting crash frequency at rural intersections by crash type and injury severity level
20. Jonsson T, Lyon C, Ivan J et al (2009) Differences in the performance of safety performance functions estimated for total crash count and for crash count by crash type. Transp Res Rec 2102:115–123
21. Russo F, Biancardo SA, Busiello M et al (2013) A statistical look at gender and age differences as related to the injury crash type on low-volume roads. WIT Trans Built Environ 134:213–224
22. Campbell BN, Smith JD, Najm WG (2003) Examination of crash contributing factors using national crash databases
23. Neyens DM, Boyle LN (2007) The effect of distractions on the crash types of teenage drivers. Accid Anal Prev 39:206–212
24. Neyens DM, Boyle LN (2008) The influence of driver distraction on the severity of injuries sustained by teenage drivers and their passengers. Accid Anal Prev 40:254–259
25. Razi Ardakani H, Kermanshah M, Zahedi M (2016) Study on the influence of distraction on crash injury severity using partial proportional odds model. Transp Res Board 95th Annu Meet.https://trid.trb.org/view/1394571 26. Ghazizadeh M, Boyle L (2009) Influence of driver distractions on the
likelihood of rear-end, angular, and single-vehicle crashes in Missouri. Transp Res Rec J Transp Res Board 2138:1–5
27. Washington SP, Karlaftis MG, Mannering F (2010) Statistical and econometric methods for transportation data analysis. CRC Press, Routledge
28. Eluru N, Paleti R, Pendyala RM, Bhat CR (2010) Modeling multiple vehicle occupant injury severity:a copula-based multivariate approach. Transp Res Board 8164:1–24
29. Yan X, Harb R, Radwan E (2008) Analyses of factors of crash avoidance maneuvers using the general estimates system. Traffic Inj Prev 9:173–180 30. Xie Y, Zhang Y, Liang F (2009) Crash injury severity analysis using Bayesian
ordered probit models. J Transp Eng 135:18–25
32. National Highway Traffic Safety Administration (NHTSA) D of T (DOT) WD (2012) Visual-manual NHTSA driver distraction guidelines for in-vehicle electronic devices
33. Eluru N, Bhat CR (2007) A joint econometric analysis of seat belt use and crash-related injury severity. Accid Anal Prev 39:1037–1049
34. Manski CF, Lerman SR (1977) The estimation of choice probabilities from choice based samples. Econom J Econom Soc 45(8):1977–1988
35. Cosslett SR (1981) Maximum likelihood estimator for choice-based samples. Econom J Econom Soc 49(5):1289–1316
36. Kutner MH, Neter J, Nachtsheim CJ (2004) Applied linear regression models. McGraw-Hill/Irwin, New York
37. Caird JK, Johnston KA, Willness CR et al (2014) A meta-analysis of the effects of texting on driving. Accid Anal Prev 71:311–318
38. Papantoniou P, Antoniou C, Yannis G et al (2015) P10 how cell phone use affects reaction time of older drivers. J Transp Heal 2:S68–S69