O R I G I N A L P A P E R
Open Access
Developing a user typology considering
unimodal and intermodal mobility
behavior: a cluster analysis approach using
survey data
Rebekka Oostendorp
*, Simon Nieland
and Laura Gebhardt
Abstract
This paper aims to develop a user typology which enables user-specific analyses in respect of mobility behavior. It addresses the challenge of integrating unimodal and intermodal travel behavior into a user typology to obtain an overview of intermodal users within the context of their overall mobility behavior. The user typology is based on two cluster analyses (agglomerative hierarchical clustering) which use quantitative survey data on unimodal and intermodal mobility behavior obtained for Berlin, Germany. One cluster analysis was performed for unimodal use and one for intermodal mode use to take into account the users’ relatively low use of intermodal modes as well. The analyses resulted in 6 intermodal and 5 unimodal clusters based on users’mobility behavior. Since in each case every individual is assigned to one intermodal and one unimodal cluster, the resulting intermodal and unimodal clusters were then combined in order to represent the overall mobility behavior of each individual as mobility types. The mobility types are further characterized by information on socio-demographics and mobility resources obtained from the dataset. These enhanced mobility types (EMT) provide a clearer impression of the users’ characteristics and needs. This user typology takes account of the wide range of mobility options available in cities today and the resulting diversity in people’s mobility behavior. To enable us to address the needs of users who combine several modes of transport within one trip, the proposed procedure approaches the challenge of integrating intermodal behavior into user types. The results provide a user typology which combines intermodal and unimodal travel behavior with personal characteristics and enable researchers and practitioners to work on user-specific research questions and planning tasks.
Keywords:Mobility types, Mobility behavior, Intermodality, User-centered approach, Empirical survey data, Agglomerative hierarchical clustering
1 Introduction: user typology as a way of understanding urban mobility behavior
The mobility behavior of people living in cities varies greatly. Cities offer a wide range of different mobility op-tions and people are confronted with multi-optionality in their everyday lives. In large cities in particular, users can choose from a wide variety of different transport modes, in-cluding a dense public transport network and good condi-tions for walking and cycling [4, 8, 34]. To manage the urban transport system for the benefit of people living in
cities, it is important to gain a comprehensive understand-ing of users’ mobility behavior and their characteristics. Using different forms of grouping procedures, a number of different mobility user typologies have already been devel-oped to make the mobility behavior of highly diverse indi-viduals more applicable and suitable for subsequent analyses [2,17,18,22,33,45,46].
Mobility and mobility behavior in cities is very complex. The wide variety of transport alternatives in addition to the density and mix of uses in urban areas provide a good basis for people to use and combine different modes of transport in their everyday mobility in a flexible, individual and situ-ational way [15,32]. Using different modes over the course
© The Author(s). 2019Open AccessThis article is distributed under the terms of the Creative Commons Attribution 4.0 International License (http://creativecommons.org/licenses/by/4.0/), which permits unrestricted use, distribution, and reproduction in any medium, provided you give appropriate credit to the original author(s) and the source, provide a link to the Creative Commons license, and indicate if changes were made.
* Correspondence:[email protected]
of a week (multimodality) [1,39] or within one trip (inter-modality) accounts for a considerable percentage of the total number of trips undertaken, especially in cities [10,23]. Re-garding trips, we use the term unimodal trip for the use of one transport mode on a single trip for one trip purpose. In contrast, an intermodal trip is characterized by the combin-ation of different transport modes on a single trip for one trip purpose [28]. Intermodal mobility behavior has also been analyzed empirically [23, 41–43, 51]. These studies have shown that the share of intermodal mode choice at the modal split is quite low by comparison with unimodal usage. Nevertheless, the results demonstrate that intermodal com-binations are a relevant option for many people in their everyday mobility portfolio. Furthermore, combining inter-modal and uniinter-modal modes in everyday life, according to different situations and different trip purposes, varies widely. Intermodal mobility behavior and intermodal users therefore merit a differentiated view. There is not merely one univer-sal intermodal user because mobility behavior varies. A typ-ology of users can be helpful for addressing the diversity of intermodal mobility behavior.
Both intermodal and multimodal mobility behavior are discussed as being crucial for a more efficient and sustain-able urban transport system [6,10,29,38]. In this context, it is important to understand the characteristics, background and logic behind this varied mobility behavior from the user’s perspective. We have to look at intermodal and uni-modal use within the overall context of the individual’s mo-bility behavior and we must also take both intermodal and unimodal mode use into account in user typologies to en-able us to understand the mobility behavior exhibited by dif-ferent types of users. Since intermodal trips are less frequent than unimodal trips, typologies based on travel surveys using fixed reference dates often fail to provide information about intermodal mobility behavior. The few existing studies on intermodal users focus mainly on a specific means of transport (e.g. [37] for bike & car-sharing). At present, there is no systematic segmentation of the full range of different intermodal users. This paper aims to provide a user typology that combines intermodal and unimodal mobility behavior in an effort to obtain an overview of intermodal users within the context of their overall mobility behavior.
The common feature of many segmentation approaches established in transport research is that they usually categorize individuals with a certain travel behavior which can then be used to develop user-specific measures. For this purpose, it is necessary to identify segmented typologies with which the behavior of different groups can be under-stood [7]. Today, segmentation approaches [36, 47] are an established means of analyzing daily travel determinants [31, 44,45] and are used by different disciplines such as psych-ology (e.g. [22]), socipsych-ology (e.g. [25]) and also, increasingly, transport sciences (e.g. [17]). Transport providers and muni-cipalities use market segmentation as a basis for targeted
interventions to increase the use of sustainable transport modes [13].There are two methodological arguments which suggest the superiority of typologizing. The epistemological argument is based on the lack of sensitivity in linear analysis concepts to significant cause-effect relationships that are only detectable in subgroups of the total population. The pragmatic argument relates to improving the possibilities for communication between scientists and practitioners by identifying homogeneous groups so as to reduce the com-plexity of heterogeneous populations ([12,22];).
The segmentation approaches and the methods ap-plied (factor, cluster correspondence analysis or qualita-tive typology) differ depending on the research question and the object of investigation. In the field of transport research, segmentation studies have identified groups of people with similar conditions and travel behavior [17,
33] or attitudes [2, 25,26,45]. The work of Kutter [33],
which introduced the concept of behavioral homoge-neous groups, provided significant impetus for working with types that differ significantly from each other due to their socio-demographic characteristics, combined with their practiced mobility behavior. More recent ap-proaches focus more on attitudinal characteristics (e.g.
[2, 25, 45]). Although these psychographic segmentation
approaches reveal an added value for the explanation of behavior, several studies have reinforced the focus on behavior-related characteristics since there are obvious differences in needs and orientations between users with different usage intensities [5,11,21]. Empirical evidence increasingly indicates the existence of higher-level mo-bility orientations that influence all dimensions of an in-dividual’s mobility behavior [26, 48]. Vij et al. [48, 49] emphasize the existence of modality styles, or “ behav-ioral predispositions, characterized by a certain mode or set of modes that an individual habitually uses”([48]: 1). Modality styles such as the innermost component of the concept proposed by Vij et al. [48] are embedded in the larger concept of an individual’s mobility style and, ul-timately, lifestyle ([41,48,49]).
extremely important for detecting differences in travel pat-terns [41]. Our goal is to identify a user typology from the sum of unimodal and intermodal travel behavior. The ob-jective of this paper is to identify different mobility types in a first step and to describe the mobility types identified in more detail according to socio-demographic characteristics in a second step. In this way, it is possible to formulate highly illustrative enhanced mobility types (EMT) (uni-modal and inter(uni-modal behavior, socio-demographic, re-sources, etc.). This provides a better understanding of intermodal mobility behavior from the user’s perspective and can help planners and practitioners to consider the re-quirements of different users and to formulate target-group-specific measures.
We address this issue in our paper and identify a user typology that includes unimodal and intermodal travel be-havior. The user typology draws on a cluster analysis with empirical data from a survey which we conducted in Berlin in 2016. Against this background, the aims of the paper are:
– to develop a user typology which enables user-specific analyses concerning mobility behavior and
– to address the challenge of integrating unimodal and intermodal travel behavior into this user typology to obtain an overview of intermodal users within the context of their overall mobility behavior.
Section 2 below provides an overview of the study de-sign, including the empirical survey data and the meth-odological procedure using principal component analysis (PCA) and cluster analysis. Section 3 presents the results from the PCA and cluster analysis and the resulting mo-bility types. In section 4, we discuss the results in addition to the pros and cons of the methodological pro-cedure. Finally, in section 5 the conclusion sums up the main findings and answers our research questions.
2 Study design and core attributes
The user typology that is presented in this paper is based on empirical survey data. In this section we present the overall methodological procedure and general information about the survey we conducted, we describe the variables consid-ered and explain the procedure of the cluster analyses.
2.1 Methodological overview
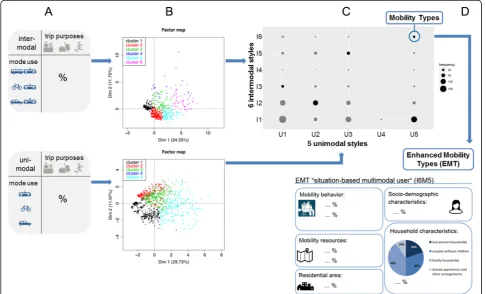
The structure of our user typology follows the relationship of modality styles and mobility styles introduced by Vij et al. [48, 49] (see section 1). We elaborated mobility types which are based purely on the unimodal and intermodal behavior of the users, i.e. on their modality style. In a sec-ond step, these mobility types are further enriched with information about socio-demographic characteristics and the availability of mobility resources, resulting in
en-hanced mobility types (EMT) (see Fig. 1). As a
consequence of this procedure, the grouping of the EMT is congruent with the grouping of the original mobility types, which means that the EMT are classified by mobil-ity behavior alone and are not influenced by other charac-teristics of the users.
In the classification process, many user typologies in-clude socio-demographic characteristics or attitudes in addition to mode use (e.g. [2, 20, 21, 45]). This can be useful in some cases (for example, when marketing to
specific target groups that coincide with
socio-demographic groups) but at the same time it superim-poses the role of mobility behavior as the distinguishing characteristic of the user types. In the survey conducted, certain demographic or social groups have very different mobility behavior and it is therefore possible to generate
either homogeneous socio-demographic groups or
groups that are homogeneous regarding their mobility behavior. In this study, we therefore decided to take into account only the frequency of mode use and trip pur-pose, and not socio-demographic characteristics for the classification. Based on these homogeneous groups in re-spect of mobility behavior (mobility types), socio-demographic characteristics and information on avail-able mobility resources are added to enavail-able us to gener-ate enhanced mobility types (EMT) that give a clearer impression of the users.
The user typology draws on a dataset with 1098 cases taken from a survey which we conducted in Berlin in 2016. The survey contained questions on intermodal and unimodal travel behavior which focused specifically on the user’s perspective. Information was requested on the use of modes and mode combinations together with information on frequency of use and trip purposes. In-formation about age, gender, employment, educational background, income, household composition, and mo-bility resources was also gathered (see Oostendorp and Gebhardt [43] for further information on the survey de-sign and general results).
mobility types (EMT) (step D). Survey data and cluster analyses are described in detail in the following sections.
2.2 Survey data
In the survey, we collected detailed information on uni-modal and interuni-modal travel behavior. The survey distin-guishes the following intermodal combinations: different means of public transport (PT-PT); bike and public trans-port (B-PT); car and public transtrans-port (C-PT); car and bike (C-B); car and bike and public transport (C-B-PT). The unimodal modes surveyed were: public transport (PT), own car (part of household) (C), bike (B), car-sharing car (CS) or other car (e.g. company car) (C-other).
The categories for certain travel modes and respective trip purposes are: (almost) daily; one to three times a week; one to three times a month; less than monthly; never. The trip purposes distinguished are: trips to the workplace or place of education; trips as part of a job; trips for leisure activities; trips for shopping; trips for private errands; trips to escort others; trips for transport-ing goods.
Since this detailed information on travel behavior existed in the dataset, it was necessary to edit variables for the PCA and cluster analyses. To quantify the travel behavior for numerical analysis, the frequency of use was converted from an ordinal scale into actual days per month ((almost) daily = 22; 1–3 x per week = 8; 1–3 x per month = 2; less Fig. 1The concept of enhanced mobility types (EMT) as adapted for the study
than monthly = 0.5; never = 0). This procedure was adopted from Jarass and Scheiner [24] to incorporate realistic fre-quency differences between answers in the survey. After-wards, the frequency was added together over all trip purposes for each intermodal mode combination and for each unimodal usage separately. Similarly, the frequency of all intermodal trip combination and unimodal usage was added together for all purposes. To avoid extreme values for single individuals with highly multimodal or multi-purpose usage, the result was re-categorized into the initial categories ((almost) daily; one to three times a week; one to three times a month; less than monthly; never). In the same way, the frequency was added together across mode combi-nations and re-categorized separately for each trip purpose.
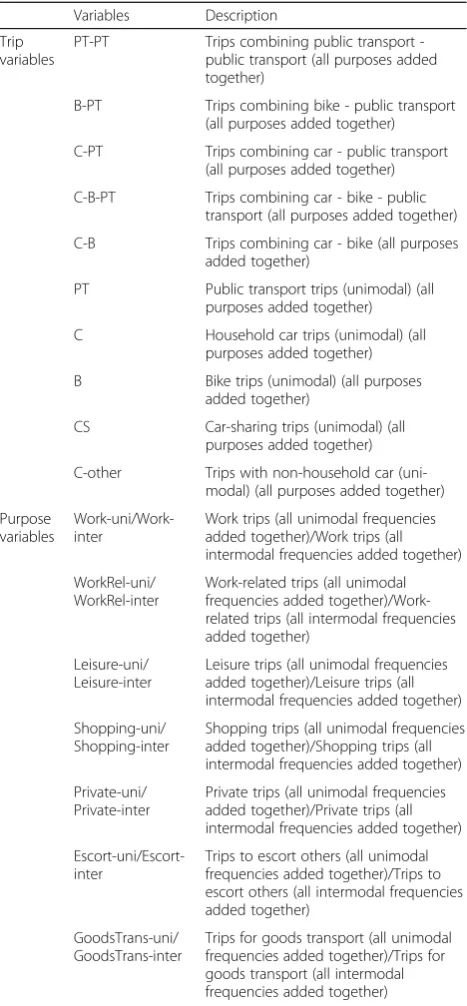
By analogy, data was edited with variables for uni-modal mobility behavior, namely public transport, bike, own car (part of household), car-sharing car, other car (e.g. company car), as well as trip purposes. Table1 pro-vides an overview of all input variables considered in the hierarchical cluster analysis.
2.3 PCA and cluster analysis
A hierarchical cluster analysis based on principal compo-nents was used to derive modality types from the associated trips and trip purposes. The principal component analysis (PCA) is one of the most common and robust procedures for dimensionality reduction of multi-dimensional datasets [27]. It is a technique which uses orthogonal transformation to convert a set of possibly correlated variables into a smaller set of linearly uncorrelated variables while retaining as much information as possible. The procedure aims to find the directions of maximum variance in multi-dimensional datasets and transforms them into a new sub-space. The resulting axes (principal components) can there-fore be described as the directions of maximum variance in the data with the constraint that these axes are orthogonal to each other. PCA can be regarded as a method for separ-ating signal and noise in the dataset. The first components include the essential information of the dataset whereas the last components mainly contain noise. With highly corre-lated data, as in this study, it is advisable to use the first components for a subsequent hierarchical cluster analysis to increase the stability of the clustering outcomes. In this study, components with eigenvalues of over 1 were consid-ered for the clustering. Based on the result of the PCA, a hierarchical agglomerative cluster procedure [35] can be applied to generate actual modality styles. It uses an Euclid-ean distance matrix with Wards-linkage function to aggre-gate single observations to associated clusters [50]. Two different cluster analyses and associated principle compo-nent analyses were performed to make adequate allowance for both intermodal and unimodal mobility behavior. The analysis for unimodal travel behavior uses accumulated fre-quencies of purposes in unimodal trips (PT, C, B) and
accumulated frequencies of unimodal trips conducted for a specific purpose (Work-uni, WorkRel-uni, Leisure-uni, Shopping-uni, Private-uni, Escort-uni, GoodsTrans-uni) (see Table 1). By analogy, the cluster analysis considering intermodal travel behavior uses accumulated frequencies of purposes in intermodal trips (PT-PT, PT, B-PT, B, C-Table 1List of data variables as input for the hierarchical cluster analysis. Each trip variable represents the sum of trips of all purposes with one mode or mode combination. Each purpose variable represents the sum of trips of all modes or mode combinations for one single purpose
Variables Description
Trip variables
PT-PT Trips combining public transport -public transport (all purposes added together)
B-PT Trips combining bike - public transport (all purposes added together)
C-PT Trips combining car - public transport (all purposes added together)
C-B-PT Trips combining car - bike - public transport (all purposes added together)
C-B Trips combining car - bike (all purposes added together)
PT Public transport trips (unimodal) (all purposes added together)
C Household car trips (unimodal) (all purposes added together)
B Bike trips (unimodal) (all purposes added together)
CS Car-sharing trips (unimodal) (all purposes added together)
C-other Trips with non-household car (uni-modal) (all purposes added together)
Purpose variables
Work-uni/Work-inter
Work trips (all unimodal frequencies added together)/Work trips (all intermodal frequencies added together)
WorkRel-uni/ WorkRel-inter
Work-related trips (all unimodal frequencies added together)/Work-related trips (all intermodal frequencies added together)
Leisure-uni/ Leisure-inter
Leisure trips (all unimodal frequencies added together)/Leisure trips (all intermodal frequencies added together)
Shopping-uni/ Shopping-inter
Shopping trips (all unimodal frequencies added together)/Shopping trips (all intermodal frequencies added together)
Private-uni/ Private-inter
Private trips (all unimodal frequencies added together)/Private trips (all intermodal frequencies added together)
Escort-uni/Escort-inter
Trips to escort others (all unimodal frequencies added together)/Trips to escort others (all intermodal frequencies added together)
GoodsTrans-uni/ GoodsTrans-inter
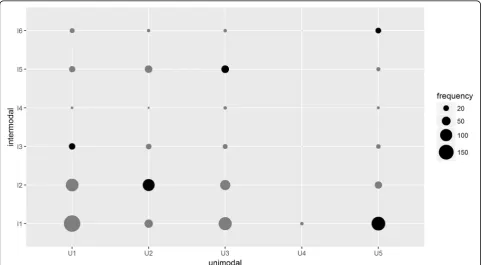
B-PT) and accumulated frequencies of intermodal trips conducted for a specific purpose (Work-inter, WorkRel-inter, Leisure-WorkRel-inter, Shopping-WorkRel-inter, Private-WorkRel-inter, Escort-inter, GoodsTrans-inter). Each individual interviewed there-fore belongs to one unimodal and one intermodal cluster. Thus, the two clustering results were combined based on the respective individuals, leading to groups of people with a specific combination of unimodal and intermodal behav-ior, called modality types (see Fig.3).
3 Results
This section illustrates the results of the applied meth-odology. This includes the outcomes of the clustering approaches (the intermodal and unimodal styles) and the subsequent combination of the resulting clusters (mobility types) as well as a detailed description of the enhanced mobility types (EMT) derived.
3.1 Cluster analyses
3.1.1 Intermodal
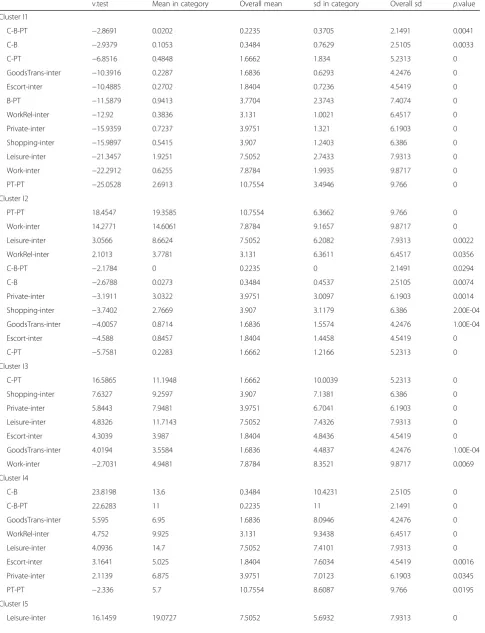
Table 5 (Appendix) shows the variable contribution to the respective clustering results. In total, the cluster analysis re-lates to 1065 cases and results in 6 clusters (intermodal styles). It is important to keep in mind that this cluster ana-lysis is only based on intermodal trips and therefore does not consider unimodal behavior. The combination of inter-modal and uniinter-modal behavioral aspects is described in sec-tion 3.2. Cluster 1 of the analysis with intermodal variables
is therefore negatively influenced by all contributing param-eters. This applies to all intermodal trip combinations as well as all trip purposes. It therefore represents individuals who do not have significant intermodal travel behavior and accounts for 46.4%. Cluster 2 includes positive contribu-tions arising from the sum of PT-PT trips, trips to work, leisure trips and trips with a work-related purpose, while PT-PT trips and work trips are by far the most influential positive parameters in this cluster. Trips with B-PT, C-PT and C-B as well as trips with private, shopping, escort and transport purposes have a negative contribution to this cluster. It therefore includes observations with mainly inter-modal work trips using the combination PT-PT. Nearly one third (29.2%) of participants belong to this cluster. Cluster 3 includes a positive contribution from trips with C-PT, shopping trips, leisure trips, and trips for escorting others or transportation of goods, while there is a strong tendency towards trips with C-PT and a slightly negative in-fluence of work trips. This cluster can therefore be de-scribed as the C-PT-combiner with a coverage of 7.2%. The main positive contributions to cluster 4 are trips carried out by C-B and C-B-PT, whereas trips with PT-PT have a slightly negative contribution. In this cluster, all trip pur-poses are moderately positive. This cluster is very small, ac-counting for 1.9%. Cluster 5 includes only positive contributions with B-PT and PT-PT trips in combination with all purposes. This includes leisure and work trips as well as trips with escort, shopping or private purposes. This
class can therefore be regarded as the B-PT-combiner. This cluster accounts for 10.3%. Cluster 6 is defined mainly by trips with goods transportation or escort purposes, shop-ping and private trips, while the trip is conducted by C-PT, PT-PT or B-PT. This means that people in this cluster are multimodal and intermodal at the same time, accounting for 5.0% of the participants. Like cluster 5, cluster 6 has no negatively contributing variables.
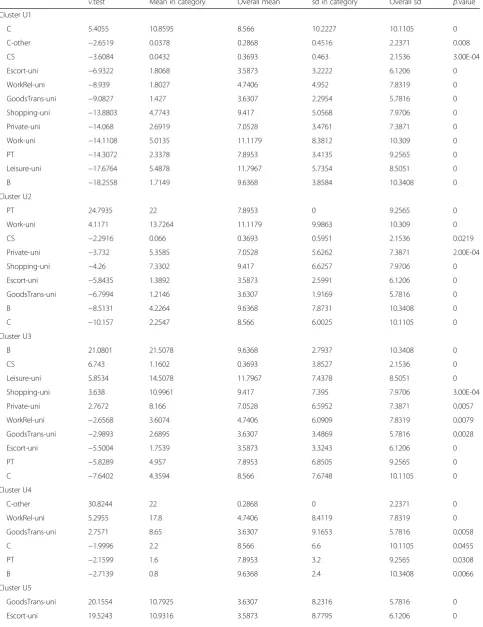
3.1.2 Unimodal
Table 6 (Appendix) shows the variable contribution to the respective unimodal clustering results. The cluster analysis is based on 1060 cases and results in 5 clusters (unimodal styles). Cluster 1 is influenced mainly by trips with a house-hold car, while having an overall low frequency of trips. It is the largest cluster at 34.9%. The main contributing variables to cluster 2 are trips with PT (one mode only) and work purpose. Household car usage and bike usage have a strong negative contribution to this cluster, whereas trip purposes like the transportation of goods or shopping and car-sharing trips have a moderately negative contribution. This class can therefore be seen as the unimodal commuter by PT. A 20.0% share of the participants belong to this cluster. Cluster 3 includes strong positive contributions from trips by bike and a moderately positive contribution from car-sharing combined with leisure, shopping and private pur-poses. Negatively contributing variables are household car and PT usage combined with escort, goods transport and work-related trips. This cluster is quite large at 24.2%. Clus-ter 4 has a strong contribution of trips with other (non-household) cars (this may be a company car or a rental car for example) combined with goods transport trips and work-related trips. This means people in this class use cars mostly for work purposes or rent a car. This only accounts for a very small group of people (0.9%). Cluster 5 is charac-terized by the strong positive contribution of all trip pur-poses. With regard to transport modes, cluster 5 is influenced by trips by car and by bike but has no negatively contributing variables. It therefore represents highly mobile multimodal users with an incidence of 20.0% in the dataset.
3.2 Combination of intermodal and unimodal cluster analyses
A broad range of different user types were identified based on the clustering of unimodal and intermodal trip frequen-cies. The analyses resulted in six intermodal and five uni-modal clusters based on users’ mobility behavior. As a result of the two separate cluster analyses, each individual in the dataset with full information (n= 1041) belongs to one intermodal style and one unimodal style, respectively. Combining the intermodal and unimodal style per individ-ual results in a differentiated picture of mobility types and allows us to represent the overall mode use of each user.
The objective of the differentiated segmentation approach is not to consider each of the theoretically resulting thirty combinations as a relevant group that deserves a more thorough investigation. Rather, it is about providing a range of differentiated mobility types, which in classic approaches are often subsumed under the main modes of transport. The numbers of cases (see Fig. 3) show that some types only occur to a very small extent in the sample and, hence, do not seem to represent a relevant mobility behavior. Still, some combinations have a relevant quantity and seem to be suited for further exploration. For example, 13 out of the possible 30 combinations have a quantity of 20 cases or more in our dataset. As an advantage of this approach, one can select the most appropriate types from this spectrum according to a specific question or aggregate two or more types if necessary. For example, practitioners may be ested in individuals with a specific unimodal and inter-modal behavior, e.g. individuals combining bike and public transport on trips to work and using the bike for leisure and shopping trips. Based on this kind of considerations, they can select the most suitable combination(s) out of the whole range. Furthermore, in case of a special interest in ei-ther unimodal or intermodal mode use, this procedure al-lows to use the mobility types from step B. Figure3shows a brief overview of how many cases can be ascribed to each of the combinations. According to the share of intermodal and unimodal clusters in the dataset (see section 3.1.1 and 3.1.2), combinations with clusters I1 or I2 and U1 or U3 are the largest groups.
certain amount of intermodal mobility behavior, whereas one user type, namely the all-purpose car-user (I1U5), is used as a predominantly unimodal ref-erence case. The selected combinations are: the all-purpose car-user (I1U5), the public transport user (I2U2), the intermodal car and public transport user (I3U1), the intermodal bike and public transport user (I5U3), and the multimodal user (I6U5) (see selected
user types in Fig. 3). However, it should be noted,
that other types could be selected and investigated in further detail according to a specific topical question from science or practice, as the information basis is available for all types.
3.3 Description of socio-demographics and mobility resources of selected user types
In this paper, five of the mobility types and their specific characteristics are outlined, by way of example, to show
the broad range of different intermodal and unimodal mo-bility behavior (see section 3.2). Having been enhanced by socio-demographic characteristics and mobility resources, at this point we speak about enhanced mobility types (EMT) (see section 2.1). The detailed description of mo-bility behavior (as a result of the cluster analyses) as well as socio-demographic characteristics and information about the available mobility resources enable us to obtain a comprehensive picture of the enhanced mobility types.
As the generation process was based on the cluster analyses, it was expected that the resulting EMT would be clearly differentiable in terms of mobility behavior. This is the case for all the types generated, and there are clearly identifiable differences even for some socio-demographic characteristics and mobility resources (see Table2, Figs.4,5, and6).
When looking at the age structure of the EMT generated, several observations can be made (see Fig.4). Firstly, there
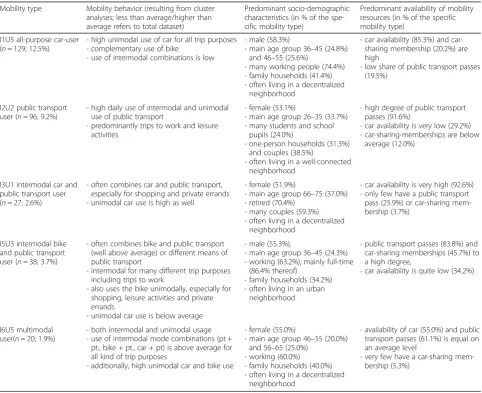
Table 2Selected enhanced mobility types (EMT), their mobility behavior (combination of mode use and trip purpose), predominant socio-demographic characteristics and predominant availability of mobility resources
Mobility type Mobility behavior (resulting from cluster analyses; less than average/higher than average refers to total dataset)
Predominant socio-demographic characteristics (in % of the spe-cific mobility type)
Predominant availability of mobility resources (in % of the specific mobility type)
I1U5 all-purpose car-user (n= 129; 12.5%)
- high unimodal use of car for all trip purposes - complementary use of bike
- use of intermodal combinations is low
- male (58.3%)
- main age group 36–45 (24.8%) and 46–55 (25.6%)
- many working people (74.4%) - family households (41.4%) - often living in a decentralized
neighborhood
- car availability (85.3%) and car-sharing membership (20.2%) are high
- low share of public transport passes (19.5%)
I2U2 public transport user (n= 96; 9.2%)
- high daily use of intermodal and unimodal use of public transport
- predominantly trips to work and leisure activities
- female (53.1%)
- main age group 26–35 (33.7%) - many students and school
pupils (24.0%)
- one-person households (31.3%) and couples (38.5%)
- often living in a well-connected neighborhood
- high degree of public transport passes (91.6%)
- car availability is very low (29.2%) - car-sharing-memberships are below
average (12.0%)
I3U1 intermodal car and public transport user (n= 27; 2.6%)
- often combines car and public transport, especially for shopping and private errands - unimodal car use is high as well
- female (51.9%)
- main age group 66–75 (37.0%) - retired (70.4%)
- many couples (59.3%) - often living in a decentralized
neighborhood
- car availability is very high (92.6%) - only few have a public transport
pass (25.9%) or car-sharing mem-bership (3.7%)
I5U3 intermodal bike and public transport user (n= 38; 3.7%)
- often combines bike and public transport (well above average) or different means of public transport
- intermodal for many different trip purposes including trips to work
- also uses the bike unimodally, especially for shopping, leisure activities and private errands
- unimodal car use is below average
- male (55.3%),
- main age group 36–45 (24.3%) - working (63.2%), mainly full-time
(86.4% thereof)
- family households (34.2%) - often living in an urban
neighborhood
- public transport passes (83.8%) and car-sharing memberships (45.7%) to a high degree,
- car availability is quite low (34.2%)
I6U5 multimodal user(n= 20; 1.9%)
- both intermodal and unimodal usage - use of intermodal mode combinations (pt +
pt., bike + pt., car + pt) is above average for all kind of trip purposes
- additionally, high unimodal car and bike use
- female (55.0%)
- main age group 46–55 (20.0%) and 56–65 (25.0%)
- working (60.0%) - family households (40.0%) - often living in a decentralized
neighborhood
- availability of car (55.0%) and public transport passes (61.1%) is equal on an average level
are high percentages of younger people in the public trans-port user type (I2U2). Secondly, we can see a peak in middle-aged (working) people for the intermodal bike and public transport user (I5U3), the multimodal user (I6U5), and the all-purpose car-user (I1U5). And, thirdly, the inter-modal car and public transport user (I3U1) shows a high share of elderly people.
Although the household size differs slightly, some in-teresting observations can be made (see Fig. 5). Couple households are particularly high in the mobility type for the intermodal car and public transport user (I3U1), while family households have the highest percentages in the all-purpose car-user (I1U5) (41.4%) and the multi-modal user (I6U5) (40.0%). Single households have mod-erate percentages in all the types observed, ranging from 19.5% (for I1U5) to 31.3% (for I2U2).
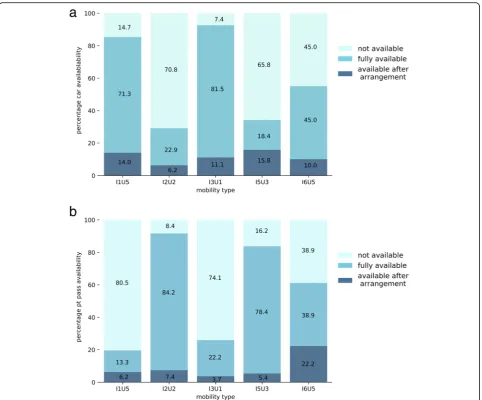
When looking at the available mobility resources (see Fig. 6a), it is not surprising that mobility types related to car use (the all-purpose car-user (I1U5) and the intermodal car and public transport user (I3U1)) have a high degree of car availability. Conversely, the public transport user (I2U2) and the intermodal bike and public transport user (I5U3) mostly have no car available, while in the multimodal user group (I6U5) car availability is balanced.
Looking at the availability of public transport season passes, we see the reverse (see Fig. 6b). EMT with a high share of intermodal behavior (mainly the public transport user (I2U2) and the intermodal bike and public transport user (I5U3) (84.2%/78.4%)) have public transport passes available, whereas mobility types with the involvement of a private car (usually the all-purpose car-user (I1U5) and the intermodal car and public transport user (I3U1) (80.5%/ 74.1%)) do not have public transport passes available. Again, as with car availability, the multimodal user (I6U5) shows variation in the availability of public transport passes. Apart from the multimodal users (I6U5) (22.5%), the share of public transport passes is very low in each of the EMT generated, ranging from 3.7% to 7.4%.
It should be noted that the all-purpose car-user is char-acterized by high car availability and high percentage of males whereas the public transport user accompanied by a high degree of public transport passes is rather female. These observed gender differences regarding use and availability of car and public transport are in line with re-sults from the Germany-wide household survey“Mobility in Germany” [4, 40] as well as empirical studies from Germany and other countries [3,9,19].
Furthermore, the regarded EMT show differences in the predominant places of residence. EMT with a high proportion of car-use (I1U5 and I3U1) often live in decentralized neighborhoods whereas the public trans-port user (I2U2) lives in well-connected neighborhoods and the intermodal bike and public transport user (I5U3) in urban neighborhoods. This corresponds to
results from studies from Germany and other countries which discuss the correlation between land use and mode use (see Buehler [4] for a literature overview).
4 Discussion
The procedure presented uses a two-step clustering ap-proach to identify a wide range of user groups in respect of everyday mobility behavior with a special focus on inter-modality. The results demonstrate that this methodology is suitable for including important behavioral aspects with low usage frequency in user types without losing an overall picture of travel behavior. This facilitates the ability to focus on forms of transportation that are not yet fully accepted. This was demonstrated for the topic of intermodality but can also be used for other forms of upcoming transport provision or changes in travel behavior, such as car-sharing or ride-sharing.
Within the resulting typology of user groups, each user is matched to one unimodal and one intermodal style which can be refined into a comprehensive en-hanced mobility type (EMT) including all aspects of travel behavior (unimodal and intermodal), available mobility resources and socio-demographic characteris-tics. At the same time, the approach enables us to take a differentiated look at selected user types ac-cording to a specific research question and therefore forms a valuable basis for developing target-group-specific actions in urban and transport planning. Al-ternatively, certain user types can be combined to generate more aggregated target classes (e.g. the ini-tial intermodal users and unimodal users or all users with a certain amount of car use), if needed. As a re-sult, the mobility types are based on the user’s actual mobility behavior rather than on one means of trans-port alone or on socio-demographic characteristics. In contrast, existing mobility typologies often mix mobil-ity behavior with socio-demographic characteristics or values and opinions in the classification process, in order to create predefined target-specific user groups
[12, 22]. This leads to homogeneous population groups
level of detail of each mobility type and the resulting large number of different mobility types may also be a limitation as it involves a more complex handling and makes applica-tion more challenging.
As a consequence of this methodological procedure, the most suitable mobility types can be selected and fur-ther investigated depending on a specific question from science or practice. Since intermodal usage of different
modes of transport can be seen as a promising alterna-tive to unimodal car usage (I1U5) [10], the three groups with a high proportion of intermodal behavior (I3U1, I5U3 and I6U5) are selected as an example and are fur-ther discussed in this section to show the practical value of this work. By understanding which kind of individuals are using intermodal combinations in which situations, these groups can be specifically addressed for further Fig. 4Univariate distributions of age of individuals (bin size; 7) in each cluster illustrated using kernel density estimation (KDE). I1U5: all-purpose car-user, I2U2: public transport user, I3U1: intermodal car and public transport user, I5U3: intermodal bike and public transport user, I6U5: multimodal user
usages. For instance, we are able to determine that people who combine car and public transport (I3U1) are mostly retired, living in couple households or alone, in decentralized neighborhoods and are mostly part of higher age groups. This is very valuable information when planning and designing infrastructure for intermodal inter-changes [14,16] as it is possible to provide features that are adapted to the specific needs of the corresponding user group. In contrast, the group of people who combine bike and public transport (I5U3) are younger (mostly between 20 and 45), working full-time, living in urban environments and are often part of family households. In addition to com-bining bike and public transport, this group has below aver-age intermodal car usaver-age and often uses the bike unimodally for non-work purposes, which means they are already using intermodal and unimodal provision. This
particularly considered and involved in the planning process to meet their requirements and needs. The same applies to multimodal users (I6U5), as they have similar characteristics to the intermodal bike and public transport user (I5U3) but live in more decentralized neighborhoods.
Subsequent qualitative analyses (interviews, work-shops) show that the EMT match up very well, not
only with the users’ mobility behavior but also the
type of person. Specific user types can therefore be asked explicitly about their preferences with regard to the provision of public transport, infrastructure or even innovative vehicle concepts. The latter has been successfully demonstrated in interdisciplinary collab-oration for the creation of user-oriented vehicle con-cepts [30].
In addition, integrating the purposes of trips in the methodological procedure, as with Vij et al. [49], consti-tutes a distinctive characteristic in the user typology pre-sented. The mobility behavior of an individual can vary and be specific to certain situations, especially in an urban context where there are many different options. Allowance is made for this by differentiating the mobility behavior according to trip purposes. Looking at trip pur-poses may also help to transfer the EMT identified to specific real-life situations so that planning can address these needs. People who are intermodal in certain situa-tions have a good chance of combining several modes of transport also for other trip purposes since they already have the necessary resources available. For example, in-dividuals who regularly combine bike and public trans-port on their trip to work are likely to have both a public transport pass and a bicycle at their disposal. Thus, they already have the basic requirement to com-bine these means of transport also for other trip pur-poses. Campaigns that aim to motivate intermodal mode use for different trip purposes are likely to be particu-larly successful in these groups and should therefore be tailored to these.
The typology has another significant advantage in that it is empirically based on more than 1000 cases, enabling us to pursue this differentiated approach and also identify user groups that are less well repre-sented. The empirical database needs to have a rela-tively large sample size in order to achieve a robust sample for the single user types. However, this is at the same time a limitation of the methodological pro-cedure presented and its transferability, since the use of other datasets for this approach requires a certain number of cases and the differentiated query of mo-bility behavior. As a result, not every dataset can be processed with this approach to gain this kind of mo-bility types. Generating user types applicable to ques-tions on intermodal travel behavior required an elaborate methodological procedure comprising two
different cluster analyses with variables on intermodal and unimodal mode use and different trip purposes. At the same time, the resulting EMT presented in
Table 2 have clearly defined and convincing
charac-ters that incorporate the complex findings in a com-prehensive and straightforward manner.
5 Conclusion and outlook
This study provides a user typology that facilitates user-specific analyses of comprehensive mobility be-havior with a special focus on integrating intermodal behavior. It combines intermodal and unimodal travel behavior with personal characteristics
(socio-demo-graphic characteristics and available mobility
re-sources) and allows us to work on user specific research questions. In addition to the traditionally fo-cused unimodal travel behavior, the proposed en-hanced mobility types (EMT) provide an overview of the spectrum of intermodal user behavior which has not previously been part of any existing user typology. In this paper, we have outlined five different EMT as an example.
These EMT are the starting point for a number of further research questions. For example, information about selected user types will be further summarized and presented illustratively by creating short profiles and idealized example users. These are useful for pre-senting a clear yet simplified image and for translat-ing the complex results into practice and ustranslat-ing them in interdisciplinary collaborations. Further analyses of the conducted qualitative interviews with representa-tives of the selected user types will help to further specify the reasons and requirements for mode choice. This will enable us not only to describe but also understand intermodal mobility behavior within the context of the user’s overall mobility behavior. This will involve analyzing different user perspectives in respect of interchanges, interchange behavior and preferences for intermodal mode use, and will also in-volve transferring the findings into practice.
Another important issue, not dealt with as yet, is the transferability of the mobility types and the ques-tion as to whether the mobility types identified can also be found in other cities. We see the possibility of assigning individuals to a mobility type by adding up
their individual socio-demographic characteristics.
Appendix
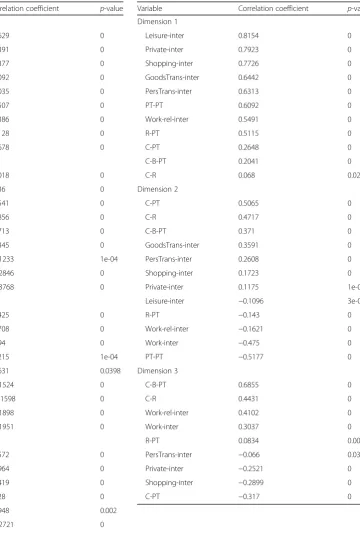
Table 3Result of the PCA of unimodal variables. Correlation coefficients describe the correlation between variable and corresponding dimension
Variable Correlation coefficient p-value
Dimension 1
Private-uni 0.7629 0
Leisure-uni 0.7391 0
Shopping-uni 0.7377 0
GoodsTrans-uni 0.7092 0
PersTrans-uni 0.6035 0
WorkRel-uni 0.5507 0
R 0.5386 0
Work-uni 0.5128 0
C 0.3678 0
Dimension 2
PT 0.6018 0
R 0.436 0
Leisure-uni 0.2541 0
CS 0.1856 0
Work-uni 0.1713 0
Private-uni 0.1345 0
C_other −0.1233 1e-04
GoodsTrans-uni −0.2846 0
PersTrans-uni −0.3768 0
Dimension 3
C_other 0.6425 0
WorkRel-uni 0.5708 0
Work-uni 0.494 0
PT 0.1215 1e-04
GoodsTrans-uni 0.0631 0.0398
C −0.1524 0
Leisure-uni −0.1598 0
R −0.1898 0
Private-uni −0.1951 0
Dimension 4
PT 0.6572 0
C 0.1964 0
PersTrans-uni 0.1419 0
Work-uni 0.128 0
Leisure-uni 0.0948 0.002
C_other −0.2721 0
R −0.4492 0
CS −0.4846 0
Table 4Result of the PCA of intermodal variables. Correlation coefficients describe the correlation between variable and corresponding dimension
Variable Correlation coefficient p-value
Dimension 1
Leisure-inter 0.8154 0
Private-inter 0.7923 0
Shopping-inter 0.7726 0
GoodsTrans-inter 0.6442 0
PersTrans-inter 0.6313 0
PT-PT 0.6092 0
Work-rel-inter 0.5491 0
R-PT 0.5115 0
C-PT 0.2648 0
C-B-PT 0.2041 0
C-R 0.068 0.0264
Dimension 2
C-PT 0.5065 0
C-R 0.4717 0
C-B-PT 0.371 0
GoodsTrans-inter 0.3591 0
PersTrans-inter 0.2608 0
Shopping-inter 0.1723 0
Private-inter 0.1175 1e-04
Leisure-inter −0.1096 3e-04
R-PT −0.143 0
Work-rel-inter −0.1621 0
Work-inter −0.475 0
PT-PT −0.5177 0
Dimension 3
C-B-PT 0.6855 0
C-R 0.4431 0
Work-rel-inter 0.4102 0
Work-inter 0.3037 0
R-PT 0.0834 0.0065
PersTrans-inter −0.066 0.0311
Private-inter −0.2521 0
Shopping-inter −0.2899 0
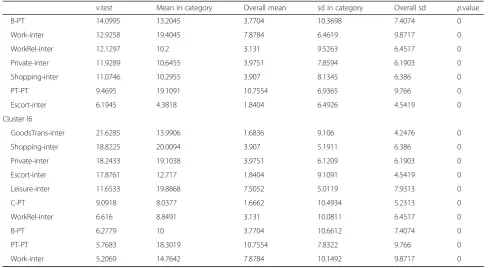
Table 5Variable contribution of intermodal clustering (n= 1.065)
v.test Mean in category Overall mean sd in category Overall sd p.value
Cluster I1
C-B-PT −2.8691 0.0202 0.2235 0.3705 2.1491 0.0041
C-B −2.9379 0.1053 0.3484 0.7629 2.5105 0.0033
C-PT −6.8516 0.4848 1.6662 1.834 5.2313 0
GoodsTrans-inter −10.3916 0.2287 1.6836 0.6293 4.2476 0
Escort-inter −10.4885 0.2702 1.8404 0.7236 4.5419 0
B-PT −11.5879 0.9413 3.7704 2.3743 7.4074 0
WorkRel-inter −12.92 0.3836 3.131 1.0021 6.4517 0
Private-inter −15.9359 0.7237 3.9751 1.321 6.1903 0
Shopping-inter −15.9897 0.5415 3.907 1.2403 6.386 0
Leisure-inter −21.3457 1.9251 7.5052 2.7433 7.9313 0
Work-inter −22.2912 0.6255 7.8784 1.9935 9.8717 0
PT-PT −25.0528 2.6913 10.7554 3.4946 9.766 0
Cluster I2
PT-PT 18.4547 19.3585 10.7554 6.3662 9.766 0
Work-inter 14.2771 14.6061 7.8784 9.1657 9.8717 0
Leisure-inter 3.0566 8.6624 7.5052 6.2082 7.9313 0.0022
WorkRel-inter 2.1013 3.7781 3.131 6.3611 6.4517 0.0356
C-B-PT −2.1784 0 0.2235 0 2.1491 0.0294
C-B −2.6788 0.0273 0.3484 0.4537 2.5105 0.0074
Private-inter −3.1911 3.0322 3.9751 3.0097 6.1903 0.0014
Shopping-inter −3.7402 2.7669 3.907 3.1179 6.386 2.00E-04
GoodsTrans-inter −4.0057 0.8714 1.6836 1.5574 4.2476 1.00E-04
Escort-inter −4.588 0.8457 1.8404 1.4458 4.5419 0
C-PT −5.7581 0.2283 1.6662 1.2166 5.2313 0
Cluster I3
C-PT 16.5865 11.1948 1.6662 10.0039 5.2313 0
Shopping-inter 7.6327 9.2597 3.907 7.1381 6.386 0
Private-inter 5.8443 7.9481 3.9751 6.7041 6.1903 0
Leisure-inter 4.8326 11.7143 7.5052 7.4326 7.9313 0
Escort-inter 4.3039 3.987 1.8404 4.8436 4.5419 0
GoodsTrans-inter 4.0194 3.5584 1.6836 4.4837 4.2476 1.00E-04
Work-inter −2.7031 4.9481 7.8784 8.3521 9.8717 0.0069
Cluster I4
C-B 23.8198 13.6 0.3484 10.4231 2.5105 0
C-B-PT 22.6283 11 0.2235 11 2.1491 0
GoodsTrans-inter 5.595 6.95 1.6836 8.0946 4.2476 0
WorkRel-inter 4.752 9.925 3.131 9.3438 6.4517 0
Leisure-inter 4.0936 14.7 7.5052 7.4101 7.9313 0
Escort-inter 3.1641 5.025 1.8404 7.6034 4.5419 0.0016
Private-inter 2.1139 6.875 3.9751 7.0123 6.1903 0.0345
PT-PT −2.336 5.7 10.7554 8.6087 9.766 0.0195
Cluster I5
Table 5Variable contribution of intermodal clustering (n= 1.065)(Continued)
v.test Mean in category Overall mean sd in category Overall sd p.value
B-PT 14.0995 13.2045 3.7704 10.3698 7.4074 0
Work-inter 12.9258 19.4045 7.8784 6.4619 9.8717 0
WorkRel-inter 12.1297 10.2 3.131 9.5263 6.4517 0
Private-inter 11.9289 10.6455 3.9751 7.8594 6.1903 0
Shopping-inter 11.0746 10.2955 3.907 8.1345 6.386 0
PT-PT 9.4695 19.1091 10.7554 6.9365 9.766 0
Escort-inter 6.1945 4.3818 1.8404 6.4926 4.5419 0
Cluster I6
GoodsTrans-inter 21.6285 13.9906 1.6836 9.106 4.2476 0
Shopping-inter 18.8225 20.0094 3.907 5.1911 6.386 0
Private-inter 18.2433 19.1038 3.9751 6.1209 6.1903 0
Escort-inter 17.8761 12.717 1.8404 9.1091 4.5419 0
Leisure-inter 11.6533 19.8868 7.5052 5.0119 7.9313 0
C-PT 9.0918 8.0377 1.6662 10.4934 5.2313 0
WorkRel-inter 6.616 8.8491 3.131 10.0811 6.4517 0
B-PT 6.2779 10 3.7704 10.6612 7.4074 0
PT-PT 5.7683 18.3019 10.7554 7.8322 9.766 0
Table 6Variable contribution of unimodal clustering (n= 1.060)
v.test Mean in category Overall mean sd in category Overall sd p.value
Cluster U1
C 5.4055 10.8595 8.566 10.2227 10.1105 0
C-other −2.6519 0.0378 0.2868 0.4516 2.2371 0.008
CS −3.6084 0.0432 0.3693 0.463 2.1536 3.00E-04
Escort-uni −6.9322 1.8068 3.5873 3.2222 6.1206 0
WorkRel-uni −8.939 1.8027 4.7406 4.952 7.8319 0
GoodsTrans-uni −9.0827 1.427 3.6307 2.2954 5.7816 0
Shopping-uni −13.8803 4.7743 9.417 5.0568 7.9706 0
Private-uni −14.068 2.6919 7.0528 3.4761 7.3871 0
Work-uni −14.1108 5.0135 11.1179 8.3812 10.309 0
PT −14.3072 2.3378 7.8953 3.4135 9.2565 0
Leisure-uni −17.6764 5.4878 11.7967 5.7354 8.5051 0
B −18.2558 1.7149 9.6368 3.8584 10.3408 0
Cluster U2
PT 24.7935 22 7.8953 0 9.2565 0
Work-uni 4.1171 13.7264 11.1179 9.9863 10.309 0
CS −2.2916 0.066 0.3693 0.5951 2.1536 0.0219
Private-uni −3.732 5.3585 7.0528 5.6262 7.3871 2.00E-04
Shopping-uni −4.26 7.3302 9.417 6.6257 7.9706 0
Escort-uni −5.8435 1.3892 3.5873 2.5991 6.1206 0
GoodsTrans-uni −6.7994 1.2146 3.6307 1.9169 5.7816 0
B −8.5131 4.2264 9.6368 7.8731 10.3408 0
C −10.157 2.2547 8.566 6.0025 10.1105 0
Cluster U3
B 21.0801 21.5078 9.6368 2.7937 10.3408 0
CS 6.743 1.1602 0.3693 3.8527 2.1536 0
Leisure-uni 5.8534 14.5078 11.7967 7.4378 8.5051 0
Shopping-uni 3.638 10.9961 9.417 7.395 7.9706 3.00E-04
Private-uni 2.7672 8.166 7.0528 6.5952 7.3871 0.0057
WorkRel-uni −2.6568 3.6074 4.7406 6.0909 7.8319 0.0079
GoodsTrans-uni −2.9893 2.6895 3.6307 3.4869 5.7816 0.0028
Escort-uni −5.5004 1.7539 3.5873 3.3243 6.1206 0
PT −5.8289 4.957 7.8953 6.8505 9.2565 0
C −7.6402 4.3594 8.566 7.6748 10.1105 0
Cluster U4
C-other 30.8244 22 0.2868 0 2.2371 0
WorkRel-uni 5.2955 17.8 4.7406 8.4119 7.8319 0
GoodsTrans-uni 2.7571 8.65 3.6307 9.1653 5.7816 0.0058
C −1.9996 2.2 8.566 6.6 10.1105 0.0455
PT −2.1599 1.6 7.8953 3.2 9.2565 0.0308
B −2.7139 0.8 9.6368 2.4 10.3408 0.0066
Cluster U5
GoodsTrans-uni 20.1554 10.7925 3.6307 8.2316 5.7816 0
Acknowledgements
We would like to express our thanks to two anonymous reviewers and to our colleague Julia Jarass for valuable comments on the manuscript
Authors’contributions
RO conceptualized the quantitative empirical study and the methodological procedure of the user typology, performed the quantitative empirical study, and analyzed the survey data. SN performed and interpreted the cluster analyses. LG conceptualized the quantitative empirical study and the methodological procedure of the user typology, and embedded the study in the state of the art on user typologies. All authors wrote considerable parts of the manuscript, continuously discussed the progress of the manuscript, and read and approved the final manuscript.
Funding
This work was part of the project“Urban Mobility”(http://www.urmo.info/en/
), institutionally funded by the German Aerospace Center (DLR).
Availability of data and materials
The dataset analyzed during this study is not publicly available due to the data protection regulations of the survey.
Competing interests
The authors declare that they have no competing interests.
Received: 13 November 2018 Accepted: 21 May 2019
References
1. Ahrens, GA., Klotzsch, J., Wittwer, R. (2014). Autos nutzen, statt besitzen -Treiber des multimodalen Verkehrsverbundes. Paper presented at the 24. Verkehrswissenschaftliche Tage, 20-21 March 2014. Dresden.
2. Anable, J. (2005).‘Complacent Car addicts’or‘aspiring environmentalists’? Identifying travel behaviour segments using attitude theory.Transport Policy, 12, 65–78.
3. Best, H., & Lanzendorf, M. (2005). Division of labour and gender differences in metropolitan car use: An empirical study in Cologne Germany.Journal of Transport Geography, 13, 109–121.
4. Buehler, R. (2011). Determinants of transport moide choice: A comparison of Germany and the USA.J Transp Geogr, 2011, 644–657.https://doi.org/10. 1016/j.jtrangeo.2010.07.005.
5. Choo, S., & Mokhtarian, P. L. (2004). What type of vehicle do people drive? The role of attitude and lifestyle in influencing vehicle type choice.
Transportation Research Part A: Policy and Practice, 38, 201–222.
6. Dacko, S. G., & Spalteholz, C. (2014). Upgrading the city: Enabling intermodal travel behaviour.Technological Forecasting and Social Change, 89, 222–235.
https://doi.org/10.1016/j.techfore.2013.08.039.
7. Dangschat, J. S. (2017). Wie bewegen sich die (Im-)Mobilen? Ein Beitrag zur Weiterentwicklung der Mobilitätsgenese. In M. Wilde, M. Gather, C. Neiberger, & J. Scheiner (Eds.),Verkehr und Mobilität zwischen Alltagspraxis und Planungstheorie. Ökologische und soziale Perspektiven (pp. 25–51). Wiesbaden: Springer VS.
8. Deffner, J., Hefter, T., & Götz, K. (2014). Multioptionalität auf dem Vormarsch? Veränderte Mobilitätswünsche und technische Innovationen als neue
Potenziale für einen multimodalen Öffentlichen Verkehr. In O. Schwedes (Ed.),Öffentliche Mobilität.Perspektiven für eine nachhaltige
Verkehrsentwicklung (pp. 201–227). Wiesbaden: Springer VS. 9. Döring, L. (2018).Mobilitätsbiografien und Mobilitätssozialisation: Eine
quantitative Analyse von Sozialisations-, Alters-, Perioden-und Kohorteneffekten in Alltagsmobilität. Wiesbaden: Springer VS.
10. Gebhardt, L., Krajzewicz, D., & Oostendorp, R. (2017). Intermodality - key to a more efficient urban transport system? InProceedings of the Eceee 2017 summer study–Consumption, efficiency & limits(pp. 759–769).
11. Geller, E. S. (1989). Applied behavior analysis and social marketing: An integration for environmental preservation.Journal of Social Issues, 45, 17–36.
12. Haustein, S., & Hunecke, M. (2013). Identifying target groups for environmentally sustainable transport: Assessment of different
segmentation approaches.Current Opinion in Environment Sustainability, 5, 197–204.https://doi.org/10.1016/j.cosust.2013.04.009.
13. Haustein, S., & Nielson, T. A. S. (2016). European mobility cultures: A survey-based cluster analysis across 28 European countries.Journal of Transport Geography, 54, 173–180.
14. Heddebaut, O., & Di Ciommo, F. (2018). City-hubs for smarter cities. The case of Lille“EuraFlandres”interchange.European Transport Research Review, 10, 10. 15. Heinrichs, D., & Oostendorp, R. (2015). Urbane Mobilität–in Zukunft
intermodal?ATZextra, 20, 18–21.
16. Hernandez, S., Monzon, A., & de Oña, R. (2016). Urban transport interchanges: A methodology for evaluating perceived quality.
Transportation Research Part A: Policy and Practice, 84, 31–43.
17. Hildebrand, E. D. (2003). Dimensions in elderly travel behaviour: A simplified activity-based model using lifestyle clusters.Transportation Planning and Technology, 30, 285-306.
18. Hinkeldein, D., Schoenduwe, R., Graff, A., & Hoffmann, C. (2015).Who would use integrated sustainable mobility services–and why?In M. Attard & Y. Shiftan (Eds.),Sustainable urban transport(pp. 177–203). Bingley: Emerald Group Publishing Limited.
19. Hjorthol, R. (2008). Daily mobility of men and women - a barometer of gender equality? In T. Priya Uteng & T. Cresswell (Eds.),Gendered Mobilities. Ashgate (transport and society)(pp. 193–210). Aldershot.
20. Hunecke, M. (2002). Lebensstile, Mobilitätsstile und Mobilitätstypen. In M. Hunecke, C. J. Tully, & D. Bäumer (Eds.),Mobilität von Jugendlichen. Psychologische, soziologische und umweltbezogene Ergebnisse und Gestaltungsempfehlungen(pp. 89–97). Wiesbaden: Springer VS.
21. Hunecke, M., & Haustein, S. (2007). Einstellungsbasierte Mobilitätstypen: Eine integrierte Anwendung von multivariaten und inhaltsanalytischen Methoden der empirischen Sozialforschung zur Identifikation von Zielgruppen für eine nachhaltige Mobilität.Umweltpsychologie, 11, 38–68. 22. Hunecke, M., Haustein, S., Böhler, S., & Grischkat, S. (2010). Attitude-based target groups to reduce the ecological impact of daily mobility behavior.
Environment and Behavior, 42, 3–43.
23. Jarass, J., & Oostendorp, R. (2017). Intermodal, urban, mobil– Charakterisierung intermodaler Wege und Nutzer am Beispiel Berlin.
Raumforschung und Raumordnung - Spatial Research and Planning,75, 355– 369.https://doi.org/10.1007/s13147-017-0478-z.
24. Jarass, J., & Scheiner, J. (2018). Residential self-selection and travel mode use in a new inner-city development neighbourhood in Berlin.Journal of Transport Geography, 70, 68–77.
Table 6Variable contribution of unimodal clustering (n= 1.060)(Continued)
v.test Mean in category Overall mean sd in category Overall sd p.value
Private-uni 17.5931 15.0401 7.0528 7.9366 7.3871 0
Shopping-uni 17.1169 17.8019 9.417 6.6743 7.9706 0
Leisure-uni 15.2967 19.7925 11.7967 5.1574 8.5051 0
WorkRel-uni 14.0283 11.4929 4.7406 9.8777 7.8319 0
C 12.3736 16.2547 8.566 9.3864 10.1105 0
Work-uni 11.0521 18.1203 11.1179 7.8619 10.309 0
25. Jensen, M. (1999). Passion and heart in transport - a sociological analysis on transport behaviour.Transport Policy, 6, 19–33.
26. Johansson, M. V., Heldt, T., & Johansson, P. (2006). The effects of attitudes and personality traits on mode choice.Transportation Research Part A: Policy and Practice, 40, 507–525.
27. Jolliffe, I. T. (1986). Principal component analysis and factor analysis. In
Principal component analysis(pp. 115–128). New York: Springer. https://doi. org/10.1007/978-1-4757-1904-8_7.
28. Jones, W. B., Cassady, C. R., & Bowden, R. O. (2000). Developing a standard definition of intermodal transportation.Transport Law Journal, 27. 29. Kager, R., Bertolini, L., & Te Brömmelstroet, M. (2016). Characterisation of and
reflections on the synergy of bicycles and public transport.Transportation Research Part A: Policy and Practice, 85, 208–219.https://doi.org/10.1016/j.tra.2016.01.015. 30. Kopp, G., Klötzke, M., Gebhardt, L. & Friedrich, H.E. (2018). A mixed-methods
approach to derive vehicle concepts for urban mobility. InProceedings of the 7th Transport Research Arena TRA 2018(pp. 16–19). Vienna. 31. Krizek, K., & Waddell, P. (2002). Analysis of lifestyle choices: Neighborhood
type, travel patterns, and activity participation.Transportation Research Record: Journal of the Transportation Research Board,1807, 119–128. 32. Kuhnimhof, T., Buehler, R., Wirtz, M., & Kalinowska, D. (2012). Travel trends
among young adults in Germany: Increasing multimodality and declining car use for men.Journal of Transport Geography, 24, 443–450.
33. Kutter, E. (1972). Gruppenspezifische Ortsveränderungsmuster der städtischen Bevölkerung. In E. Kutter (Ed.),Demographische Determinaten städtischen Personenverkehrs. Braunschweig: Institut für Stadtbauwesen. 34. Lanzendorf, M., & Busch-Geertsema, A. (2014). The cycling boom in large
German cities—Empirical evidence for successful cycling campaigns.
Transport Policy, 36, 26–33.
35. Lê, S., Josse, J., & Husson, F. (2008). FactoMineR: An R package for multivariate analysis.Journal of Statistical Software, 25, 1–18. 36. MacDonald, M. H., & Dunbar, I. (1995).Market segmentation: A step-by-step
approach to creating profitable market segments. Basingstoke: Macmillan Business. 37. Maertins, C. (2006).Die Intermodalen Dienste der Bahn: Mehr Mobilität und
weniger Verkehr. Wirkungen und Potenziale neuer Verkehrsdienstleistungen. Berlin: WZB SP.
38. May, A., Boehler-Baedeker, S., Delgado, L., Durlin, T., Enache, M., & van der Pas, J.-W. (2017). Appropriate national policy frameworks for sustainable urban mobility plans.European Transport Research Review, 9:7, 1-16. 39. Nobis, C. (2007). Multimodality: Facets and causes of sustainable mobility
behavior.Transportation Research Record: Journal of the Transportation Research Board, 2010, 35–44.https://doi.org/10.3141/2010-05. 40. Nobis, C., Kuhnimhof, T. (2018). Mobilität in Deutschland - MiD
Ergebnisbericht. Studie von infas, DLR, IVT und infas 360 im Auftrag des Bundesministers für Verkehr und digitale Infrastruktur (FE-Nr. 70.904/15), Bonn, Berlin.www.mobilitaet-in-deutschland.de.
41. Olafsson, A. S., Nielsen, T. S., & Carstensen, T. A. (2016). Cycling in multimodal transport behaviours: Exploring modality styles in the Danish population.Journal of Transport Geography, 52, 123–130.
42. Olaru, D., Smith, B., Xia, J. C., & Lin, T. G. (2014). Travellers’attitudes Towards Park-and-ride (PnR) and choice of PnR Station: Evidence from Perth, Western Australia.Procedia - Social and Behavioral Sciences, 162, 101–110. 43. Oostendorp, R., & Gebhardt, L. (2018). Combining means of transport as a
users' strategy to optimize traveling in an urban context: Empirical results on intermodal travel behavior from a survey in Berlin.Journal of Transport Geography, 71, 72–83.https://doi.org/10.1080/23800127.2018.1554293
44. Outwater, M., Modugula, V., Castleberry, S., & Bhatia, P. (2004). Market segmentation approach to mode choice and ferry ridership forecasting.Transportation Research Record: Journal of the Transportation Research Board, 71–79.
45. Prillwitz, J., & Barr, S. (2011). Moving towards sustainibility? Mobility styles, attitudes and individual travel behaviour.Journal of Transport Geography, 19, 1590–1600. 46. Rode, P., Hoffmann, C., Kandt, J., Smith, D., & Graff, A. (2015). Towards new
urban mobility the case of London and Berlin. London: LSE cities/InnoZ. 47. van Lierop, D., & El-Geneidy, A. (2017). A new market segmentation approach:
Evidence from two Canadian cities.Journal of Public Transportation, 20(2). 48. Vij, A., Carrel, A., & Walker, J. L. (2011). Capturing modality styles using
behavioral mixture models and longitudinal data. InProceedings of the 2nd international choice modelling conference(pp. 4–6). Leeds.
49. Vij, A., Carrel, A., & Walker, J. L. (2013). Incorporating the influence of latent modal preferences on travel mode choice behavior.Transportation Research Part A: Policy and Practice, 54, 164–178.https://doi.org/10.1016/j.tra.2013.07.008.
50. Ward, J. H., Jr. (1963). Hierarchical grouping to optimize an objective function.Journal of the American Statistical Association, 58, 236–244. 51. Yeh C-F (2008) A study on feasibility of passenger intermodal transport in
city of the developing world. Paper presented at the Codatu XIII, Ho-Chi-Minh-Stadt, 12-14 November 2008.
Publisher’s Note