ORIGINAL ARTICLE DOI 10.1007/s10086-004-0625-3
J. Ohshima · S. Yokota · N. Yoshizawa
Department of Forest Science, Faculty of Agriculture, Utsunomiya University, Utsunomiya 321-8505, Japan
T. Ona (*)
Department of Forest and Forest Products Sciences, Graduate School of Bioresource and Bioenvironmental Sciences, Kyushu University, 6-10-1 Hakozaki, Higashi-ku, Fukuoka 812-8581, Japan Tel. ⫹81-92-642-2989; Fax ⫹81-92-642-2989
e-mail: ona@agr.kyushu-u.ac.jp
Jyunichi Ohshima · Shinso Yokota · Nobuo Yoshizawa Toshihiro Ona
Examination of within-tree variations and the heights representing
whole-tree values of derived wood properties for quasi-non-destructive
breeding of Eucalyptus camaldulensis and Eucalyptus globulus as
quality pulpwood
Received: May 6, 2003 / Accepted: February 4, 2004
Abstract Within-tree variations of derived wood properties of Runkel ratio, Luce’s shape factor, slenderness ratio, and solids factor were examined for Eucalyptus camaldulensis and Eucalyptus globulus trees and the tendency difference in the within-tree variations between individuals and be-tween species, in both radial and axial directions by statisti-cal data analysis. These properties are important for quality breeding of pulpwood. In both species, within-tree varia-tions were generally observed as higher values in the upper and outer parts compared with other parts of the trunk for Runkel ratio and Luce’s shape factor. In E. camaldulensis, within-tree variations were observed as higher values in the upper and outer parts compared with other parts of the trunk for slenderness ratio and solids factor. In E. globulus, within-tree variations were observed as higher values in the outer parts compared with other parts for slenderness ratio and solids factor. However, significant difference of ten-dency was observed in radial variation between individuals of E. globulus for Runkel ratio and in both radial and axial variations between species for solids factor. Furthermore, within-tree variations of derived wood properties were analyzed to determine a sampling height in the trunk which can be used to represent whole-tree values. Representative heights of derived wood properties from two trees were found to be 2.8 m in E. camaldulensis (except for Runkel ratio and Luce’s shape factor) and 1.8 m in E. globules (ex-cept for Runkel ratio), regardless of differences in tree height (growth rate) and in tendency of within-tree varia-tion of derived wood properties.
Key words Within-tree variation · Representative height · Derived wood property · Eucalyptus · Quality breeding
Introduction
The genus Eucalyptus is a widely planted species for pulp production in many plantation sites. The breeding programs of trees aim to improve growth, pulp yield, and strength for the pulp production, because elite tree selection contributes to reduction of pulp costs in plantations with short-term rotations.1
The increment core method is a quasi-non-destructive sampling method, and is effective and efficient in the practical quality breeding program because a core can be easily removed from the trunk using an automatic drill without cutting the tree down.2
However, using this indirect selection method, clear relationships between wood and pulp properties are needed for the prediction of whole-tree properties of interest.
Derived wood properties, such as Runkel ratio, Luce’s shape factor, slenderness ratio, and solids factor, have been recognized as important traits for pulp and paper properties in Eucalyptus.3–6
For example, Runkel ratio is related to paper conformability3,5
and pulp yield,6
and Luce’s shape factor and slenderness ratio are related to paper sheet density and to pulp digestability, respectively.6
These sug-gest derived wood properties could be used as selection indices for quality breeding.
The use of increment core method depends on how well the core-sampling position represents the whole tree. To determine the core-sampling position accurately, an exami-nation of within-tree variations of derived wood properties is required. Within-tree variations of derived wood proper-ties, such as Runkel ratio and slenderness ratio in Eucalyp-tus have been reported previously.7–11
However, little has been presented on within-tree variations of derived wood properties including Luce’s shape factor and solids factor, which significantly correlate to breaking length of paper in Eucalyptus.6
exam-ined either between individuals or between species by a quantitative manner using statistical data analysis.
Moreover, the most appropriate core-sampling position is reported for Runkel ratio in Eucalyptus,12
but not for Luce’s shape factor and solids factor on a whole-tree basis. In this study, we investigated the within-tree variations of derived wood properties in Eucalyptus camaldulensis and Eucalyptus globulus trees and examined the tendency dif-ferences in within-tree variations of derived wood proper-ties between individuals and between species, in both radial and axial directions by statistical data analysis.
Furthermore, we investigated the use of a representative height in the trunk to indicate whole-tree values of derived wood properties for core-sampling and the influence of the tendency difference in within-tree variations of derived wood properties between individuals and between species as part of achieving a quality breeding program for pulpwood.
Materials and methods
Materials
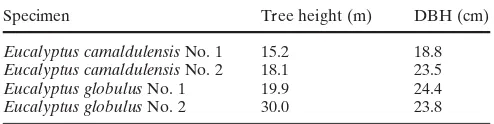
Two trees each of 14-year-old Eucalyptus camaldulensis and Eucalyptus globulus were obtained from Manjimup in Western Australia (annual average temperature: 15.5°C, annual rainfall: 1000 mm) for this study. The two sample trees were selected in each species as No. 1 and No. 2 trees, possessing average and superior growth characteristics, re-spectively (Table 1).
Discs (6 cm thick) were cut at 1-m intervals from 0.3 m above the ground up to the height with a diameter of 8 cm. Two 2-cm wide strips were removed from the center of each disc. One strip was cut into 2 (radial) ⫻ 2 (tangential) ⫻ 6 cm (longitudinal) wood blocks from pith to bark. These blocks were fixed with ethanol/water and utilized for the fiber morphology determination for calculating the derived wood properties.
Determination of wood properties
Cross sections (15µm thick) were microtomed from block samples and stained with safranin and mounted in Bioleit (Ohken Shoji, Tokyo, Japan). The cross-sectional images were captured by personal computer and converted to digi-tal format using an image scanner CanoScan 2700F (Canon, Tokyo, Japan) for the image analysis. Fiber morphology was measured: radial and tangential diameters, lumen
radial and tangential diameters, cell area, lumen area, cell perimeter, and lumen perimeter. Fiber diameter, fiber lumen diameter, and fiber wall thickness were calculated as follows:
Fiber diameter (µm) ⫽
(radial diameter ⫹ tangential diameter)/2 Fiber lumen diameter (µm) ⫽
(radial lumen diameter ⫹ tangential lumen diameter)/2 Fiber wall thickness (µm) ⫽
2 ⫻ (cell area ⫺ lumen area)/(cell perimeter ⫹ lumen parameter)
Here, fiber wall thickness was calculated as the height of the trapezoid according to Yoshinaga et al.,13
because each whole fiber wall area was regarded as the trapezoid. Under these measuring conditions, a dimension of one pixel on the computer corresponded to 0.15µm of real dimension.
The cell morphologies of 50 randomly selected fibers were measured by image-processing software, NIH Image 1.62 (National Institute of Health, Bethesda, MD, USA). The cell length of 50 fibers, macerated from small sticks (ca 1 ⫻ 1 ⫻ 10 mm) with Schultz’s solution,14,15
was measured by a digitizer (Oscon, Gradimate SQ-3000, Tokyo, Japan) coupled to an Olympus CH light microscope (Olympus, Tokyo, Japan).
The derived wood properties of Runkel ratio,16 Luce’s shap factor,17
slenderness ratio,9
and solids factor18 were calculated from measurements of the fiber morphology:
Runkel ratio ⫽
fiber wall thickness ⫻ 2/fiber lumen diameter Luce’s shape factor ⫽
(fiber diameter2 ⫺ fiber lumen diameter2 )/ (fiber diameter2⫹
fiber lumen diameter2 ) Slenderness ratio ⫽ fiber length/fiber diameter Solids factor ⫽
(fiber diameter2 ⫺ fiber lumen diameter2) ⫻ fiber length
Tendency difference of within-tree variations for derived wood properties between individuals and between species
The tendency difference of within-tree variations of derived wood properties was examined between individuals and between species for both radial and axial directions by sta-tistical data analysis. The linear regression line was created for radial variation at a given distance from pith and for axial variation at a given height above the ground using SigmaPlot 8.0 statistical software (SPSS, Chicago, IL, USA). The slopes for one individual and for one species were grouped as one sample and utilized for the examina-tion of tendency difference of within-tree variaexamina-tions of de-rived wood properties between individuals and between species, respectively, in both radial and axial directions by the Moses test of extreme reactions19
using SPSS 11.0J (SPSS). All samples were used without data trimming.
Table 1. Sample tree height and diameter at breast height (DBH)
Specimen Tree height (m) DBH (cm)
Whole-tree and whole-disc values of derived wood properties
The whole-tree and whole-disc values of derived wood properties were determined, as reported previously,20
in the following manner. The unmeasured parts between two axially adjacent measured parts were considered to hold the average values of the measured parts because selected parts were measured in the trunk and uneven growth was ob-served for some directions. Other unmeasured parts were considered the same as values in radially adjacent measured parts or the calculated parts described above. Additionally, each measured or calculated part was hypothesized to pos-sess the same quality as its concentric circled section. From these, whole-tree and whole-disc values were determined as weighted values by wood volume. Whole-disc values at 0.8, 1.8, and 2.8 m above the ground were calculated as the average of two adjacent measured-disc values.
Results and discussion
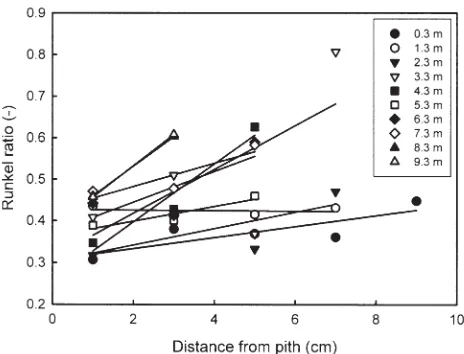
The derived wood properties are summarized in Table 2. The linear regression lines at given heights above the ground were plotted for Runkel ratio against a distance from pith in Eucalyptus camaldulensis No. 1 (Fig. 1). The slopes of regression lines in the radial and axial directions are summarized in Tables 3 and 4, respectively. The slopes for one individual and for one species were grouped as one sample and utilized for the examination of tendency differ-ence in within-tree variations of derived wood properties between individuals and between species, in both radial and axial directions by the Moses test of extreme reactions. The results are summarized in Table 5. The Moses test is a nonparametric analysis for two independent samples and is used in experimental studies where it is assumed that the treatment variable will affect subjects in either a positive or negative way, creating a polarizing effect.19
In the compari-son of the tendency difference of within-tree variation, it often happens that one is normally distributed and the other is polarized at some extreme. In such a case, it is possible both samples have the same central tendency and might not be found to be significantly different by some tests which emphasize difference in central tendency. The Moses test focuses on the differences in extreme tendencies in the tails of the distribution. If the possibility associated with the
Moses test is less than the desired significance level (in this study 0.05), then the two samples do not differ.
Within-tree variation of Runkel ratio
Within-tree variations of Runkel ratio in E. camaldulensis and Eucalyptus globulus are shown in Figs. 2 and 3, respectively.
In E. camaldulensis, both No. 1 and No. 2 trees had a high Runkel ratio in the upper and outer parts of the trunk. There was a trend for Runkel ratio to increase from pith to bark in the radial direction, and from bottom to top in the axial direction, except in the upper parts of tree No. 2. Similarly, in E. globulus, both trees had a high Runkel ratio in the upper and outer parts of the trunk, but the trend of within-tree variation was different between individuals. In particular, the upper and outer parts in tree No. 2 showed higher Runkel ratio compared with the other parts. In E. globulus No. 1, a relatively uniform trend of increasing Runkel ratio was observed from pith to bark in the radial direction, with a weak trend of increasing Runkel ratio from bottom to top in the axial direction. On the other hand, in E. globulus No. 2, a trend of increasing Runkel ratio was only observed from pith to bark in the lower parts of the trunk in the radial direction, but no clear trend was observed in the
Table 2. Derived wood properties
Traits Eucalyptus camaldulensis Eucalyptus globulus
No. 1 No. 2 No. 1 No. 2
(n ⫽ 33) (n ⫽ 44) (n ⫽ 56) (n ⫽ 93) Runkel ratio 0.50 ⫾ 0.12 0.50 ⫾ 0.10 0.54 ⫾ 0.12 0.67 ⫾ 0.24 Luce’s shape factor 0.37 ⫾ 0.06 0.37 ⫾ 0.05 0.39 ⫾ 0.06 0.44 ⫾ 0.10 Slenderness ratio 56.6 ⫾ 5.2 50.5 ⫾ 5.3 59.9 ⫾ 7.0 57.7 ⫾ 6.3 Solids factor (µm3) ⫻ 103 51.2 ⫾ 8.2 48.6 ⫾ 9.0 96.3 ⫾ 29.1 97.6 ⫾ 41.0 Results are given as average ⫾ standard deviation
Fig. 1. Plots of linear regression lines at given heights above ground for
upper parts. The trend of increasing Runkel ratio was also observed from bottom to top in inner parts of the trunk in the axial direction, but the variation was small in outer parts. From these observations, significant difference be-tween individuals was recognized in the radial variation of
E. globulus (Table 5). Consequently, for both species, the upper and outer parts had higher Runkel ratios compared with other parts.
In the radial direction, the trend of increasing Runkel ratio from pith to bark was reported for Eucalyptus
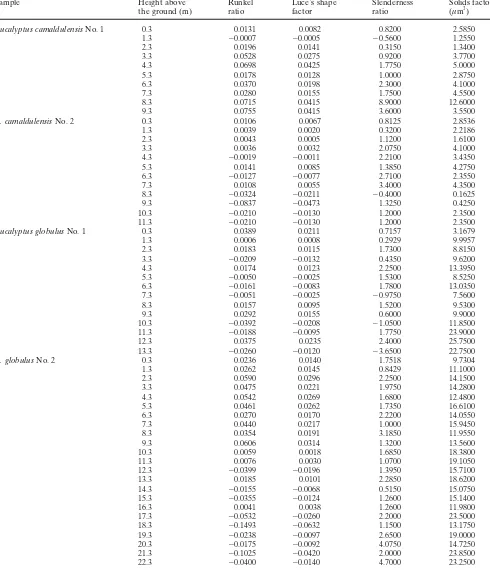
Table 3. Slopes of linear regression lines for radial variation at given heights above the ground
Sample Height above Runkel Luce’s shape Slenderness Solids factor
the ground (m) ratio factor ratio (µm3)
Eucalyptus camaldulensis No. 1 0.3 0.0131 0.0082 0.8200 2.5850
1.3 ⫺0.0007 ⫺0.0005 ⫺0.5600 1.2550
2.3 0.0196 0.0141 0.3150 1.3400
3.3 0.0528 0.0275 0.9200 3.7700
4.3 0.0698 0.0425 1.7750 5.0000
5.3 0.0178 0.0128 1.0000 2.8750
6.3 0.0370 0.0198 2.3000 4.1000
7.3 0.0280 0.0155 1.7500 4.5500
8.3 0.0715 0.0415 8.9000 12.6000
9.3 0.0755 0.0415 3.6000 3.5500
E. camaldulensis No. 2 0.3 0.0106 0.0067 0.8125 2.8536
1.3 0.0039 0.0020 0.3200 2.2186
2.3 0.0043 0.0005 1.1200 1.6100
3.3 0.0036 0.0032 2.0750 4.1000
4.3 ⫺0.0019 ⫺0.0011 2.2100 3.4350
5.3 0.0141 0.0085 1.3850 4.2750
6.3 ⫺0.0127 ⫺0.0077 2.7100 2.3550
7.3 0.0108 0.0055 3.4000 4.3500
8.3 ⫺0.0324 ⫺0.0211 ⫺0.4000 0.1625
9.3 ⫺0.0837 ⫺0.0473 1.3250 0.4250
10.3 ⫺0.0210 ⫺0.0130 1.2000 2.3500
11.3 ⫺0.0210 ⫺0.0130 1.2000 2.3500
Eucalyptus globulus No. 1 0.3 0.0389 0.0211 0.7157 3.1679
1.3 0.0006 0.0008 0.2929 9.9957
2.3 0.0183 0.0115 1.7300 8.8150
3.3 ⫺0.0209 ⫺0.0132 0.4350 9.6200
4.3 0.0174 0.0123 2.2500 13.3950
5.3 ⫺0.0050 ⫺0.0025 1.5300 8.5250
6.3 ⫺0.0161 ⫺0.0083 1.7800 13.0350
7.3 ⫺0.0051 ⫺0.0025 ⫺0.9750 7.5600
8.3 0.0157 0.0095 1.5200 9.5300
9.3 0.0292 0.0155 0.6000 9.9000
10.3 ⫺0.0392 ⫺0.0208 ⫺1.0500 11.8500
11.3 ⫺0.0188 ⫺0.0095 1.7750 23.9000
12.3 0.0375 0.0235 2.4000 25.7500
13.3 ⫺0.0260 ⫺0.0120 ⫺3.6500 22.7500
E. globulus No. 2 0.3 0.0236 0.0140 1.7518 9.7304
1.3 0.0262 0.0145 0.8429 11.1000
2.3 0.0590 0.0296 2.2500 14.1500
3.3 0.0475 0.0221 1.9750 14.2800
4.3 0.0542 0.0269 1.6800 12.4800
5.3 0.0461 0.0262 1.7350 16.6100
6.3 0.0270 0.0170 2.2200 14.0550
7.3 0.0440 0.0217 1.0000 15.9450
8.3 0.0354 0.0191 3.1850 11.9550
9.3 0.0606 0.0314 1.3200 13.5600
10.3 0.0059 0.0018 1.6850 18.3800
11.3 0.0076 0.0030 1.0700 19.1050
12.3 ⫺0.0399 ⫺0.0196 1.3950 15.7100
13.3 0.0185 0.0101 2.2850 18.6200
14.3 ⫺0.0155 ⫺0.0068 0.5150 15.0750
15.3 ⫺0.0355 ⫺0.0124 1.2600 15.1400
16.3 0.0041 0.0038 1.2600 11.9800
17.3 ⫺0.0532 ⫺0.0260 2.2000 23.5000
18.3 ⫺0.1493 ⫺0.0632 1.1500 13.1750
19.3 ⫺0.0238 ⫺0.0097 2.6500 19.0000
20.3 ⫺0.0175 ⫺0.0092 4.0750 14.7250
21.3 ⫺0.1025 ⫺0.0420 2.0000 23.8500
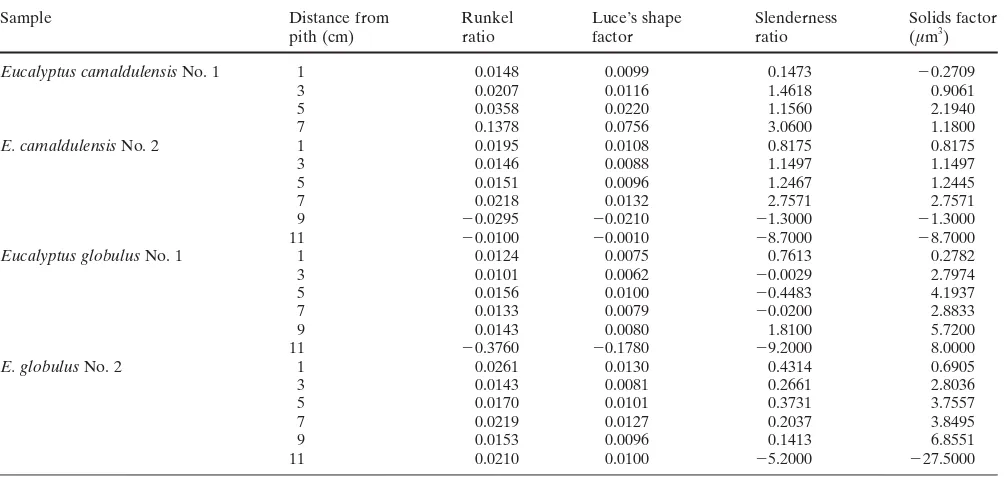
Table 4. Slopes of linear regression lines for axial variation at given distances from pith
Sample Distance from Runkel Luce’s shape Slenderness Solids factor
pith (cm) ratio factor ratio (µm3)
Eucalyptus camaldulensis No. 1 1 0.0148 0.0099 0.1473 ⫺0.2709
3 0.0207 0.0116 1.4618 0.9061
5 0.0358 0.0220 1.1560 2.1940
7 0.1378 0.0756 3.0600 1.1800
E. camaldulensis No. 2 1 0.0195 0.0108 0.8175 0.8175
3 0.0146 0.0088 1.1497 1.1497
5 0.0151 0.0096 1.2467 1.2445
7 0.0218 0.0132 2.7571 2.7571
9 ⫺0.0295 ⫺0.0210 ⫺1.3000 ⫺1.3000
11 ⫺0.0100 ⫺0.0010 ⫺8.7000 ⫺8.7000
Eucalyptus globulus No. 1 1 0.0124 0.0075 0.7613 0.2782
3 0.0101 0.0062 ⫺0.0029 2.7974
5 0.0156 0.0100 ⫺0.4483 4.1937
7 0.0133 0.0079 ⫺0.0200 2.8833
9 0.0143 0.0080 1.8100 5.7200
11 ⫺0.3760 ⫺0.1780 ⫺9.2000 8.0000
E. globulus No. 2 1 0.0261 0.0130 0.4314 0.6905
3 0.0143 0.0081 0.2661 2.8036
5 0.0170 0.0101 0.3731 3.7557
7 0.0219 0.0127 0.2037 3.8495
9 0.0153 0.0096 0.1413 6.8551
11 0.0210 0.0100 ⫺5.2000 ⫺27.5000
Table 5. Significance of statistical differences of tendency in within-tree variations of derived wood properties between individuals and between
species by the Moses test (P ⬍ 0.05)
Trait Runkel ratio Luce’s Slenderness Solids factor
shape factor ratio
Radial difference between individuals of Eucalyptus NS (0.059) NS (0.059) NS (1.000) NS (0.571) camaldulensis
Radial difference between individuals of Eucalyptus Significant (0.011) NS (0.102) NS (0.362) NS (1.000) globulus
Radial diffrence between species NS (0.690) NS (0.865) NS (0.521) Significant (0.000)
Axial difference between individuals of E. camaldulensis NS (0.452) NS (0.262) NS (0.667) NS (0.452) Axial difference between individuals of E. globulus NS (0.121) NS (0.273) NS (1.000) NS (0.773)
Axial diffrence between species NS (0.805) NS (0.805) NS (0.805) Significant (0.001)
P values are shown in parentheses NS, not significant
Fig. 2. Within-tree variation of Runkel ratio in E. camaldulensis.
Unboxed and boxed digits represent whole-disc values at given heights
pilularis7
and Eucalyptus grandis.8,9
We observed a similar trend of increasing Runkel ratio in this study, which was not affected by the growth rate difference. The trend of within-tree variation of Runkel ratio in both species was very similar to that of wall thickness, as reported previously.19 This is probably due to fiber wall thickness which had a higher proportional increase than lumen diameter. Within-tree variation of Runkel ratio is considered to be largely affected by only fiber wall thickness, although Runkel ratio is derived from fiber wall thickness and lumen diameter.
In making paper using hardwood, a Runkel ratio less than 1.0 is desirable to obtain good conformability and fiber to fiber contact in paper.5
From this aspect, the Runkel ratio in both species is adequate for making paper.
Ona et al.6
reported that Runkel ratio significantly re-lated to pulp yield (positively) and to digestibility (nega-tively) in E. camaldulensis. The results obtained suggest the upper and outer parts of the trunk will have higher pulp yield and better digestibility than other parts in E. camaldulensis.
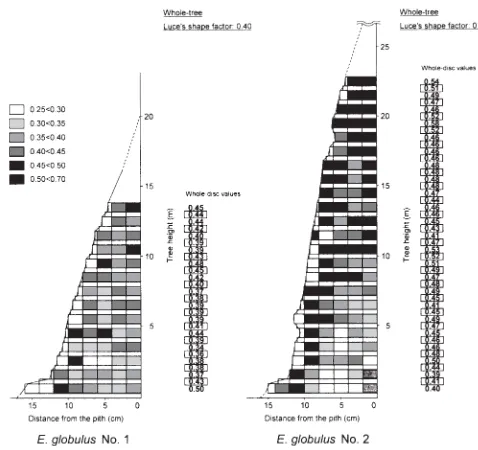
Within-tree variation of Luce’s shape factor
Within-tree variations of Luce’s shape factor in E. camaldulensis and E. globulus are shown in Figs. 4 and 5, respectively.
Both E. camaldulensis and E. globulus had high Luce’s shape factor in the upper and outer parts of the trunk. In E. camaldulensis, there was a weak trend of increasing Luce’s shape factor from pith to bark in the radial direction, and from bottom to top in the axial direction, except in the upper parts of tree No. 2. In E. globulus, a trend of increas-ing Luce’s shape factor from pith to bark in the radial direction was observed in the lower parts of the trunk, but no clear trend was observed in the upper parts. The trend of increasing Luce’s shape factor was in the axial direction for the inner parts of the trunk, but the variation was small in outer parts.
The general trend of within-tree variation of Luce’s shape factor in both species was similar to that observed for
Runkel ratio. Similar to Runkel ratio, the trend of within-tree variation of Luce’s shape factor may be associated with that of wall thickness, because both the fiber diameter and the fiber lumen diameter are used to obtain the cross-sectional fiber wall area in the equation for Luce’s shape factor.17
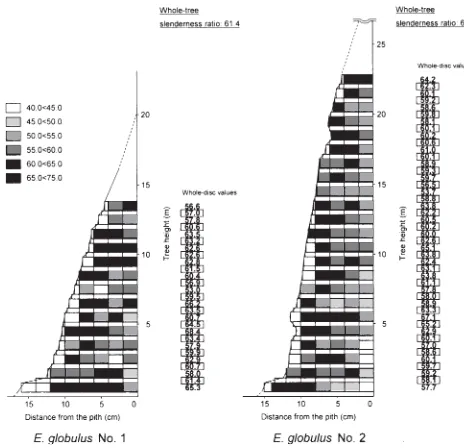
Within-tree variation of slenderness ratio
Within-tree variations of slenderness ratio in E. camaldulensis and E. globulus are shown in Figs. 6 and 7, respectively.
In E. camaldulensis, both No. 1 and No. 2 trees had higher slenderness ratios in the upper and outer parts com-pared with other parts of the trunk. In particular, the upper parts in tree No. 1 showed high values compared with the
Fig. 4. Within-tree variation of Luce’s shape factor in E. camaldulensis
Fig. 5. Within-tree variation of Luce’s shape factor in E. globulus
other parts. There was a trend of increasing slenderness ratio from pith to bark in the radial direction, and from bottom to top in the axial direction. Tree-to-tree variation was small (Table 5). In contrast, the E. globulus trees had high slenderness ratios only in the outer parts of the trunk. The parts at about 5.0 m above the ground showed a higher slenderness ratio, especially compared with the other parts of the trunk. No clear trend in the radial direction was observed for tree No. 1, but a trend of increasing slender-ness ratio was observed from pith to bark for tree No. 2. No clear trend in the axial direction was observed for tree No. 1, but a relatively weak trend from bottom to top was evi-dent for tree No. 2.
In the radial direction, the trend of increasing slender-ness ratio from pith to bark was reported for E. grandis.8,9 Similar trends were observed in our samples. This suggests the increase in fiber length is not associated with a propor-tional increase in fiber diameter, and fibers near the pith possess a proportionally larger diameter than those found in the outer parts of the trunk, as reported for E. grandis.8
Within-tree variation of solids factor
Within-tree variation of the solids factor in E. camaldulensis and E. globulus are shown in Figs. 8 and 9, respectively.
Both E. camaldulensis trees had a high solids factor in the upper and outer parts of the trunk, although the inner parts of tree No. 2 showed lower values than tree No. 1. A trend of increasing solids factor was observed from pith to bark in the radial direction, and from bottom to top in the axial direction. Tree-to-tree variation was small (Table 5). Compared with this, both E. globulus trees had a high solids factor only in the outer parts of the trunk. A trend of increasing solids factor was observed from pith to bark in the radial direction, although a relatively uniform trend of
Fig. 7. Within-tree variation of slenderness ratio in E. globulus
Fig. 8. Within-tree variation of solids factor in E. camaldulensis
Fig. 9. Within-tree variation of solids factor in E. globulus
increasing solids factor from bottom to top was observed in the axial direction. Tree-to-tree variation was also small in E. globulus (Table 5). Consequently, significant differ-ence between species was observed for the solids factor (Table 5).
High negative relationship between the solids factor and the breaking length of paper in E. camaldulensis was ob-tained by Ona et al.6
From this, the upper and outer parts of the trunk in E. camaldulensis would have lower breaking length of paper than other parts.
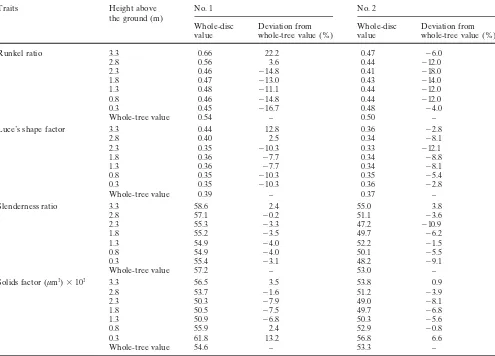
The most appropriate height for sampling increment cores
automatic drill as part of a test for practical quality breed-ing.20 The representative height is defined as the height with the whole-disc value within the whole-tree value ⫾5%. This is done in consideration of the analytical deviation of wood following our previous report.21
The whole-disc values of derived wood properties at heights below 3.3 m in E. camaldulensis and E. globulus are summarized in Tables 6 and 7, respectively.
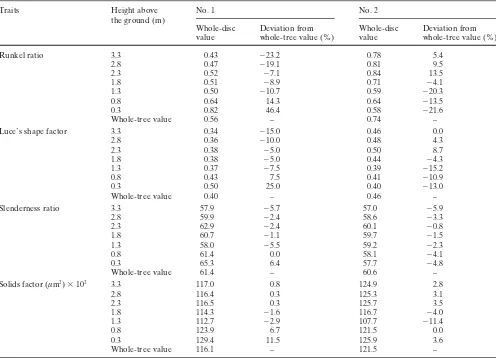
Common representative heights between individuals are as follows: in E. camaldulensis, Runkel ratio: none; Luce’s shape factor: none; slenderness ratio: 1.3, 2.8, 3.3 m; solids factor: 0.8, 2.8, 3.3 m; in E. globulus, Runkel ratio: none; Luce’s shape factor: 1.8 m; slenderness ratio: 0.8, 1.8–2.8 m; solids factor: 1.8–3.3 m. Consequently, the most appropriate height to sample an increment core is 2.8 m above the ground for E. camaldulensis (except for Runkel ratio and Luce’s shape factor), and 1.8 m above ground for E. globulus (except for Runkel ratio). No representative height for Runkel ratio was obtained for either species, probably because of the large difference between whole-tree and whole-disc values resulting from relatively small or unclear within-tree variation. The representative heights were not reflected by the differences in tree height (growth
Table 6. Whole-tree and whole-disc values of derived wood properties at given heights with their deviations from whole-tree values in Eucalyptus
camaldulensis
Traits Height above No. 1 No. 2
the ground (m)
Whole-disc Deviation from Whole-disc Deviation from
value whole-tree value (%) value whole-tree value (%)
Runkel ratio 3.3 0.66 22.2 0.47 ⫺6.0
2.8 0.56 3.6 0.44 ⫺12.0
2.3 0.46 ⫺14.8 0.41 ⫺18.0
1.8 0.47 ⫺13.0 0.43 ⫺14.0
1.3 0.48 ⫺11.1 0.44 ⫺12.0
0.8 0.46 ⫺14.8 0.44 ⫺12.0
0.3 0.45 ⫺16.7 0.48 ⫺4.0
Whole-tree value 0.54 – 0.50 –
Luce’s shape factor 3.3 0.44 12.8 0.36 ⫺2.8
2.8 0.40 2.5 0.34 ⫺8.1
2.3 0.35 ⫺10.3 0.33 ⫺12.1
1.8 0.36 ⫺7.7 0.34 ⫺8.8
1.3 0.36 ⫺7.7 0.34 ⫺8.1
0.8 0.35 ⫺10.3 0.35 ⫺5.4
0.3 0.35 ⫺10.3 0.36 ⫺2.8
Whole-tree value 0.39 – 0.37 –
Slenderness ratio 3.3 58.6 2.4 55.0 3.8
2.8 57.1 ⫺0.2 51.1 ⫺3.6
2.3 55.3 ⫺3.3 47.2 ⫺10.9
1.8 55.2 ⫺3.5 49.7 ⫺6.2
1.3 54.9 ⫺4.0 52.2 ⫺1.5
0.8 54.9 ⫺4.0 50.1 ⫺5.5
0.3 55.4 ⫺3.1 48.2 ⫺9.1
Whole-tree value 57.2 – 53.0 –
Solids factor (µm3) ⫻ 103 3.3 56.5 3.5 53.8 0.9
2.8 53.7 ⫺1.6 51.2 ⫺3.9
2.3 50.3 ⫺7.9 49.0 ⫺8.1
1.8 50.5 ⫺7.5 49.7 ⫺6.8
1.3 50.9 ⫺6.8 50.3 ⫺5.6
0.8 55.9 2.4 52.9 ⫺0.8
0.3 61.8 13.2 56.8 6.6
Whole-tree value 54.6 – 53.3 –
rate) for all derived wood properties and by the difference of tendency in within-tree variations of derived wood properties, especially in the case of the solids factor.
Hudson et al.12
reported that the representative height (whole-tree value ⫾5%) as percentage of tree height was 10% (1.5 m) and 20% (3.0 m) in E. globulus for Runkel ratio, and 5% (0.7 m) in Eucalyptus nitens in the same way. However, no representative height for Runkel ratio was obtained in our samples. Previous results obtained using the same sample trees showed the representative height for fiber morphology was 2.8 m above the ground for E. camaldulensis, and 1.8 m above the ground for E. globulus.22 Including the present results, the representative heights to sample an increment core are 2.8 m and 1.8 m, for E. camaldulensis and E. globulus, respectively. However, it should be mentioned that these heights may cause errors for Runkel ratio and Luce’s shape factor.
Table 7. Whole-tree and whole-disc values of derived wood properties at given heights with their deviations from whole-tree values in Eucalyptus
globulus
Traits Height above No. 1 No. 2
the ground (m)
Whole-disc Deviation from Whole-disc Deviation from
value whole-tree value (%) value whole-tree value (%)
Runkel ratio 3.3 0.43 ⫺23.2 0.78 5.4
2.8 0.47 ⫺19.1 0.81 9.5
2.3 0.52 ⫺7.1 0.84 13.5
1.8 0.51 ⫺8.9 0.71 ⫺4.1
1.3 0.50 ⫺10.7 0.59 ⫺20.3
0.8 0.64 14.3 0.64 ⫺13.5
0.3 0.82 46.4 0.58 ⫺21.6
Whole-tree value 0.56 – 0.74 –
Luce’s shape factor 3.3 0.34 ⫺15.0 0.46 0.0
2.8 0.36 ⫺10.0 0.48 4.3
2.3 0.38 ⫺5.0 0.50 8.7
1.8 0.38 ⫺5.0 0.44 ⫺4.3
1.3 0.37 ⫺7.5 0.39 ⫺15.2
0.8 0.43 7.5 0.41 ⫺10.9
0.3 0.50 25.0 0.40 ⫺13.0
Whole-tree value 0.40 – 0.46 –
Slenderness ratio 3.3 57.9 ⫺5.7 57.0 ⫺5.9
2.8 59.9 ⫺2.4 58.6 ⫺3.3
2.3 62.9 ⫺2.4 60.1 ⫺0.8
1.8 60.7 ⫺1.1 59.7 ⫺1.5
1.3 58.0 ⫺5.5 59.2 ⫺2.3
0.8 61.4 0.0 58.1 ⫺4.1
0.3 65.3 6.4 57.7 ⫺4.8
Whole-tree value 61.4 – 60.6 –
Solids factor (µm3) ⫻ 103 3.3 117.0 0.8 124.9 2.8
2.8 116.4 0.3 125.3 3.1
2.3 116.5 0.3 125.7 3.5
1.8 114.3 ⫺1.6 116.7 ⫺4.0
1.3 112.7 ⫺2.9 107.7 ⫺11.4
0.8 123.9 6.7 121.5 0.0
0.3 129.4 11.5 125.9 3.6
Whole-tree value 116.1 – 121.5 –
Acknowledgments The authors thank the Department of
Conserva-tion and Land Management (Western Australia) for the provision of samples. This research was partly supported by CREST of JST (Japan Science and Technology) and Oji Paper (Japan).
References
1. Ona T, Sonoda T (1996) Quality breeding of pulpwood (in Japa-nese). Cell Commun 2:3–7
2. Downes G, Hudson I, Raymond C, Dean G, Michell T, Schimleck L, Evans R, Muneri A (1997) Sampling plantation eucalypts for wood and fibre properties. CSIRO, Melbourne
3. Higgins HG, de Yong J, Balodis V, Phillips FH, Colley J (1973) The density and structure of hardwoods in relation to paper char-acteristics and other properties. TAPPI J 56:127–131
4. DuPlooy ABJ (1980) The relationship between wood and pulp properties of E. grandis (Hill ex-Maide) grown in South Africa. Appita J 33:257–264
5. Bamber RK (1985) The wood anatomy of eucalypts and paper-making. Appita J 38:210–216
6. Ona T, Sonoda T, Ito K, Shibata M, Tamai Y, Kojima Y, Ohshima J, Yokota S, Yoshizawa N (2001) Investigation of relationships between cell and pulp properties in Eucalyptus by examination of within-tree variations. Wood Sci Technol 35:229–243
7. Bamber RK, Curtin RA (1974) Some properties of wood in blackbutt trees of two ages. Aust Forest 36:226–234
8. Malan FS, Gerischer GFR (1987) Wood property differences in South African grown Eucalyptus grandis trees of different growth stress intensity. Holzforschung 41:331–335
9. Varghese M, Vishnu, Subramanian KN, Bennet SSR, Jagadees S (1995) Genetic effects on wood and fibre traits of Eucalyptus grandis Provenances. Proceedings of CRCTHF-IUFRO Confer-ence, Eucalypt Plantations: Improving Fibre Yield and Quality, Hobart, pp 64–67
10. Hudson I, Wilson L, Van Beveren K (1998) Vessel and fibre prop-erty in Eucalyptus globulus and Eucalyptus nitens: some prelimi-nary results. IAWA J 19:111–130
11. Hudson I, Wilson L, Van Beveren, K (2000) Association of fibre morphology with cambial age and attained height: new oblique axes whole tree variation in Eucalyptus globulus. Appita J 53:122– 140
12. Hudson I, Wilson L, Van Beveren K (2001) Between species dif-ferences in whole tree maps of fibre properties in E. nitens and E. globulus – utility of control deviation charts to assess optimal sam-pling height. Appita J 54:182–189
13. Yoshinaga A, Fujita M, Saiki H (1997) Secondary wall thickness and lignification of oak xylem components during latewood forma-tion (in Japanese). Mokuzai Gakkaishi 43:377–383
14. Saiki H (1985) Wood anatomy, structure (in Japanese). In: Japan Wood Res Soc (ed) Experimental methods in the wood sciences, vol 1. Chugai Sangyo Chosakai, Tokyo, pp 51–104
16. Runkel ROH (1949) Über die Herstellung von Zellstoff aus Holz der Gattung Eucalyptus and Versuche mit zwei unterschiedlichen Eucalyptusarten (in German). Das papier 3:476–490
17. Luce GE (1970) The physics and chemistry of wood pulp fibers. In: STAP No. 8, TAPPI, New York, p 278
18. Barefoot AC, Hitchings RG, Ellwood EL (1964) Wood character-istics and kraft paper properties of four selected loblolly pines. TAPPI J 47:343–356
19. Moses LE (1952) A two-sample test. Psychometrika 17:234–247 20. Ona T, Sonoda T, Ito K, Shibata M (1995) Studies on decision of
selection indexes for quality breeding of eucalypt wood (I).
Within-tree variations and the positions representing the whole-Within-tree values of polysaccharides contents on E. camaldulensis and E. globulus (in Japanese). Jpn TAPPI 49:724–734
21. Ohshima J, Yokota S, Yoshizawa N, Ona T (2003) Within-tree variation of detailed fibre morphology and its position representing the whole-tree value in Eucalyptus camaldulensis and E. globulus. Appita J 56:476–482