www.j-sens-sens-syst.net/5/179/2016/ doi:10.5194/jsss-5-179-2016
© Author(s) 2016. CC Attribution 3.0 License.
High-temperature stable indium oxide photonic crystals:
transducer material for optical and resistive gas sensing
Sabrina Amrehn, Xia Wu, and Thorsten Wagner
Department of Chemistry, University of Paderborn, Paderborn, Germany
Correspondence to:Thorsten Wagner (thorsten.wagner@upb.de)
Received: 9 November 2015 – Revised: 7 March 2016 – Accepted: 22 April 2016 – Published: 25 May 2016
Abstract. Indium oxide (In2O3) inverse opal is a promising new transducer material for resistive and optical gas sensors. The periodically ordered and highly accessible pores of the inverse opal allow the design of resistive sensors with characteristics independent of structure limitations, such as diffusion effects or limited conductivity due to constricted crosslinking. Additionally the photonic properties caused by the inverse opal structure can be utilized to read out the sensors’ electronical state by optical methods. Typically semiconducting sensors are operated at high temperatures (> 300◦C). To maintain a good thermal stability of the transducer material during operation is a minimum requirement. We present results on the synthesis and investigation of the structural stability of the In2O3inverse opal structure up to a temperature of 550◦C (limit of substrate material). As will be shown, their optical properties are maintained with only slight shifts of the photonic band gaps which can be explained by the results from the structural characterization using X-ray diffraction and electron microscopy combined with optical simulations.
1 Introduction
Indium oxide is not only known as a sensing material for re-sistive semiconducting gas sensors for the detection of NO2, O3, ethanol, hydrogen or CO (Ivanovskaya et al., 2001; Wag-ner et al., 2011, 2013; Takada et al., 1993; Zheng et al., 2009; Martin et al., 2004; Yamaura et al., 1996). Because of its op-tical properties it is also utilized for transparent conductors (typically doped with tin, ITO) for electronic components such as flat screen displays, solar cells and LEDs (Lewis and Paine, 2000; Kim et al., 1998).
The combination of these two properties, namely the gas sensitivity and the transparency in the visible regime com-bined with its high refractive index, makes indium oxide an interesting candidate for building optical transducers for gas sensors. Periodically ordered nanostructures of dielectric ma-terials with a periodicity in the order of the wavelength of in-terested electromagnetic waves show interesting new, struc-ture related optical properties. Therefore these strucstruc-tures are commonly referred to as photonic crystals (Joannopoulos et al., 1997). The most prominent feature of a photonic crystal is its photonic band gap. Light of certain wavelengths cannot propagate along one (stop band) or all (complete band gap)
directions of the photonic crystal. Photons with the energy within the photonic band gap region are reflected. Therefore, the photonic crystals operating in visible range could show intense color impressions. The position and size of the band gap are determined by structure parameters (e.g., periodicity, symmetry, geometry, filling fraction) and the refractive index contrast between the wall material and the fluid in the pore (Joannopoulos et al., 1997). Variation of one of these proper-ties can be observed by a change in the reflectance spectra.
Photonic crystals can be synthesized with different meth-ods, e.g., electron beam lithography (Cheng and Scherer, 1995), direct laser writing (Deubel et al., 2004) or laser holography (Miklyaev et al., 2003).
telecommu-nications; but for most sensing applications the reflectance at the photonic band gap of these chemically prepared pho-tonic crystals is high enough to be used as an optical signal for sensing. So the advantage of a fast and cheap synthesis combined with the possibility of scaling up for mass produc-tion allows this method to find its own niches of applicaproduc-tion where extremely high structural quality is not required.
As for sensing applications, a typical sensing mechanism of photonic crystals is to optically read out the change of their reflection spectra resulting from the change of their refractive index contrast between the solid phase and the introduced fluids (Nair and Vijaya, 2010). This mechanism can be used, for example, to detect liquids with different refractive indices (Amrehn et al., 2015). Another typical mechanism is based on the reaction of the detected species with the solid phase itself, inducing a variation of electronic and optical properties of the photonic crystals (Xie et al., 2012).
Besides sensors utilizing the inverse opal structure for op-tical readout also resistive type sensors take some advantage of the highly accessible pores of the inverse opal. The struc-ture allows the design of sensing layers with characteristics independent of structure limitations such as diffusion effects or limited conductivity due to constricted crosslinking (Scott et al., 2001).
As for some special sensing applications, such as sensors operating at high temperature (above 500◦C), remote sens-ing ussens-ing optical readout of photonic crystals is of special interest. Because of remote sensing there is no need for the wire connection, which may break down at high temperature, between the transducer and the optical devices for measur-ing the signal change. Since the optical signal of a photonic crystal is caused by its structure, any degradation of structure at high temperature can be detected by the optical devices, which is difficult to be realized for sensors based on other porous materials.
Despite of all these advantages for photonic crystals used as sensors at high temperature, the thermal stability of the photonic crystals needs to be tested before they are applied to this new type of sensor concept. In this paper, indium oxide is synthesized in the inverse opal structure and heat treated at different temperatures. Afterwards structural changes and the corresponding optical properties changes are investigated, to evaluate the potential for indium oxide with the inverse opal structure for high temperature sensing applications.
2 Experimental
The indium oxide inverse opal structures in this study are prepared utilizing a modified three-step version (Fig. 1) of a literature-known, template-based synthesis protocol (Stein et al., 2008). In the first step, monodisperse polymethyl-methacrylat (PMMA) spheres are synthesized by surfactant-free emulsion polymerization. Controlled deposition of these spheres (second step) leads to artificial opals which are, in
Figure 1.Scheme of the inverse opal synthesis by casting a PMMA opal: the PMMA spheres are deposited onto a glass slide at 60◦C, and then the opal pores are filled with an indium nitrate solution. This composite is dried, the indium nitrate is thermally converted to indium oxide and the PMMA template is removed by combustion.
the third step, used as rigid structure matrices for the casting of the indium oxide inverse opal, which results from thermal conversion of an infiltrated indium precursor species and re-moval of the matrix.
To investigate the thermal stability of indium oxide in the inverse opal structure, the photonic band gap position (opti-cal spectroscopy), the crystallite size (powder X-ray diffrac-tion) and the structure of the indium oxide films (electron mi-croscopy) are compared before and after heat treatment. The temperature limit of this investigation is given by the glass transition of the glass slides as substrates (550◦C).
2.1 Synthesis
The polymethylmethacrylat (PMMA) spheres were synthe-sized by surfactant-free emulsion polymerization (Egen and Zentel, 2004), this leads to monodisperse spheres. A to-tal of 400 mL water was heated to reflux in nitrogen atmo-sphere. After stopping the nitrogen flow, methylmethacry-lat (21.3 mL, 0.5 mol L−1, Merck, 99 %) and ethylene glycol dimethacrylat, (0.57 mL, Merck, 97.5 %) as a crosslinking agent, were destabilized by filtrating with Al2O3and added to the flask. The mixture was stirred for 10 min (300 rpm). K2S2O8 (27 mg, Bayer) was dissolved in 1 mL water and added. The mixture was stirred for 2 h at 100◦C, then the flask was opened and the mixture cooled to room temper-ature. By filtering the mixture through a paper filter, large aggregates were removed.
For the opal template structure preparation, microscopy slides were cleaned with ethanol and acetone, then heated up to 60◦C on a heating plate. A total of 40 µL of the PMMA dispersion was placed on the slide with a microliter pipette and the solvent was removed by evaporation at 60◦C.
2.2 Thermal stability tests
The optical and structural change of the indium oxide in-verse opal films before and after each heat treatment step were characterized with a modified Fourier transform in-frared spectrometer with wavelength extension to the visi-ble regime (FTIR-vis) and with the X-ray diffraction method, respectively. The heat treatment was performed in an incin-eration furnace under air. The heating rate was 5◦C min−1, the dwell time was 5 h and the tested temperatures were 350, 400, 450, 500 and 550◦C. For each temperature, a fresh sample was prepared to avoid the superposition of time-dependent aging effects. The sample annealed at 550◦C was again tested after characterization at 550◦C for 72 h to inves-tigate the influence of prolonged heating on the stability. Be-fore this additional heating step the sample was cooled down slowly over 24 h to reduce unwanted effects by thermal stress and maintain comparability with the other samples. To gain some information on reproducibility, an additional series of samples was synthesized and annealed at 550◦C for 72 h.
2.3 Characterization
The reflectance spectra were recorded with a Vertex 70 FTIR spectrometer under the Hyperion 1000 light micro-scope (Bruker) modified with aluminum mirrors and a xenon light source to extend the wavelength range to visible regime (referred to as FTIR-vis). A silicon wafer with known re-flectance was used as a reference for normalization to ob-tain the absolute reflectance of samples. For every sample, four measurement spots were randomly chosen and their re-flectance was averaged. Gauss fit was used for determination of the reflectance maximum. The scanning electron micro-scope (SEM) images were taken with a Zeiss Neon 40. The powder X-ray diffraction (PXRD) patterns were recorded with a D8 Advance (Bruker). The X-rays have a wavelength of 0.154 nm, generated by a CuKα-tube. The measurement range was from 20 to 70◦2θwith a step size of 0.02◦and an integration time of 3 s. The crystallite size is calculated with the Scherrer equation. Therefore the full width at half maxi-mum and the peak maximaxi-mum of the (222) peak is evaluated with Lorentzian fit; the shape factor is 0.94.
2.4 Simulation
The photonic band structures of both the inverse opal struc-ture and rod strucstruc-ture were calculated using a free software package “MIT Photonic-Bands” (MPB 1.4.2). MPB calcu-lates fully vectorial eigenmodes of Maxwell’s equations with periodic boundary conditions by preconditioned conjugate-gradient minimization of the block Rayleigh quotient in a planewave basis (Johnson and Joannopoulos, 2001). The structural model of the inverse opal structure is constructed by placing air spheres in the lattice points of fcc structure and filling the complementary solid phase with In2O3 with the refractive index of 1.85 taken from literature (Senthilkumar
Figure 2.Optical microscope images from an as-synthesized in-dium oxide film (left) and after annealing at 550◦C for 77 h (double heated for 5+72 h, see text) (right) at the same location of the same sample.
and Vickraman, 2010). The dispersion and absorption of the light in visible range is assumed to be negligible. The radius of the air sphere is varied to model the structure with differ-ent volume fractions of the solid phase varying from 1.8 to 62.0 %. The rod structure is still an fcc structure. This struc-ture is constructed by connecting the octahedral and tetra-hedral interstitial sites in the conventional unit cell of fcc structure by rods to form eight tetrahedral bonded structures in the unit cell, which corresponds to two tetrahedral boned structures in the fcc primitive cell. The rod is an ideal struc-tural motif to model the materials connecting the interstitial sites, where the detailed surface roughness and topology as observed in SEM is simplified.
These rods are filled with In2O3with the same refractive index as in the inverse opal structure. The radius of the rod is varied to vary the volume fraction of the solid phase from 4.7 to 47.7 %. For the simulation of both structural models, the grid resolution is 32 pixels per basis vector in a given direction. The mesh size used to average the refractive in-dex at each grid point is set to be 7. At eachkpoint of high symmetry, 10 bands are calculated. The stop gaps along0-L direction, which corresponds to theh111isurface normal of the real photonic crystal, are used to evaluation. The result-ing photonic band structure diagram in frequency is calcu-lated into a diagram in wavelength for the specific photonic crystals synthesized here with a lattice constant of 339 nm.
3 Results and discussion
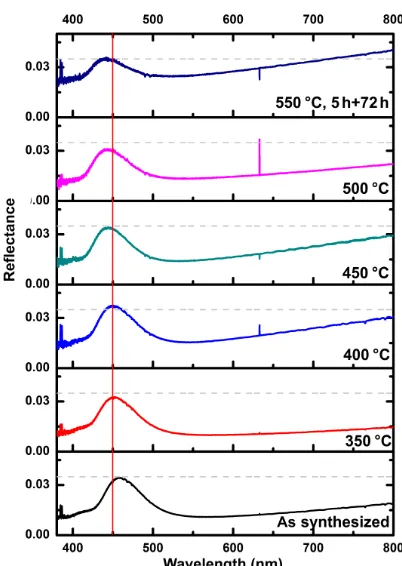
Figure 3.Reflectance spectra of the indium oxide inverse opals: average of the spectra before heat treatment, and spectra after heat treatments at different temperatures. The grey horizontal line marks the maximum reflectance value of 3.5 % after 77 h treatment at 550◦C. The vertical red line at 450 nm serves as a guide for the eye to recognize the shift of the maximum intensity.
characterization of the indium oxide inverse opal films before and after heat treatment (Fig. 3) reveals reflection bands with maxima between 446 and 466 nm (corresponding to blue). Since there is no such reflection observed in nonstructured indium oxide films and the wavelength range corresponds to the results of theoretical simulations (see later) this color is taken as a strong evidence for (i) the successful casting of the inverse opal structure and (ii) the conservation of the framework after heat treatment. Figure 3 also shows the evo-lution of the maximum reflectance. As can be seen, it is con-served (ca. 3.5 %) throughout the heat treatment. This im-plies that (i) the size of the ordered regions is conserved, (ii) the position and size of the macroscopic cracks remains constant and (iii) there is no large change of refractive index of the In2O3. However, especially after the prolonged 550◦C treatment there is a strong increase in the background re-flectance. In principle, the background reflectance is caused by the opal–substrate interface. Therefore we assume that this strong increase is due to changes of the utilized glass substrates which, at 550 ◦C, is close to the glass transition temperature.
A more detailed analysis of the position of the reflectance maximum (Fig. 4) reveals a shift to shorter wavelengths.
Be-Figure 4.Reflectance maximum after heat treatments at different temperatures. Error bars: standard deviation of the mean value of the measurement of five different spots on each sample. Values were measured from 6 samples for the cases of both as-synthesized and 72 h treatment, and the rest of the values were measured from 2 samples for each case.
fore the heat treatment of the indium oxide the mean value of the band gap maximum for the different samples is 454 nm. After the heat treatment the reflectance maximum shifts e.g., to 449 nm after the 550◦C treatment for the 5 h treated sam-ples. However, as discussed before, the absolute value of the reflectance of the indium oxide photonic crystal does not de-crease. For the samples treated for 72 h, a stronger change in the reflectance peak position is observed. As will be dis-cussed below, this is most likely due to the thinning of the inverse opal framework by diffusion of an indium species into gas phase. For later applications this has to be evaluated more carefully in the context of the targeted working condi-tions. Especially the oxygen concentration in the surrounding atmosphere will have a strong impact on the diffusion behav-ior.
Summarizing the results from the optical characterization it can be concluded that indium oxide inverse opals are a ther-mally stable transducers for high-temperature applications in the range of 550◦C for a limited timespan (72 h) since their optical properties are preserved. For lower temperature as e.g., 500◦C it is assumed that even hundreds of hours can be achieved according to Arrhenius law, since the processes which lead to the degradation of the material are thermally activated.
Figure 5.PXRD data: average of the as-synthesized samples and after heat treatments at different temperatures.
Figure 6.Crystallite sizes derived from the (222) peaks using the Scherrer equation for samples before and after heat treatment. Error bars: standard deviation of the mean value of the crystallite size of 12 different “as-synthesized” samples.
by the electron beam evaporation method (Senthilkumar and Vickraman, 2010).
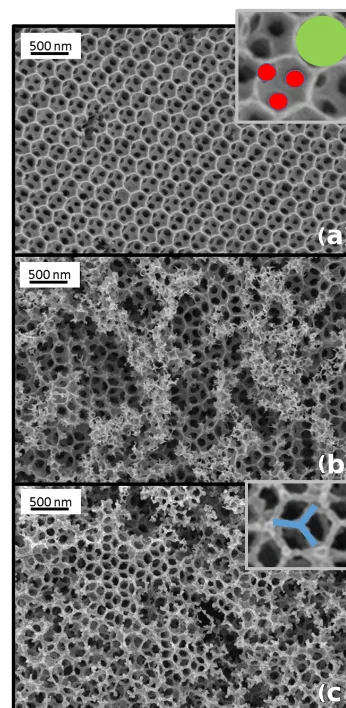
As the position of the stop band is strongly affected by the periodicity of the inverse opal structure, SEM analysis was carried out. Figure 7 shows the evolution of the structure af-ter different temperature treatments. Contrary to the expected change in periodicity, which was not observed, the periodic-ity remains stable at about 240 nm (distance between the cen-ters of two neighboring pores), but there are strong variations in the pore shape to be observed. The as-synthesized samples show a typical nanocast inverse opal structure with spherical pores interconnected by circular windows (Fig. 7a, spheri-cal pore marked in green, windows in red). For the 450◦C treated sample the window size is increased (Fig. 7b) and after 550◦C the windows are widened in such a way that the inverse opal framework is formed by a rod-type structure (Fig. 7c).
Compared to the as-synthesized sample, which shows a smooth surface in the SEM, the indium oxide annealed at
Figure 7.SEM images of the inverse opal structures: as synthe-sized(a), annealed at 450◦C(b) and at 550◦C for 5+72 h (c). Insets show zoomed out region of(a)and(c)with spherical pore marked in green, windows connecting pores in red and rods form-ing after 550◦C treatment in blue.
Figure 8.Simulated mid-gap wavelengths for indium oxide in the inverse opal structure and the after annealing rod-type structure (structural model as inset) at different volume fractions of solid phase, the dashed lines show the measured reflectance maxima.
is about twice the sample thickness in the case of a thin sheet sample (Gottstein, 2004). This effect may explain the cease of grain growth after prolonged heat treatment (72 h) at high temperature (550◦C) (Fig. 6). However, to further prove this, prolonged treatments have to be carried out.
We consider Ostwald ripening and surface diffusion to be the dominating mechanisms which might lead to the for-mation of the new rod-type structure. Ostwald ripening is driven by indium oxide vapor pressure difference at the highly curved window margins (high pressure) and at the less curved surface of rods (low pressure). The indium oxide evaporates from the margin and condenses on the rods. Sur-face diffusion (mass transfer diffusion) can also occur since the surfaces of as-synthesized inverse opal wall structures most probably contain many surface defects, and therefore allow the formation of mobile adparticles to transfer mate-rial.
To test if these structural changes due to heat treatment might be responsible for the observed blueshift of the re-flectance maxima, simulations of the photonic band struc-tures of the as-synthesized sphere-type as well as of the rod-type structure have been carried out utilizing MPB (Johnson and Joannopoulos, 2001). Results (Fig. 8) show a band gap of the mid-gap wavelength of 460 nm (the same as the average wavelength of the reflection maxima of the as-synthesized samples) would be opened for the inverse opal structure when the volume fraction of indium oxide is assumed to be 19 %. Given the shrinkage of materials during the casting process, this smaller volume fraction is considered to be a reasonable and close-to-reality volume fraction of the solid phase in the as-synthesized inverse opal structure, instead of 26 % for the ideal case of face-centered cubic close pack-ing. For the very same volume fraction, the simulation
re-sults show that the band gap blueshifts by 2 nm (from 460 to 458 nm) from sphere-type to rod-type structure. This theo-retical blueshift qualitatively agrees well with the experimen-tally observed shift in the same direction, but the amount of the measured shift is larger (21 nm). However, the simulation results show that loss in indium oxide mass also will have a strong impact on the position of the reflectance maximum. A reduction of the solid volume fraction by about 7 %, proba-bly due to evaporation of the indium oxide, can lead to the observed shift to 433 nm.
Summarizing the results of the SEM, XRD characteriza-tions and the photonic band structure simulacharacteriza-tions it can be concluded that the structural change from sphere-type to rod-type in combination with a 7 % mass loss can explain the observed changes in optical properties. However, this theo-retical estimation is only accurate under the assumption that the refractive index of indium oxide remains constant. At the current stage, it is difficult to measure the refractive index change of the inverse opal films as a porous material after the heat treatment. In the literature, it was reported that the re-fractive index of In2O3film deposited by electron beam evap-oration increases as the temperature increases, which may be attributed to the improved crystallinity, and the changes of the packing density and porosity of the film after anneal-ing (Senthilkumar and Vickraman, 2010). Since this synthe-sis method is completely different from the one used in the present study, it is difficult to estimate whether the similar trend of refractive index change occurs here. In case of in-creased refractive index after annealing, the expected mass loss which can lead to the observed blueshift should be larger than 7 %.
4 Conclusions
sensors with characteristics independent of structure limita-tions.
Acknowledgements. We thank the Federal Ministry of Educa-tion and Research (BMBF, 13N12969) for financial support.
Edited by: J. Zosel
Reviewed by: two anonymous referees
References
Amrehn, S., Wu, X., Schumacher, C., and Wagner, T.: Photonic crystal-based fluid sensors: Toward practical application, Phys. Status Solidi A, 212, 1266–1272, doi:10.1002/pssa.201431875, 2015.
Cheng, C. C. and Scherer, A.: Fabrication of photonic band-gap crystals, J. Vac. Sci. Technol. B, 13, 2696–2700, doi:10.1116/1.588051, 1995.
Deubel, M., von Freymann, G., Wegener, M., Pereira, S., Busch, K., and Soukoulis, C. M.: Direct laser writing of three-dimensional photonic-crystal templates for telecommunications, Nat. Mater., 3, 444–447, doi:10.1038/nmat1155, 2004.
Egen, M. and Zentel, R.: Surfactant-Free Emulsion Polymeriza-tion of Various Methacrylates: Towards Monodisperse Colloids for Polymer Opals, Macromol. Chem. Phys., 205, 1479–1488, doi:10.1002/macp.200400087, 2004.
Gottstein, G.: Physical Foundations of Materials Science, Springer Berlin Heidelberg, Berlin, Heidelberg, ISBN 978-3-662-09291-0, 2004.
Ivanovskaya, M., Gurlo, A., and Bogdanov, P.: Mechanism of O3
and NO2detection and selectivity of In2O3sensors, Proceedings
of the 8th International Meeting on Chemical Sensors IMCS-8 – Part 2, 77, 264–267, doi:10.1016/S0925-4005(01)0070IMCS-8-0, 2001.
Joannopoulos, J. D., Villeneuve, P. R., and Fan, S.: Photonic crystals: putting a new twist on light, Nature, 386, 143–149, doi:10.1038/386143a0, 1997.
Johnson, S. and Joannopoulos, J.: Block-iterative frequency-domain methods for Maxwell’s equations in a planewave basis, Opt. Ex-press, 8, 173–190, doi:10.1364/OE.8.000173, 2001.
Kim, J. S., Granström, M., Friend, R. H., Johansson, N., Salaneck, W. R., Daik, R., Feast, W. J., and Cacialli, F.: Indium–tin oxide treatments for single- and double-layer polymeric light-emitting diodes: The relation between the anode physical, chemical, and morphological properties and the device performance, J. Appl. Phys., 84, 6859–6870, doi:10.1063/1.368981, 1998.
Lewis, B. G. and Paine, D. C.: Applications and Processing of Transparent Conducting Oxides, MRS Bulletin, 25, 22–27, doi:10.1557/mrs2000.147, 2000.
Martin, L. P., Pham, A.-Q., and Glass, R. S.: Electrochemical hydro-gen sensor for safety monitoring, Solid State Ionics, 175, 527– 530, doi:10.1016/j.ssi.2004.04.042, 2004.
Miklyaev, Y. V., Meisel, D. C., Blanco, A., von Freymann, G., Busch, K., Koch, W., Enkrich, C., Deubel, M., and Wegener, M.: Three-dimensional face-centered-cubic photonic crystal tem-plates by laser holography: fabrication, optical characterization, and band-structure calculations, Appl. Phys. Lett., 82, 1284– 1286, doi:10.1063/1.1557328, 2003.
Nair, R. V. and Vijaya, R.: Photonic crystal sensors: An overview, Prog. Quant. Electron., 34, 89–134, doi:10.1016/j.pquantelec.2010.01.001, 2010.
Scott, R. W. J., Yang, S. M., Chabanis, G., Coombs, N., Williams, D. E., and Ozin, G. A.: Tin Dioxide Opals and Inverted Opals: Near-Ideal Microstructures for Gas Sensors, Adv. Mater., 13, 1468–1472, doi:10.1002/1521-4095(200110)13:19<1468::AID-ADMA1468>3.0.CO;2-O, 2001.
Senthilkumar, V. and Vickraman, P.: Annealing temperature depen-dent on structural, optical and electrical properties of indium ox-ide thin films deposited by electron beam evaporation method, Curr. Appl. Phys., 10, 880–885, doi:10.1016/j.cap.2009.10.014, 2010.
Stein, A., Li, F., and Denny, N. R.: Morphological Control in Colloidal Crystal Templating of Inverse Opals, Hierarchical Structures, and Shaped Particles, Chem. Mater., 20, 649–666, doi:10.1021/cm702107n, 2008.
Takada, T., Suzuki, K., and Nakane, M.: Highly sensitive ozone sen-sor, Sensor. Actuat. B-Chem., 13, 404–407, doi:10.1016/0925-4005(93)85412-4, 1993.
Wagner, T., Hennemann, J., Kohl, C.-D., and Tiemann, M.: Photo-catalytic ozone sensor based on mesoporous indium oxide: Influ-ence of the relative humidity on the sensing performance, Proc. 7th International Workshop on Semiconductor Gas Sensors, 520, 918–921, doi:10.1016/j.tsf.2011.04.181, 2011.
Wagner, T., Kohl, C.-D., Malagù, C., Donato, N., Latino, M., Neri, G., and Tiemann, M.: UV light-enhanced NO2sensing by
meso-porous In2O3: Interpretation of results by a new sensing model, Selected Papers from the 14th International Meeting on Chemi-cal Sensors, 187, 488–494, doi:10.1016/j.snb.2013.02.025, 2013. Xie, Z., Xu, H., Rong, F., Sun, L., Zhang, S., and Gu, Z.-Z.: Hydro-gen activity tuning of Pt-doped WO3photonic crystal, Thin Solid
Films, 520, 4063–4067, doi:10.1016/j.tsf.2012.01.027, 2012. Yamaura, H., Jinkawa, T., Tamaki, J., Moriya, K., Miura, N.,
and Yamazoe, N.: Indium oxide-based gas sensor for selec-tive detection of CO, Sensor. Actuat. B-Chem., 36, 325–332, doi:10.1016/S0925-4005(97)80090-1, 1996.
Zheng, W., Lu, X., Wang, W., Li, Z., Zhang, H., Wang, Y., Wang, Z., and Wang, C.: A highly sensitive and fast-responding sen-sor based on electrospun In2O3nanofibers, Sensor. Actuat.