RESEARCH
Differentially mutated subnetworks
discovery
Morteza Chalabi Hajkarim
1, Eli Upfal
2and Fabio Vandin
3*Abstract
Problem: We study the problem of identifying differentially mutated subnetworks of a large gene–gene interaction network, that is, subnetworks that display a significant difference in mutation frequency in two sets of cancer samples. We formally define the associated computational problem and show that the problem is NP-hard.
Algorithm: We propose a novel and efficient algorithm, called DAMOKLE, to identify differentially mutated works given genome-wide mutation data for two sets of cancer samples. We prove that DAMOKLE identifies subnet-works with statistically significant difference in mutation frequency when the data comes from a reasonable genera-tive model, provided enough samples are available.
Experimental results: We test DAMOKLE on simulated and real data, showing that DAMOKLE does indeed find subnetworks with significant differences in mutation frequency and that it provides novel insights into the molecular mechanisms of the disease not revealed by standard methods.
Keywords: Network analysis, Somatic mutations, Differential analysis
© The Author(s) 2019. This article is distributed under the terms of the Creative Commons Attribution 4.0 International License (http://creat iveco mmons .org/licen ses/by/4.0/), which permits unrestricted use, distribution, and reproduction in any medium, provided you give appropriate credit to the original author(s) and the source, provide a link to the Creative Commons license, and indicate if changes were made. The Creative Commons Public Domain Dedication waiver (http://creat iveco mmons .org/ publi cdoma in/zero/1.0/) applies to the data made available in this article, unless otherwise stated.
Introduction
The analysis of molecular measurements from large col-lections of cancer samples has revolutionized our under-standing of the processes leading to a tumour through somatic mutations, changes of the DNA appearing dur-ing the lifetime of an individual [1]. One of the most important aspects of cancer revealed by recent large cancer studies is inter-tumour genetic heterogeneity: each tumour presents hundreds-thousands mutations and no two tumours harbour the same set of DNA mutations [2].
One of the fundamental problems in the analysis of somatic mutations is the identification of the handful of driver mutations (i.e., mutations related to the disease) of each tumour, detecting them among the thousands or tens of thousands that are present in each tumour genome [3]. Inter-tumour heterogeneity renders the identification of driver mutations, or of driver genes (genes containing driver mutations), extremely difficult, since only few genes are mutated in a relatively large
fraction of samples while most genes are mutated in a low fraction of samples in a cancer cohort [4].
Recently, several analyses (e.g, [5, 6]) have shown that interaction networks provide useful information to dis-cover driver genes by identifying groups of interacting genes, called pathways, in which each gene is mutated at relatively low frequency while the entire group has one or more mutations in a significantly large fraction of all samples. Several network-based methods have been developed to identify groups of interacting genes mutated in a significant fraction of tumours of a given type and have been shown to improve the detection of driver genes compared to methods that analyze genes in isolation [5, 7–9].
The availability of molecular measurements in a large number of samples for different cancer types have also allowed comparative analyses of mutations in cancer [5, 10, 11]. Such analyses usually analyze large cohorts of dif-ferent cancer types as a whole employing methods to find genes or subnetworks mutated in a significant fraction of tumours in one cohort, and also analyze each cancer type individually, with the goal to identify:
Open Access
*Correspondence: [email protected]
3 Department of Information Engineering, University of Padova, Padova, Italy
1. pathways that are common to various cancer types; 2. pathways that are specific to a given cancer type.
For example, [5] analyzed 12 cancer types and identified subnetworks (e.g., a TP53 subnetwork) mutated in most cancer types as well as subnetworks (e.g., a MHC sub-network) enriched for mutations in one cancer type. In addition, comparative analyses may also be used for the identification of mutations of clinical relevance [12]. For example: comparing mutations in a patients that responded to a given therapy with mutations in patients (of the same cancer type) that did not respond to the same therapy may identify genes and subnetworks asso-ciated with response to therapy; comparing mutations in patients whose tumours metastasized with mutations in patients whose tumours did not metastasize may identify mutations associated with the insurgence of metastases.
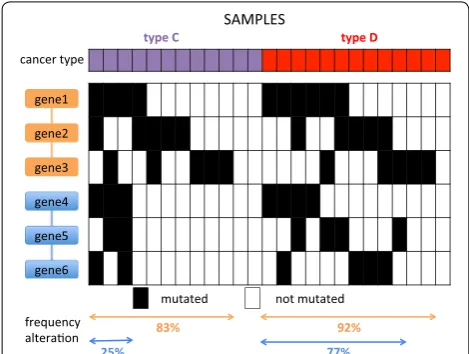
Pathways that are significantly mutated only in a specific cancer type may not be identified by analyz-ing one cancer type at the time or all samples together (Fig. 1), but, interestingly, to the best of our knowledge no method has been designed to directly identify sets of interacting genes that are significantly more mutated in a set of samples compared to another. The task of finding such sets is more complex than the identification of sub-networks significantly mutated in a set of samples, since subnetworks that have a significant difference in muta-tions in two sets may display relatively modest frequency of mutation in both set of samples, whose difference can
be assessed as significant only by the joint analysis of both sets of samples.
Related work
Several methods have been designed to analyze different aspects of somatic mutations in a large cohort of can-cer samples in the context of networks. Some methods analyze mutations in the context of known pathways to identify the ones significantly enriched in mutations (e.g., [13]). Other methods combine mutations and large inter-action networks to identify cancer subnetworks [5, 14, 15]. Networks and somatic mutations have also been used to prioritarize mutated genes in cancer [7, 8, 16– 18] and for patients stratification [6, 19]. Some of these methods have been used for the identification of com-mon mutation patterns or subnetworks in several cancer types [5, 10], but to the best of our knowledge no method has been designed to identify mutated subnetworks with a significant difference in two cohorts of cancer samples.
Few methods studied the problem of identifying sub-networks with significant differences in two sets of can-cer samples using data other than mutations. [20] studied the problem of identifying optimally discriminative subnetworks of a large interaction network using gene expression data. Mall et al. [21] developed a procedure to identify statistically significant changes in the topology of biological networks. Such methods cannot be readily applied to find subnetworks with significant difference in mutation frequency in two sets of samples. Other related work use gene expression to characterize different cancer types: [22] defined a pathway-based score that clusters samples by cancer type, while [23] defined pathway-based features used for classification in various settings, and several methods [24–28] have been designed for finding subnetworks with differential gene expression.
Our contribution
In this work we study the problem of finding subnet-works with frequency of mutation that is significantly different in two sets of samples. In particular, our con-tributions are fourfold. First, we propose a combinato-rial formulation for the problem of finding subnetworks significantly more mutated in one set of samples than in another and prove that such problem is NP-hard. Sec-ond, we propose DifferentiAlly Mutated subnetwOrKs anaLysis in cancEr (DAMOKLE), a simple and efficient algorithm for the identification of subnetworks with a significant difference of mutation in two sets of samples, and analyze DAMOKLE proving that it identifies sub-networks significantly more mutated in one of two sets of samples under reasonable assumptions for the data. Third, we test DAMOKLE on simulated data, verifying Fig. 1 Identification of subnetworks with significant difference in
mutation frequency in two set of samples C,D . The blue subnetwork is significantly more mutated in D than in C , but it is not detected by
experimental that DAMOKLE correctly identifies sub-networks significantly more mutated in a set of samples when enough samples are provided in input. Fourth, we test DAMOKLE on large cancer datasets compris-ing two cancer types, and show that DAMOKLE identi-fies subnetworks significantly associated with one of the two types which cannot be identified by state-of-the-art methods designed for the analysis of one set of samples.
Methods and algorithms
This section presents the problem we study, the algo-rithm we propose for its solution, and the analysis of our algorithm. In particular, "Computational problem" section formalizes the computational problem we consider; " Algo-rithm" section presents DifferentiAlly Mutated subnet-wOrKs anaLysis in cancEr (DAMOKLE), our algorithm for the solution of the computational problem; "Analysis of DAMOKLE" section describes the analysis of our algo-rithm under a reasonable generative model for mutations; "Statistical significance of the results" section presents a formal analysis of the statistical significance of subnetworks obtained by DAMOKLE; and "Permutation testing" section describes two permutation tests to assess the significance of the results of DAMOKLE for limited sample sizes.
Computational problem
We are given measurements on muta-tions in m genes G= {1,. . .,m} on two sets
C= {c1,. . .,cnC},D= {d1,. . .,dnD} of samples. Such
measurements are represented by two matrices C and D, of dimension m×nC and m×nD , respectively, where nC (resp., nD ) is the number of samples in C (resp., D ). C(i,j)=1 (resp., D(i,j)=1 ) if gene i is mutated in the j-th sample of C (resp., D ) and C(i,j)=0 (resp., D(i,j)=0 ) otherwise. We
are also given an (undirected) graph G=(V,E) , where ver-tices V = {1,. . .,m} are genes and (i,j)∈E if gene i inter-acts with gene j (e.g., the corresponding proteins interact).
Given a set of genes S⊂G , we define the indicator function cS(ci) with cS(ci)=1 if at least one of the genes of S is mutated in sample ci , and cS(ci)=0 otherwise. We
define cS(di) analogously. We define the coverage cS(C) of
S in C as the fraction of samples in C for which at least one of the genes in S is mutated in the sample, that is
and, analogously, define the coverage cS(D) of S in D as cS(D)=
nD
i=1cS(di)
nD .
We are interested in identifying sets of genes S, with |S| ≤k , corresponding to connected subgraphs in G and displaying a significant difference in coverage between C and D , i.e., with a high value of |cS(C)−cS(D)| .
cS(C)= nC
i=1cS(ci) nC
We define the differential coverage dcS(C,D) as dcS(C,D)=cS(C)−cS(D).
In particular, we study the following computational problem.
The differentially mutated subnetworks discovery problem: given a value θ with θ ∈ [0, 1] , find all connected subgraphs S of G of size ≤k such that dcS(C,D)≥θ.
Note that by finding sets that maximize dcS(C,D) we identify sets with significantly more mutations in C than in D , while to identify sets with significantly more muta-tions in D than in C we need to find sets maximizing
dcS(D,C) . In addition, note that a subgraph S in the solu-tion may contain genes that are not mutated in C∪D but that are needed for the connectivity of S.
We have the following.
Theorem 1 The differentially mutated subnetworks
dis-covery problem is NP-hard.
Proof The proof is by reduction from the connected maximum coverage problem [14]. In the connected maximum coverage problem we are given a graph G defined on a set V = {v1,. . .,vn} of n vertices, a family
P= {P1,. . .,Pn} of subsets of a universe I (i.e., Pi∈2I ), with Pi being the subset of Icovered by vi∈V and value
k, and we want to find the subgraph C∗= {vi
1,. . .,vik} with k nodes of G that maximizes | ∪kj=1Pij|.
Given an instance of the connected maximum cover-age problem, we define an instance of the differentially mutated subnetworks discovery problem as follows: the set G of genes corresponds to the set V of vertices of G in the connected maximum coverage problem, and the graph G is the same as in the instance of the maximum coverage instance; the set C is given by the set I and the matrix C is defined as Ci,j=1 if i∈Pj , while D= ∅.
Note that for any subgraph S of G, the differen-tial coverage dcD(C,D)=cS(C)−cS(D)=cS(C) and
cS(C)= | ∪g∈SPg|/|I| . Since |I| is the same for all solu-tions, the optimal solution of the differentially mutated subnetworks discovery instance corresponds to the optimal solution to the connected maximum coverage
instance, and viceversa.
Algorithm
We now describe DifferentiAlly Mutated subnetwOrKs anaLysis in cancEr (DAMOKLE), an algorithm to solve the differentially mutated subnetworks discovery prob-lem. DAMOKLE takes in input mutation matrices C and D for two sets C , D of samples, a (gene–gene) interaction graph G, an integer k>0 , and a real value θ ∈ [0, 1] , and returns subnetworks S of G with ≤k vertices and differ-ential coverage dcS(C,D)≥θ . Subnetworks reported by
S while maintaining the connectivity of the subnetwork, |S| ≤k and dcS(C,D)≥θ ). DAMOKLE is described
in Algorithm 1. DAMOKLE starts by considering each edge e= {u,v} ∈E of G with differential coverage
dc{u,v}(C,D)≥θ/(k−1) , and for each such e identifies subnetworks including e to be reported in output using Algorithm 2.
Algorithm 1: DAMOKLE
Input:mutation matricesC, D; gene-gene interaction graphG= (V, E); integerk >0; θ∈[0,1]
Output:maximal connected subgraphs withdcS(C,D)≥θ
1 solutions← ∅;
2 foreach{u, v} ∈E do
3 if dc{u,v}(C,D)≥θ/(k−1)then
4 solutions←solutions∪GetSolutions(E,{u, v});
5 end
6 end
7 returnsolutions;
GetSolutions, described in Algorithm 2, is a recur-sive algorithm that, give a current subgraph S, identifies all maximal connected subgraphs S′,|S′| ≤k , containing S and with dcS′(C,D)≥θ . This is obtained by expanding S one edge at the time and stopping when the number of vertices in the current solution is k or when the addition of no vertex leads to an increase in differential coverage
dcS(C,D) for the current solution S. In Algorithm 2, N(S) refers to the set of edges with exactly one vertex in the set S.
Algorithm 2:GetSolutions
Input:setEof edges of the graph; current subgraph (solution)S Output:maximal connected subgraphs containingS withdcS(C,D)≥θ
1 nextEdges← ∅; 2 foreache∈N(S)do
3 if dcS∪{e}(C,D)≥dcS(C,D)thennextEdges←nextEdges∪{e};
4 end
5 if |nextEdges|= 0OR|S|=kthen 6 if dcS(C,D)≥θthen returnS;
7 end
8 newSols← ∅;
9 foreache∈nextEdgesdo newSols←newSols∪GetSolutions(E,S∪ {e}) ; 10 returnnewSols;
Model
For each gene i∈G= {1, 2, ...,m} there is an a-priori probability pi of observing a mutation in gene i. Let
H ⊂G be the connected subnetwork of up to k genes that
is differentially mutated in samples of C w.r.t. samples of
D . Mutations in our samples are taken from two related distributions. In the “control” distribution F a mutation
in gene i is observed with probability pi independent of
other genes’ mutations. The second distribution FH is analogous to the distribution F but we condition on the event E(H)=“at least one gene in H is mutated in the sample”.
For genes not in H, all mutations come from distribu-tion F. For genes in H, in a perfect experiment with no noise we would assume that samples in C are taken from FH and samples from D are taken from F. However, to
The motivation for design choices of DAMOKLE are provided by the results in the next section.
Analysis of DAMOKLE
The design and analysis of DAMOKLE are based on the following generative model for the underlying biological process.
Let p be the probability that H has at least one mutation in samples from the control model F, p=1−j∈H(1−pj)≈j∈Hpj. Clearly, we are only interested in sets H ⊂G with p≪1.
If we focus on individual genes, the probability gene i is mutated in a sample from D is pi , while the probability that it is mutated in a sample from C is (1−q)pi
1−
j∈H(1−pj)+qpi. Such a gap may be hard to detect with a small number of samples. On the other hand, the probability of E(H) (i.e., of at least one mutation in the set H) in a sample from C is (1−q)+q(1−
j∈H(1−pj))=1−q+qp , while the probability of E(H) in a sample from D is 1−
j∈H(1−pj)=p which is a more significant gap, when p≪1.
The efficiency of DAMOKLE is based on two funda-mental results. First we show that it is sufficient to start the search only in edges with relatively high differential coverage.
Proposition 1 If dcS(C,D)≥θ, then, in the above
generating model, with high probability (asymp-totic in nC and nD )there exist an edge e∈S such that dc{e}(C,D)≥(θ−ǫ)/(k−1),for anyǫ >0.
Proof For a set of genes S′⊂G and a sample z∈C∪D , let Count(S′,z) be the number of genes in S′ mutated in sample z. Clearly, if for all z∈C∪D , we have Count(S,z)=1 , i.e. each sample has no more than one mutation in S, then
Thus, there is a vertex j∗=arg maxj ∈S
nC
i=1Count({j},ci)
nC −
nD
i=1Count({j},di) nD
such that dc{j∗}(C,D)=
nC
i=1Count({j∗},ci)
nC −
nD
i=1Count({j∗},di)
nD ≥θ/k.
Since the set of genes S is connected, there is an edge e=(j∗,ℓ) for some ℓ∈S . For that edge,
For the case when the assumption Count(S,z)=1 for all
z∈C∪D does not hold, let dcS(C,D)=cS(C)−cS(D)=
nC i=1cS(ci)
nC −
nD i=1cS(di)
nD
=
nC i=1
j∈SCount({j},ci)
nC −
nD i=1
j∈SCount({j},di) nD
=
j∈S nC
i=1Count({j},ci)
nC −
nD
i=1Count({j},di) nD
≥θ.
dc{e}(C,D)≥
θ−dc{ℓ}(C,D)
k−1 +dc{ℓ}(C,D)≥
θ
k−1.
Then
and
Since the probability of having more than one mutation in S in a sample from C is at least as high as from a sample from D , we can normalize (similar to the proof of Theo-rem 2 below) and apply Hoeffding bound (Theorem 4.14 in [29]) to prove that
The second result motivates the choice, in Algorithm 2, of adding only edges that increase the score of the cur-rent solution (and to stop if there is no such edge).
Proposition 2 If subgraph S can be partitioned as
S=S′∪ {j} ∪S′′, and dcS′
∪{j}(C,D) <dcS′(C,D)−ppj, then with high probability (asymptotic in nD )dcS\{j}
(C,D) >dcS(C,D).
Proof We first observe that if each sample in D has no more than 1 mutation in S then dcS′∪{j}(C,D) <dcS′(C,D) implies that dc{j}(C,D) <0 , and therefore, under this assumption, dcS\{j}(C,D) >dcS(C,D).
To remove the assumption that a sample has no more than one mutation in S, we need to correct for the frac-tion of samples in D with mutations both in j and S′′ . With high probability (asymptotic in nD ) this fraction is bounded by ppj+ǫ for any ǫ >0 .
Statistical significance of the results
To compute a threshold that guarantees statistical con-fidence of our finding, we first compute a bound on the gap in a non significant set.
Mul(S,C,D)=
nC
i=1
j∈SCount({j},ci)
nC −
nC
i=1cS(ci)
nC
+
nD
i=1Count({j},di)
nD −
nD
i=1cS(di)
nD .
j∈S nC
i=1Count({j},ci)
nC −
nD
i=1Count({j},di)
nD
−Mul(S,C,D)≥θ
dc{e}(C,D)≥
θ+Mul(S,C,D)
k−1 .
Theorem 2 Assume thatSis not a significant set, i.e.,C
andDhave the same distribution onS,then
Proof Let X1,. . .,XnC be independent random variables such that Xi=1/nC if sample ci in C has a mutation in S, otherwise Xi=0 . Similarly, let Y1,. . .,YnD be independ-ent random variables such that Yi= −1/nD if sample di in D has a mutation in S, otherwise Yi =0.
Clearly dcS(C,D)=ni=C1Xi+ni=D1Yi , and since S is not significant EnC
i=1Xi+ nD
i=1Yi
=0.
To apply Hoeffding bound (Theorem 4.14 in [29]), we note that the sum nC
i=1Xi+
nD
i=1Yi has nC vari-ables in the range [0, 1/nC] , and nD variables in the range
[−1/nD, 0] . Thus,
Let Nk be the set of subnetworks under consideration, or the set of all connected components of size ≤k . We use Theorem 2 to obtain guarantees on the statistical significance of the results of DAMOKLE in terms of the Family-Wise Error Rate (FWER) or of the False Discov-ery Rate (FDR) as follows:
• FWER: if we want to find just the subnetwork with significant maximum differential coverage, to bound the FWER of our method by α we use the maximum ǫ such that Nk2e−2ǫ2nCnD/(nC+nD)
≤α.
• FDR: if we want to find several significant subnet-works with high differential coverage, to bound the FDR by α we use the maximum ǫ such that Nk2e−2ǫ2nCnD/(nC+nD)/n(α)
≤α , where n(α) is the number of sets with differential coverage ≥ǫ.
Permutation testing
While Theorem 2 shows how to obtain guarantees on the statistical significance of the results of DAMOKLE by appropriately setting θ , in practice, due to relatively small
sample sizes and to inevitable looseness in the theoretical guarantees, a permutation testing approach may be more effective in estimating the statistical significance of the results of DAMOKLE and provide more power for the identification of differentially mutated subnetworks.
We consider two permutation tests to assess the asso-ciation of mutations in the subnetwork with the high-est differential coverage found by DAMOKLE. The first
Prob(dcS(C,D) > ǫ)≤2e−2ǫ2nCnD/(nC+nD).
Prob(dcS(C,D) > ǫ)≤2e(−2ǫ2)/(nc/n2c+nd/n2D)
=2e−2ǫ2nCnD/(nC+nD).
test assesses whether the observed differential coverage can be obtained under the independence of mutations in genes by considering the null distribution in which each gene is mutated in a random subset (of the same cardinality as observed in the data) of all samples, inde-pendently of all other events. The second test assesses whether, under the observed marginal distributions for mutations in sets of genes, the observed differential cov-erage of a subnetwork can be obtained under the inde-pendence between mutations and samples’ memberships (i.e., being a sample of C or a sample of D ), by randomly permuting the samples memberships.
Let dcS(C,D) be the differential coverage observed on
real data for the solution S with highest differential cov-erage found by DAMOKLE (for some input parameters). For both tests we estimate the p-value as follow:
1. generate N (permuted) datasets from the null distri-bution;
2. run DAMOKLE (with the same input parameters used on real data) on each of the N permuted data-sets;
3. let x be the number of permuted datasets in which DAMOKLE reports a solution with differen-tial coverage ≥dcS(C,D) : then the p-value of S is
(x+1)/(N+1).
Results
We implemented DAMOKLE in Python1 and tested
it on simulated and on cancer data. Our experiments have been conducted on a Linux machine with 16 cores and 256 GB of RAM. For all our experiments we used as interaction graph G the HINT+HI2012 network2, a
combination of the HINT network [30] and the HI-2012 [31] set of protein–protein interactions, previously used in [5]. In all cases we considered only the subnetwork with the highest differential coverage among the ones returned by DAMOKLE. We first present the results on simulated data ("Simulated data" section) and then pre-sent the results on cancer data ("Cancer data" section).
Simulated data
We tested DAMOKLE on simulated data generated as follows. We assume there is a subnetwork S of k genes with differential coverage dcS(C,D)=c . In our
simu-lations we set |C| = |D| =n . For each sample in D , each gene g in G (including genes in S) is mutated with
1 The implementation is available at https ://githu b.com/Vandi nLab/DAMOK
LE.
probability pg , independently of all other events. For sam-ples in C , we first mutated each gene g with probability
pg independently of all other events. We then considered the samples of C without mutations in S, and for each such sample we mutated, with probability c, one gene of S, chosen uniformly at random. In this way c is the expec-tation of the differential coverage dcS(C,D) . For genes in G\S we used mutation probabilities pg estimated from oesophageal cancer data [32]. We considered only value of n≥100 , consistent with sample sizes in most recent cancer sequencing studies. (The latest ICGC data release3
from April 30th , 2018 has data for ≥500 samples for 81% of the primary sites).
The goal of our investigation using simulated data is to evaluate the impact of various parameters on ability
of DAMOKLE to recover S or part of it. In particular, we studied the impact of three parameters: the differen-tial coverage dcS(C,D) of the planted subnetwork S; the number k of genes in S; and the number n of samples in each class. To evaluate the impact of such parameters, for each combination of parameters in our experiments we generated 10 simulated datasets and run DAMOKLE on each dataset with θ =0.01 , recording
1. the fraction of times that DAMOKLE reported S as the solution with the highest differential coverage, and
2. the fraction of genes of S that are in the solution with highest differential coverage found by DAMOKLE.
We first investigated the impact of the differen-tial coverage c=dcS(C,D). We analyzed simulated
a b
c
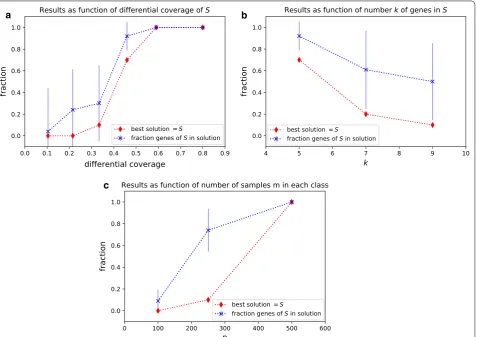
Fig. 2 a Performance of DAMOKLE as a function of the differential coverage dcS(C,D) of subnetwork S. The figure shows (red) the fraction of
times, out of 10 experiments, that the best solution corresponds to S and (blue) the fraction of genes in S that are reported in the best solution by DAMOKLE. For the latter, error bars show the standard deviation on the 10 experiments. n=100 and k=5 for all experiments. b Performance of
DAMOKLE as a function of the number k of genes in subnetwork S. n=100 and dcS(C,D)=0.46 for all experiments. c Performance of DAMOKLE
as a function of the number n of samples in C,D . k=10 and dcS(C,D)=0.46 for all experiments
datasets with n=100 samples in each class, where
k=5 genes are part of the subnetwork S, for values of
c=0.1, 0.22, 0.33, 0.46, 0.6, 0.8 ,. We run DAMOKLE on
each dataset with k=5 . The results are shown in Fig. 2a. For low values of the differential coverage c, with n=100 samples DAMOKLE never reports S as the best solu-tion found and only a small fracsolu-tion of the genes in S are part of the solution reported by DAMOKLE. However, as soon as the differential coverage is ≥0.45 , even with n=100 samples in each class DAMOKLE identifies the entire planted solution S most of the times, and even when the best solution does not entirely corresponds to S, more than 80% of the genes of S are reported in the best solution. For values of c≥0.6 , DAMOKLE always reports the whole subnetwork S as the best solution. Given that many recent large cancer sequencing studies consider at least 200 samples, DAMOKLE will be useful to identify differentially mutated subnetworks in such studies.
We then tested the performance of DAMOKLE as a function of the number of genes k in S. We tested the abil-ity of DAMOKLE to identify a subnetwork S with differ-ential coverage dcS(C,D)=0.46 in a dataset with n=100 samples in both C and D , when the number k of genes in S varies as k=5, 7, 9 . The results are shown in Fig. 2b. As expected, when the number of genes in S increases, the fraction of times S is the best solution as well as the frac-tion of genes reported in the best solufrac-tion by S decreases, and for k=9 the best solution found by DAMOKLE cor-responds to S only 10% of the times. However, even for k=9 , on average most of the genes of S are reported in the best solution by DAMOKLE. Therefore DAMOKLE can be used to identify relatively large subnetworks mutated in a significantly different number of samples even when the number of samples is relatively low.
Finally, we tested the performance of DAMOKLE as the number of samples n in each set C,D increases. In particular, we tested the ability of DAMOKLE to iden-tify a relatively large subnetwork S of k=10 genes with differential coverage dcS(C,D)=0.46 as the number of samples n increases. We analyzed simulated datasets for n=100, 250, 500 . The results are shown in Fig. 2. For n=100 , when k=10 , DAMOKLE never reports S as the best solution and only a small fraction of all genes in S are reported in the solution. However, for n=250 , while DAMOKLE still reports S as the best solution only 10% of the times, on average 70% of the genes of S are reported in the best solution. More interestingly, already for n=500 , DAMOKLE always reports S as the best solution. These results show that DAMOKLE can reliably identify relatively large differentially mutated subnet-works from currently available datasets of large cancer sequencing studies.
Cancer data
We use DAMOKLE to analyze somatic mutations from The Cancer Genome Atlas. We first compared two sim-ilar cancer types and two very different cancer types to test whether DAMOKLE behaves as expected on these types. We then analyzed two pairs of cancer types where differences in alterations are unclear. In all cases we run DAMOKLE with θ =0.1 and obtained p-values with the
permutation tests described in "Permutation testing" section.
Lung cancer
We used DAMOKLE to analyze 188 samples of lung squamous cell carcinoma (LUSC) and 183 samples of lung adenocarcinoma (LUAD). We only considered single nucleotide variants (SNVs)4 and use k =5 . DAMOKLE
did not report any significant subnetwork, in agreement with previous work showing that these two cancer types have known differences in gene expression [33] but are much more similar with respect to SNVs [34].
Colorectal vs ovarian cancer
We used DAMOKLE to analyze 456 samples of colorectal adenocarcinoma (COADREAD) and 496 samples of ovar-ian serous cystadenocarcinoma (OV) using only SNVs.5
For k=5 , DAMOKLE identifies the significant ( p<0.01
according to both tests in "Permutation testing" section) subnetwork APC, CTNNB1, FBXO30, SMAD4, SYNE1 with differential coverage 0.81 in COADREAD w.r.t. OV. APC, CTNNB1, and SMAD4 are members of the WNT signaling and TFG-β signaling pathways. The WNT signaling pathway is one of the cascades that regulates stemness and development, with a role in carcinogenesis that has been described mostly for colorectal cancer [35], but altered Wnt signaling is observed in many other can-cer types [36]. The TFG-β signaling pathway is involved in several processes including cell growth and apoptosis, that is deregulated in many diseases, including COAD-READ [35]. The high differential coverage of the subnet-work is in accordance with COADREAD being altered mostly by SNVs and OV being altered mostly by copy number aberrations (CNAs) [37].
Esophagus‑stomach cancer
We analyzed SNVs and CNAs in 171 samples of esopha-gus cancer and in 347 samples of stomach cancer [32].6
The number of mutations in the two sets is not sig-nificantly different (t-test p= 0.16). We first considered
single genes, identifying TP53 with high ( >0.5 ) differ-ential coverage between the two cancer types. Altera-tions in TP53 have then be removed for the subsequent DAMOKLE analysis. We run DAMOKLE with k=4 with C being the set of stomach tumours and D being the set of esophagus tumours. DAMOKLE identifies the significant ( p<0.01 for both tests in "Permutation
test-ing" section) subnetwork S= {ACTL6A, ARID1A, BRD8,
SMARCB1} with differential coverage 0.26 (Fig. 3a, b). Interestingly, all four genes in the subnetwork identified by DAMOKLE are members of the chromatin organiza-tion machinery recently associated with cancer [38, 39]. Such subnetwork is not reported as differentially mutated in the TCGA publication comparing the two cancer types [32]. BRD8 is only the top-16 gene by differential cover-age, while ACTL6 and SMARCB1 are not among the top-2000 genes by differential coverage. We compared the results obtained by DAMOKLE with the results obtained by HotNet2 [5], a method to identify significantly mutated subnetworks, using the same mutation data and the same interaction network as input: none of the genes in S appeared in significant subnetworks reported by HotNet2.
Diffuse gliomas
We analyzed single nucleotide variants (SNVs) and copy number aberrations (CNAs) in 509 samples of lower grade glioma (LGG) and in 303 samples of glioblastoma multiforme (GBM).7 We considered nonsilent SNVs,
short indels, and CNAs. We removed from the analysis genes with <6 mutations in both classes. By single gene analysis we identified IDH1 with high ( >0.5 ) differen-tial coverage, and removed alterations in such gene for the DAMOKLE analysis. We run DAMOKLE with k=5 with C being the set of GBM samples and D being the set of LGG samples. The number of mutations in C and in D is not significantly different (t-test p= 0.1). DAMOKLE
identifies the significant ( p<0.01 for both tests in
"Per-mutation testing" section) subnetwork S= {CDKN2A, CDK4, MDM2, MDM4, RB1} (Fig. 3c, d). All genes in S are members of the p53 pathway or of the RB pathway. The p53 pathway has a key role in cell death as well as in cell division, and the RB pathway plays a crucial role in cell cycle control. Both pathways are well known glioma cancer pathways [40]. Interestingly, [41] did not report any subnetwork with significant difference in muta-tions between LGG and GBM samples. CDK4, MDM2, MDM4, and RB1 do not appear among the top-45 genes by differential coverage. We compared the results obtained by DAMOKLE with the results obtained by HotNet2. Of the genes in our subnetwork, only CDK4 and CDKN2A are reported in a significantly mutated subnetwork ( p<0.05 ) obtained by HotNet2 analyzing D but not analyzing C , while MDM2, MDM4, and RB1 are not reported in any significant subnetwork obtained by HotNet2.
Conclusion
In this work we study the problem of finding subnetworks of a large interaction network with significant difference in mutation frequency in two sets of cancer samples. This problem is extremely important to identify mutated
a b c d
Fig. 3 Results of DAMOKLE analysis of esophagus tumours and stomach tumours and of diffuse gliomas. a Subnetwork S with significant ( p<0.01 ) differential coverage in esophagus tumours vs stomach tumours (interactions from HINT+HI2012 network). b Fractions of samples with mutations in genes of S in esophagus tumours and in stomach tumours. c Subnetwork S with significant ( p<0.01 ) differential coverage in LGG samples vs GBM samples (interactions from HINT+HI2012 network). d Fractions of samples with mutations in genes of S in LGG samples and GBM samples
7 https ://media .githu buser conte nt.com/media /cBioP ortal /datah ub/maste r/
mechanisms that are specific to a cancer (sub)type as well as for the identification of mechanisms related to clinical features (e.g., response to therapy). We provide a formal definition of the problem and show that the associated computational problem is NP-hard. We design, analyze, implement, and test a simple and efficient algorithm, DAMOKLE, which we prove identifies significant sub-networks when enough data from a reasonable genera-tive model for cancer mutations is provided. Our results also show that the subnetworks identified by DAMOKLE cannot be identified by methods not designed for the comparative analysis of mutations in two sets of samples. We tested DAMOKLE on simulated and real data. The results on simulated data show that DAMOKLE identi-fies significant subnetworks with currently available sam-ple sizes. The results on two large cancer datasets, each comprising genome-wide measurements of DNA muta-tions in two cancer subtypes, shows that DAMOKLE identifies subnetworks that are not found by methods not designed for the comparative analysis of mutations in two sets of samples.
While we provide a first method for the differential analysis of cohorts of cancer samples, several research directions remain. First, differences in the frequency of mutation of a subnetwork in two sets of cancer cohorts may be due to external (or hidden) variables, as for example the mutation rate of each cohort. While at the moment we ensure before running the analysis that no significant difference in mutation rate is present between the two sets, performing the analysis while correcting for possible differences in such confounding variable or in others would greatly expand the applicability of our method. Second, for some interaction networks (e.g., functional ones) that are relatively more dense than the protein–protein interaction network we consider, requir-ing a minimum connectivity (e.g., in the form of fraction of all possible edges) in the subnetwork may be benefi-cial, and the design of efficient algorithms considering such requirement is an interesting direction of research. Third, different types of mutation patterns (e.g., mutual exclusivity) among two set of samples could be explored (e.g., extending the method proposed in [42]). Fourth, the inclusion of additional types of measurements, as for example gene expression, may improve the power of our method. Fifth, the inclusion of noncoding variants in the analysis may provide additional information to be lever-aged to assess the significance of subnetworks.
Authors’ contributions
FV designed the study. FV and EU designed the algorithms. FV and MCH implemented the software and performed the computational analysis. All authors interpreted the results. All authors wrote the manuscript. All authors read and approved the final manuscript.
Author details
1 Biotech Research and Innovation Centre, University of Copenhagen, Copenhagen, Denmark. 2 Department of Computer Science, Brown University, Providence, RI, USA. 3 Department of Information Engineering, University of Padova, Padova, Italy.
Acknowledgements
This work is supported, in part, by University of Padova projects SID2017 and STARS: Algorithms for Inferential Data Mining and by NSF grant IIS-1247581. The results presented in this manuscript are in whole or part based upon data generated by the TCGA Research Network: http://cance rgeno me.nih.gov/.
Competing interests
The authors declare that they have no competing interests.
Publisher’s Note
Springer Nature remains neutral with regard to jurisdictional claims in pub-lished maps and institutional affiliations.
Received: 7 November 2018 Accepted: 19 March 2019
References
1. Garraway LA, Lander ES. Lessons from the cancer genome. Cell. 2013;153(1):17–37. https ://doi.org/10.1016/j.cell.2013.03.002.
2. Cancer Genome Atlas Research Network. Integrated genomic characteri-zation of pancreatic ductal adenocarcinoma. Cancer Cell. 2017;32(2):185. 3. Vogelstein B, Papadopoulos N, Velculescu VE, Zhou S, Diaz LA Jr, Kinzler
KW. Cancer genome landscapes. Science. 2013;339(6127):1546–58. https ://doi.org/10.1126/scien ce.12351 22.
4. Vandin F. Computational methods for characterizing cancer mutational heterogeneity. Front Genet. 2017;8:83.
5. Leiserson MDM, Vandin F, Wu H-T, Dobson JR, Eldridge JV, Thomas JL, Papoutsaki A, Kim Y, Niu B, McLellan M, Lawrence MS, Gonzalez-Perez A, Tamborero D, Cheng Y, Ryslik GA, Lopez-Bigas N, Getz G, Ding L, Raphael BJ. Pan-cancer network analysis identifies combinations of rare somatic mutations across pathways and protein complexes. Nat Genet. 2015;47(2):106–14. https ://doi.org/10.1038/ng.3168.
6. Hofree M, Shen JP, Carter H, Gross A, Ideker T. Network-based stratifica-tion of tumor mutastratifica-tions. Nat Methods. 2013;10(11):1108–15. https ://doi. org/10.1038/nmeth .2651.
7. Shrestha R, Hodzic E, Sauerwald T, Dao P, Wang K, Yeung J, Anderson S, Vandin F, Haffari G, Collins CC, et al. HIT’nDRIVE: patient-specific multidriver gene prioritization for precision oncology. Genome Res. 2017;27(9):1573–88.
8. Hristov BH, Singh M. Network-based coverage of mutational profiles reveals cancer genes. arXiv preprint arXiv :1704.08544 . 2017.
9. Cowen L, Ideker T, Raphael BJ, Sharan R. Network propagation: a universal amplifier of genetic associations. Nat Rev Genet. 2017;18(9):551. 10. Hoadley KA, Yau C, Wolf DM, Cherniack AD, Tamborero D, Ng S, Leiserson
MD, Niu B, McLellan MD, Uzunangelov V, et al. Multiplatform analysis of 12 cancer types reveals molecular classification within and across tissues of origin. Cell. 2014;158(4):929–44.
11. Kandoth C, McLellan MD, Vandin F, Ye K, Niu B, Lu C, Xie M, Zhang Q, McMichael JF, Wyczalkowski MA, Leiserson MDM, Miller CA, Welch JS, Walter MJ, Wendl MC, Ley TJ, Wilson RK, Raphael BJ, Ding L. Mutational landscape and significance across 12 major cancer types. Nature. 2013;502(7471):333–9. https ://doi.org/10.1038/natur e1263 4.
12. Zehir A, Benayed R, Shah RH, Syed A, Middha S, Kim HR, Srinivasan P, Gao J, Chakravarty D, Devlin SM, et al. Mutational landscape of metastatic cancer revealed from prospective clinical sequencing of 10,000 patients. Nat Med. 2017;23(6):703.
13. Vaske CJ, Benz SC, Sanborn JZ, Earl D, Szeto C, Zhu J, Haussler D, Stuart JM. Inference of patient-specific pathway activities from multi-dimensional cancer genomics data using paradigm. Bioinformatics. 2010;26(12):237–45.
•fast, convenient online submission
•
thorough peer review by experienced researchers in your field
• rapid publication on acceptance
• support for research data, including large and complex data types
•
gold Open Access which fosters wider collaboration and increased citations maximum visibility for your research: over 100M website views per year
•
At BMC, research is always in progress.
Learn more biomedcentral.com/submissions
Ready to submit your research? Choose BMC and benefit from: 15. Ciriello G, Cerami E, Sander C, Schultz N. Mutual exclusivity analysis
identi-fies oncogenic network modules. Genome Res. 2012;22(2):398–406. 16. Kim Y-A, Cho D-Y, Dao P, Przytycka TM. Memcover: integrated analysis of
mutual exclusivity and functional network reveals dysregulated pathways across multiple cancer types. Bioinformatics. 2015;31(12):284–92. 17. Pulido-Tamayo S, Weytjens B, De Maeyer D, Marchal K. SSA-ME detection
of cancer driver genes using mutual exclusivity by small subnetwork analysis. Sci Rep. 2016;6:36257.
18. Cho A, Shim JE, Kim E, Supek F, Lehner B, Lee I. MUFFINN: cancer gene discovery via network analysis of somatic mutation data. Genome Biol. 2016;17(1):129.
19. Le Morvan M, Zinovyev A, Vert J-P. Netnorm: capturing cancer-relevant information in somatic exome mutation data with gene networks for cancer stratification and prognosis. PLoS Computat Biol. 2017;13(6):1005573.
20. Dao P, Wang K, Collins C, Ester M, Lapuk A, Sahinalp SC. Optimally discriminative subnetwork markers predict response to chemotherapy. Bioinformatics. 2011;27(13):205–13.
21. Mall R, Cerulo L, Bensmail H, Iavarone A, Ceccarelli M. Detection of statisti-cally significant network changes in complex biological networks. BMC Syst Biol. 2017;11(1):32.
22. Young MR, Craft DL. Pathway-informed classification system (PICS) for cancer analysis using gene expression data. Cancer Inform. 2016;15:40088.
23. Kim S, Kon M, DeLisi C. Pathway-based classification of cancer subtypes. Biol Direct. 2012;7(1):21.
24. Ideker T, Ozier O, Schwikowski B, Siegel AF. Discovering regulatory and signalling circuits in molecular interaction networks. Bioinformatics. 2002;18(suppl–1):233–40.
25. Dittrich MT, Klau GW, Rosenwald A, Dandekar T, Müller T. Identifying func-tional modules in protein–protein interaction networks: an integrated exact approach. Bioinformatics. 2008;24(13):223–31.
26. Gu J, Chen Y, Li S, Li Y. Identification of responsive gene modules by network-based gene clustering and extending: application to inflamma-tion and angiogenesis. BMC Syst Biol. 2010;4(1):47.
27. Jiao Y, Widschwendter M, Teschendorff AE. A systems-level integrative framework for genome-wide DNA methylation and gene expression data identifies differential gene expression modules under epigenetic control. Bioinformatics. 2014;30(16):2360–6.
28. He H, Lin D, Zhang J, Wang Y-p, Deng H-w. Comparison of statistical methods for subnetwork detection in the integration of gene expression and protein interaction network. BMC Bioinform. 2017;18(1):149. 29. Mitzenmacher M, Upfal E. Probability and computing: randomization
and probabilistic techniques in algorithms and data analysis. Cambridge: Cambridge University Press; 2017.
30. Das J, Yu H. HINT: high-quality protein interactomes and their applica-tions in understanding human disease. BMC Syst Biol. 2012;6:92. https :// doi.org/10.1186/1752-0509-6-92.
31. Yu H, Tardivo L, Tam S, Weiner E, Gebreab F, Fan C, Svrzikapa N, Hirozane-Kishikawa T, Rietman E, Yang X, Sahalie J, Salehi-Ashtiani K, Hao T, Cusick ME, Hill DE, Roth FP, Braun P, Vidal M. Next-generation sequencing to generate interactome datasets. Nat Methods. 2011;8(6):478–80. https :// doi.org/10.1038/nmeth .1597.
32. Cancer Genome Atlas Research Network. Integrated genomic characteri-zation of oesophageal carcinoma. Nature. 2017;541(7636):169–75. 33. Sun F, Yang X, Jin Y, Chen L, Wang L, Shi M, Zhan C, Shi Y, Wang Q.
Bio-informatics analyses of the differences between lung adenocarcinoma and squamous cell carcinoma using the cancer genome atlas expression data. Mol Med Rep. 2017;16(1):609–16.
34. Chen F, Zhang Y, Parra E, Rodriguez J, Behrens C, Akbani R, Lu Y, Kurie J, Gibbons DL, Mills GB, et al. Multiplatform-based molecular subtypes of non-small-cell lung cancer. Oncogene. 2017;36(10):1384.
35. Network Cancer Genome Atlas. Comprehensive molecular characteriza-tion of human colon and rectal cancer. Nature. 2012;487(7407):330. 36. Zhan T, Rindtorff N, Boutros M. Wnt signaling in cancer. Oncogene.
2017;36(11):1461.
37. Ciriello G, Miller ML, Aksoy BA, Senbabaoglu Y, Schultz N, Sander C. Emerging landscape of oncogenic signatures across human cancers. Nat Genet. 2013;45(10):1127.
38. Saladi SV, Ross K, Karaayvaz M, Tata PR, Mou H, Rajagopal J, Ramaswamy S, Ellisen LW. ACTL6A is co-amplified with p63 in squamous cell carcinoma to drive YAP activation, regenerative proliferation, and poor prognosis. Cancer Cell. 2017;31(1):35–49.
39. Lu C, Allis CD. SWI/SNF complex in cancer. Nat Genet. 2017;49(2):178–9. 40. Vogelstein B, Kinzler KW. Cancer genes and the pathways they control.
Nat Med. 2004;10(8):789–99.
41. Ceccarelli M, Barthel FP, Malta TM, Sabedot TS, Salama SR, Murray BA, Morozova O, Newton Y, Radenbaugh A, Pagnotta SM, et al. Molecular pro-filing reveals biologically discrete subsets and pathways of progression in diffuse glioma. Cell. 2016;164(3):550–63.
42. Basso RS, Hochbaum DS, Vandin F. Efficient algorithms to discover altera-tions with complementary functional association in cancer. arXiv preprint