R E S E A R C H
Open Access
GSTM1
copy number variation in the
context of single nucleotide
polymorphisms in the human
GSTM
cluster
Andrey V. Khrunin
*, Irina N. Filippova, Aydar M. Aliev, Tat
’
yana V. Tupitsina, Petr A. Slominsky
and Svetlana A. Limborska
Abstract
Background:GSTM1gene deletion is one of the most known copy number polymorphisms in human genome. It is most likely caused by homologous recombination between the repeats flanking the gene. However, taking into account that the deletion has no crucial effects on human well-being, and the ability of otherGSTMsto compensate for the lack ofGSTM1, a role for additional factors affectingGSTM1deletion can be proposed. Our goal was to explore the relationships betweenGSTM1deletion polymorphism and single nucleotide polymorphisms (SNPs) in the region of theGSTMcluster that includesGSTM2,GSTM3,GSTM4, andGSTM5in addition toGSTM1.
Results:Real-time polymerase chain reaction was used to quantify the number ofGSTM1copies. Fourteen SNPs from the region were tested and their allelic patterns were compared in groups of Russian individuals subdivided according to theirGSTM1deletion genotypes. Linkage disequilibrium-based haplotype analysis showed substantial differences of haplotype frequencies between the groups, especially between individuals with homozygousGSTM1−/−and +/+ genotypes. Exploration of the results of phasing ofGSTM1and SNP genotypes revealed unequal segregation of GSTM1+ and−alleles at different haplotypes.
Conclusions:The observed differences in haplotype patterns suggest the potential role of genetic context inGSTM1 deletion frequency (appearance) and in the determination of the deletion-related effects.
Keywords:DNA polymorphism,GSTM1deletion,GSTM1copy number polymorphism, Single nucleotide polymorphism, Haplotype
Background
Glutathione-S-transferases (GSTs) are a group of enzymes that play an important role in the metabolism and det-oxification of a wide range of exo- and endogenous compounds. Functionally, GSTs act by conjugating elec-trophilic centers of the compounds with molecules of re-duced glutathione. The reaction products are generally less reactive and readily excreted [1, 2]. Although many GST substrates can be potentially harmful to cellular mac-romolecules, some GST genes, particularly GSTT1 and GSTM1, are homozygously deleted in a high percentage (15 to 60 %) of individuals in various human populations
[3].GSTT1andGSTM1copy number variations are most likely caused by homologous recombination between the repeats flanking the both genes [4, 5]. However, the rea-sons for the high frequency of the deletions across differ-ent human populations are not well understood, especially if considered in the context of their associations with a higher risk for the development of a variety of patho-physiological conditions in individuals carrying deletion phenotypes [6]. A possible explanation could be the cap-ability of other GSTs to compensate, at least in part, for the absence of GSTT1- and GSTM1-related enzyme activ-ities under normal conditions [1]. Recent studies [7, 8] showed distinct connections between the levels of GST enzymatic activity and the activity of genes belonging to the same class (i.e., GSTT2B and GSTM2), evidently
* Correspondence:khrunin@img.ras.ru
Department of Molecular Bases of Human Genetics, Institute of Molecular Genetics of Russian Academy of Sciences, Kurchatov sq. 2, Moscow 123182, Russia
suggesting a role for local genetic context in the deletion frequency (deletion appearance).
In the current study, we investigated relationships be-tween GSTM1 deletion polymorphism and SNP-based haplotypes in the region of the GSTM cluster that includes GSTM2, GSTM3, GSTM4, and GSTM5 in addition to GSTM1. The obtained results demonstrated substantial differences in haplotype distribution between groups of individuals subdivided according to GSTM1 deletion genotypes.
Methods
Blood samples were obtained with informed consent from Russian donors from three locations in the European part of Russia (Andreapolsky District of the Tver Oblast,n= 96; Muromsky District of the Vladimir Oblast, n= 96; and Kursky and Oktyabrsky districts of the Kursk Oblast, n= 93). The ethnicity of the donors was determined by an interview. To be included, individuals had to be unrelated and represent the native ethnic group in the regions studied (i.e., they belonged to at least the third generation living in a particular geographic region). The interview protocol and informed-consent form were ap-proved by the Ethic Commission of Institute of Molecular Genetics of the Russian Academy of Sciences.
The DNA was isolated from peripheral leukocytes of the blood with a standard technique using proteinase K treatment and phenol–chloroform extraction [9].
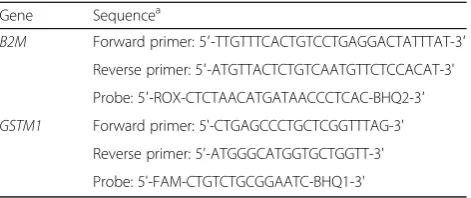
To subdivide the individuals according toGSTM1 dele-tion polymorphism, the results of two genotyping methods were used. The first method was based on the simultaneous amplification of a site onGSTM1with a re-gion of another gene used as an internal control. The method makes it possible to identify individuals with a homozygous deletion genotype (i.e., they have noGSTM1 copies at all; GSTM1 −/− genotype). This approach was used in our previous study, and data for individuals with a GSTM1−/−genotype were satisfactorily obtained [10]. In-dividuals with one or two copies of theGSTM1gene are not distinguished by this method. To differentiate between individuals with one (i.e., heterozygotes; GSTM1 −/+) or two (i.e., normal homozygotes; GSTM +/+) copies of GSTM1, quantitative real-time PCR was used. It was conducted using a TaqMan (5′-nuclease) assay system with signal from a GSTM1-specific probe that was nor-malized to the signal from a reference autosomal β -2-microglobulin gene (B2M). Primers and probes used to amplify the GSTM1 and B2M regions are presented in Table 1.
PCR was performed in 25μL of 1× PCR buffer, contain-ing 2.5 mM MgCl2, 200μM each of dNTP, 20 pM each of GSTM1 andB2M primers, 1.25 units of Hot-Rescue Taq DNA polymerase (Syntol, Moscow, Russia), 10 pM and 5 pM of GSTM1- and B2M-specific probes, respectively,
and 10–20 ng of genomic DNA. Thermal cycling and fluorescence intensity measurement were conducted using a StepOnePlus Real-Time PCR System (Applied Biosystems, Waltham, MA, USA). The samples were initially incubated for 10 min at 95 °C and then cycled 35 times at 95 °C for 20 s, followed by 60 °C for 60 s. All samples were tested in pentaplicate.
To quantify the number of GSTM1copies a compara-tive Ct method was used [11]. The ratio (R) of the GSTM1 to B2M gene dosage was calculated using the formula R = 2−ΔΔCt, where ΔΔCt = (Ctcontrol_B2M – Ctcontrol_GSTM1) – (Ctsample_B2M – Ctsample_GSTM1). We used a control sample known to be heterozygous for GSTM1. Based on the observed variability, R values higher than 1.4 were interpreted as an indication that the sample carried two functional variants (two copies) of GSTM1. Ratios between 0.7 and 1.3 were considered attributable to samples with heterozygous deletions (containing one GSTM1copy).
Population SNP genotypes were obtained from our pre-vious study, in which they were generated using Illumina Human CNV370-Duo and Human 660 W-Quad chips [12]. The set of SNPs was chosen by considering the chromosomal region in which the genes of the GSTM family were located.
Data on individualGSTM1deletion genotypes and SNP genotypes in other populations (i.e., CEU) were obtained from the database of the 1000 Genomes Project [13].
To explore patterns of genetic variation across GSTM cluster, a haplotype analysis was performed. Two ap-proaches were used. The first was based on an analysis of haplotypes in the haplotype blocks (haploblocks). The haplotype blocks were defined using a block definition based on the linkage disequilibrium (LD) measureD′and its confidence interval. The corresponding pairwise LD statistics between SNPs and the frequencies of haplotypes were estimated using Haploview software (version 4.2) [14]. Comparisons of haplotype frequencies between groups of individuals were performed using GraphPad InStat (version 3.00, GraphPad Software, San Diego, CA, USA). P< 0.05 was considered significant.
Table 1Primers and probes used in the study
Gene Sequencea
B2M Forward primer: 5′-TTGTTTCACTGTCCTGAGGACTATTTAT-3′ Reverse primer: 5′-ATGTTACTCTGTCAATGTTCTCCACAT-3'
Probe: 5′-ROX-CTCTAACATGATAACCCTCAC-BHQ2-3′
GSTM1 Forward primer: 5'-CTGAGCCCTGCTCGGTTTAG-3'
Reverse primer: 5'-ATGGGCATGGTGCTGGTT-3'
Probe: 5'-FAM-CTGTCTGCGGAATC-BHQ1-3'
a
The second approach consisted of exploring the pat-terns of haplotypes at which the GSTM1 null and non-null allele(s) segregated in populations. To obtain such structural haplotypes, the GSTM1 and SNP genotypes of populations were phased together using the Beagle soft-ware package (version 4, release 1399) using default pa-rameters [15]. Visualization of the sets of phasedGSTM1 and SNP alleles was conducted using a custom R script kindly provided by Robert E. Handsaker (Broad Institute of MIT and Harvard, Cambridge, MA, USA) [16].
Results
In previous studies based on both whole-genome poly-morphism analysis and testing SNPs in GSTA and GSTM clusters, high similarity between three Russian populations from the Central European part of Russia was demonstrated [12, 17]. To create a more effective sample, particularly in the context of generally under-representedGSTM1+/+ genotype carriers, three Russian populations were combined. In total, 128 individuals with a GSTM1−/−genotype, 121 individuals with aGSTM1−/+ genotype, and 36 individuals with aGSTM1+/+ genotype were detected in the sample. Genotype frequencies did not differ from those predicted by the Hardy–Weinberg rule (P= 0.45).
Fourteen SNPs determined as located in the region of theGSTMcluster were found among SNPs from the Illu-mina chip analyses and used in the current study. Figure 1 shows the LD between the SNPs, and the haploblocks in-ferred in the combined Russian sample. In total, four hap-loblocks were inferred in the chromosome region. We started our analysis from haplotypes of haploblock 2, com-prising SNPs rs673151 and rs929166. These SNPs were the nearest to the region of theGSTM1deletion. The fre-quencies of haplotypes CT and TT were maximal in the group of individuals with a GSTM1 +/+ genotype, while the third haplotype, CG, was the most frequent among the carriers of theGSTM1−/−genotype. All three haplo-types had intermediate frequencies in the group of indi-viduals with the GSTM1 −/+ genotype (Table 2). The same picture of haplotype distribution (i.e., intermediate values of haplotype frequencies in the group of individuals with the GSTM1 −/+ genotype) was observed for haplo-blocks 1, 3, and 4 (Table 2). As a consequence, pairwise comparisons of haplotypes showed the greatest differences between individuals with the GSTM1 −/− genotype and individuals with theGSTM1+/+ genotype. Haplotype dis-tributions in all four blocks were significantly different be-tween these two groups (Table 3). A slightly lower number of significant differences were found between the groups withGSTM1 −/−and GSTM−/+ genotypes, and only one when the group with the GSTM1+/+ genotype was compared with the group with theGSTM −/+ geno-type. The same analysis was also carried out in the CEU
population. The found correlations in haplotype distribu-tions were similar to those observed in the Russian sample.
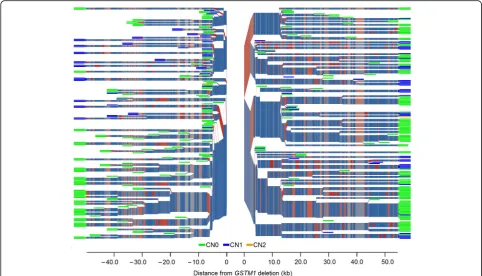
The output of processing phased Russian genotypes generally supported the results of the haploblock-based analysis. The output was expressed as an unequal occur-rence of GSTM1 alleles on different haplotypes (Fig. 2). Understanding the paucity of the SNP set tested, we attempted to increase the resolution by imputing add-itional genotypes. However, the addadd-itional genotypes did not markedly influence the pattern of haplotypes inferred, although the total number of SNPs increased to 49. This might be because none of the new SNPs were closer to theGSTM1 deletion than the two aforementioned SNPs, rs673151 and rs929166, which could be the result of earl-ier and crucial branching. The relevance of earlearl-ier branch-ing was supported by the data from the processbranch-ing of a set of 356 phased SNPs with a MAF≥0.01 in the CEU sam-ple, in which some SNPs were located at some hundreds of base pairs from the deletion (Fig. 3). Furthermore, in the resulting plot, nonrandom occurrence of particular GSTM1 alleles at different haplotypes was more evident (i.e., the lower left part of the plot was occupied exclu-sively by haplotypes with aGSTM1null allele) (Fig. 3).
Discussion
TheGSTM1homozygous deletion is very common in hu-man populations, varying between 16 and 40 % in Africans (sub-Saharan Africa), 42 and 55 % in Europeans, and 42 and 65 % in East Asian populations [3]. The frequency of the deletion suggests thatGSTM1has not been subjected to strong environmental selection pressure during evolu-tion, and thus it might have resulted from an ancestral de-letion that was widely spread across populations because of a founder effect.
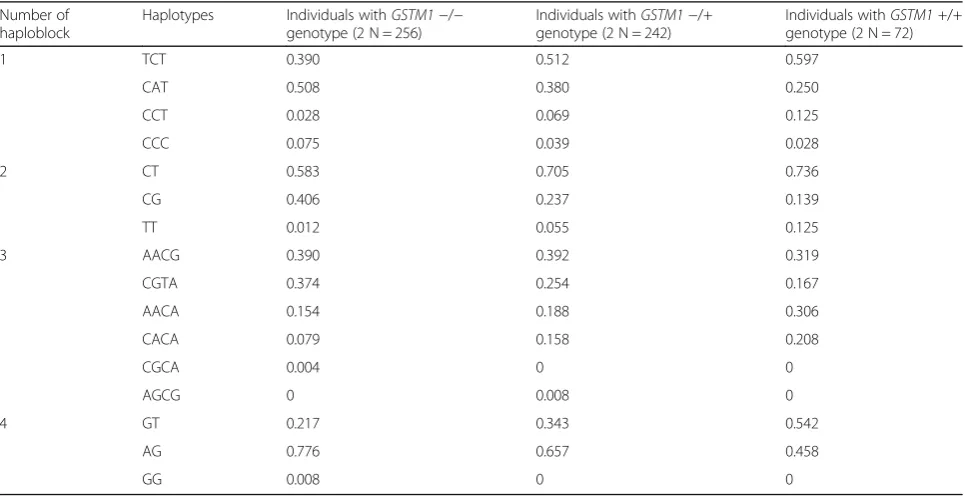
Table 2Haplotype frequencies in groups of individuals subdivided according toGSTM1deletion polymorphism
Number of haploblock
Haplotypes Individuals withGSTM1−/− genotype (2 N = 256)
Individuals withGSTM1−/+ genotype (2 N = 242)
Individuals withGSTM1+/+ genotype (2 N = 72)
1 TCT 0.390 0.512 0.597
CAT 0.508 0.380 0.250
CCT 0.028 0.069 0.125
CCC 0.075 0.039 0.028
2 CT 0.583 0.705 0.736
CG 0.406 0.237 0.139
TT 0.012 0.055 0.125
3 AACG 0.390 0.392 0.319
CGTA 0.374 0.254 0.167
AACA 0.154 0.188 0.306
CACA 0.079 0.158 0.208
CGCA 0.004 0 0
AGCG 0 0.008 0
4 GT 0.217 0.343 0.542
AG 0.776 0.657 0.458
GG 0.008 0 0
haplotype frequency in all four haploblocks inferred. We hypothesized that the differences may show the potential influence of genomic context on the occurrence of the de-letion. The assumption was supported by the results of ex-ploring structural haplotypes in the region of theGSTM1 deletion, where unequal occurrence ofGSTM1−and + al-leles at different SNP haplotypes was demonstrated. In what way could the context affect the deletion frequency (appearance)? It is unlikely that individual SNPs could affect recombination if they were not in a recombination hotspot [19]. However, taking into account the data on the possibility of functional compensation of GSTM1 −/− by GSTM2 [8], one can suggest that the correlations found may reflect the existence of functional associations
betweenGSTM1and allelic variants of other genes of the GSTM cluster. Such associations can explain both why GSTM1 has not been subjected to strong environmental selection and the high frequency ofGSTM1deletion. The associations seem to be also relevant to the conflicting re-sults reported in studies that correlatedGSTM1 with risk of cancer and other diseases [6, 20–24] in which the absence of GSTM1-related enzymatic activity could be masked by catalytic activities of other GSTMs and resulted in no or reduced impact of GSTM1 deletion on disease risk. Finally, taken in the context of the results of associa-tive studies, our findings highlight the necessity of parallel examination of allelic status of functionally and structurally related members of the gene family.
Fig. 2GSTM1copy number distribution and haplotype structure of theGSTMcluster genomic region in a combined Russian sample. SNP haplotypes in the region of theGSTMcluster are shown. The gap in the center of the plot indicates the edges of theGSTM1deletion. The branch points represent SNPs at which flanking haplotypes diverge because of mutation or recombination. The thickness of the branches corresponds to the frequency of haplotypes. Blue to red color intensity indicates the allele frequency of individual SNPs used to define the haplotypes, where the major allele is bluer, and the minor allele is redder. The color of the“leaves”at the ends of the branches indicates theGSTM1state of the chromosomes: green, no copies
ofGSTM1(deleted gene; CN0); blue, one functional copy ofGSTM1(CN1)
Table 3Statistics (P-values) of intergroup comparisons of haplotype frequenciesa
Number of haploblock
Individuals withGSTM1−/−genotype vs. Individuals withGSTM1+/+ genotype
Individuals withGSTM1−/−genotype vs. Individuals withGSTM1−/+ genotype
Individuals withGSTM1+/+ genotype vs. Individuals withGSTM1−/+ genotype
1 ‹0.0001 0.0060 0.9512
2 ‹0.0001 ‹0.0001 0.0391
3 ‹0.0001 0.0038 0.0700
4 ‹0.0001 0.0022 0.0024
a
Conclusions
In summary, we have reported the results of exploring the haplotype structure in the GSTM cluster region in relation to GSTM1 deletion polymorphism. By using both haploblock-based and extended phased haplotypes, substantial differences in haplotype distribution were observed when they were correlated with the GSTM1 genotypes and alleles. The results suggest the potential role of genetic context in GSTM1 deletion frequency (appearance), and in the determination of deletion-related effects.
Competing interests
The authors declare that they have no competing interests.
Authors’contributions
AVK, PAS and SAL conceived and designed the study, INF and TVT carried out genotyping experiments, AVK performed the statistical analysis and drafted the manuscript, AMA participated in the statistical analysis. SAL helped to draft the manuscript. All authors read and approved the final manuscript.
Acknowledgements
The authors are grateful to Robert E. Handsaker for a custom R script and for productive discussion of the results obtained. This study was supported by grants from the Program“Molecular and Cell Biology”of the Russian Academy of Sciences, the Federal Support of Leading Scientific Schools and the Russian Foundation for Basic Research.
Received: 1 March 2016 Accepted: 1 April 2016
References
1. Hayes JD, Flanagan JU, Jowsey IR. Glutathione transferases. Annu Rev Pharmacol Toxicol. 2005;45:51–88.
2. Oakley A. Glutathione transferases: a structural perspective. Drug Metab Rev. 2011;43:138–51.
3. Saitou M, Ishida T. Distributions of the GSTM1 and GSTT1 null genotypes worldwide are characterized by latitudinal clines. Asian Pac J Cancer Prev. 2015;16:355–61.
4. Xu S, Wang Y, Roe B, Pearson WR. Characterization of the human class Mu glutathione S-transferase gene cluster and the GSTM1 deletion. J Biol Chem. 1998;273:3517–27.
5. Sprenger R, Schlagenhaufer R, Kerb R, Bruhn C, Brockmöller J, Roots I, Brinkmann U. Characterization of the glutathione S-transferase GSTT1 deletion: discrimination of all genotypes by polymerase chain reaction indicates a trimodular genotype-phenotype correlation. Pharmacogenetics. 2000;10:557–65.
6. Bolt HM, Thier R. Relevance of the deletion polymorphisms of the glutathione S-transferases GSTT1 and GSTM1 in pharmacology and toxicology. Curr Drug Metab. 2006;7:613–28.
7. Zhao Y, Marotta M, Eichler EE, Eng C, Tanaka H. Linkage disequilibrium between two high-frequency deletion polymorphisms: implications for association studies involving the glutathione-S transferase (GST) genes. PLoS Genet. 2009;5:e1000472.
8. Bhattacharjee P, Paul S, Banerjee M, Patra D, Banerjee P, Ghoshal N, Bandyopadhyay A, Giri AK. Functional compensation of glutathione S-transferase M1 (GSTM1) null by another GST superfamily member, GSTM2. Sci Rep. 2013;3:2704.
9. Milligan BG. Total DNA, isolation. In: Hoelzel AR, editor. Molecular genetic analysis of populations. London: Oxford University Press; 1998. p. 29–60. 10. Khrunin AV, Khokhrin DV, Limborskaia SA. Glutathione-S-transferase gene
polymorphism in Russian populations of European Russia. Genetika. 2008;44:1429–34.
11. Shadrina MI, Semenova EV, Slominsky PA, Bagyeva GH, Illarioshkin SN, Ivanova-Smolenskaia II, Limborska SA. Effective quantitative real-time
polymerase chain reaction analysis of the parkin gene (PARK2) exon 1-12 dosage. BMC Med Genet. 2007;8:6.
12. Khrunin AV, Khokhrin DV, Filippova IN, Esko T, Nelis M, Bebyakova NA, et al. A genome-wide analysis of populations from European Russia reveals a new pole of genetic diversity in northern Europe. PLoS One. 2013;8:e58552. 13. 1000 Genomes: A Deep Catalog of Human Genetic Variation http://www.
1000genomes.org. Accessed 25 June 2015.
14. Barrett J, Fry B, Maller J. Haploview: analysis and visualization of LD and haplotype maps. Bioinformatics. 2005;21:263–5.
15. Browning SR, Browning BL. Rapid and accurate haplotype phasing and missing data inference for whole genome association studies using localized haplotype clustering. Am J Hum Genet. 2007;81:1084–97. 16. Handsaker RE, Van Doren V, Berman JR, Genovese G, Kashin S, Boettger LM,
McCarroll SA. Large multiallelic copy number variations in humans. Nat Genet. 2015;47:296–303.
17. Filippova IN, Khrunin AV, Limborska SA. Analysis of DNA variations in GSTA and GSTM gene clusters based on the results of genome-wide data from three Russian populations taken as an example. BMC Genet. 2012;13:89. 18. Gu W, Zhang F, Lupski JR. Mechanisms for human genomic rearrangements.
Pathogenetics. 2008;1:4.
19. Myers S, Spencer CC, Auton A, Bottolo L, Freeman C, Donnelly P, McVean G. The distribution and causes of meiotic recombination in the human genome. Biochem Soc Trans. 2006;34:526–30.
20. Pietro G, Magno LA, Rios-Santos F. Glutathione S-transferases: an overview in cancer research. Expert Opin Drug Metab Toxicol. 2010;6:153–70. 21. Carlsten C, Sagoo GS, Frodsham AJ, Burke W, Higgins JP. Glutathione
S-transferase M1 (GSTM1) polymorphisms and lung cancer: a literature-based systematic HuGE review and meta-analysis. Am J Epidemiol. 2008;167:759–74. 22. Economopoulos KP, Sergentanis TN. GSTM1, GSTT1, GSTP1, GSTA1 and
colorectal cancer risk: a comprehensive meta-analysis. Eur J Cancer. 2010;46:1617–31.
23. Minelli C, Granell R, Newson R, Rose-Zerilli MJ, Torrent M, Ring SM, et al. Glutathione-S-transferase genes and asthma phenotypes: a Human Genome Epidemiology (HuGE) systematic review and meta-analysis including unpublished data. Int J Epidemiol. 2010;39:539–62.
24. Liu H, Ma HF, Chen YK. Association between GSTM1 polymorphisms and lung cancer: an updated meta-analysis. Genet Mol Res. 2015;14:1385–92. 25. Covault J, Abreu C, Kranzler H, Oncken C. Quantitative real-time PCR for
gene dosage determinations in microdeletion genotypes. Biotechniques. 2003;35:594–7.
26. Nørskov MS, Frikke-Schmidt R, Loft S, Tybjaerg-Hansen A. High-throughput genotyping of copy number variation in glutathione S-transferases M1 and T1 using real-time PCR in 20,687 individuals. Clin Biochem. 2009;42:201–9.
• We accept pre-submission inquiries
• Our selector tool helps you to find the most relevant journal • We provide round the clock customer support
• Convenient online submission • Thorough peer review
• Inclusion in PubMed and all major indexing services • Maximum visibility for your research
Submit your manuscript at www.biomedcentral.com/submit