Open Access
Methodology
Independent component analysis of Alzheimer's DNA microarray
gene expression data
Wei Kong
†1,2, Xiaoyang Mou
†2, Qingzhong Liu
3, Zhongxue Chen
4,
Charles R Vanderburg
5, Jack T Rogers
6and Xudong Huang*
2,6Address: 1Information Engineering College, Shanghai Maritime University, Shanghai 200135, PR China, 2Biomedical Informatics and
Cheminformatics Group, Conjugate and Medicinal Chemistry Laboratory, Division of Nuclear Medicine and Molecular Imaging and Center for Advanced Medical Imaging, Department of Radiology, Brigham and Women's Hospital and Harvard Medical School, Boston, MA 02115, USA, 3Computer Science Department and Institute for Complex Additive Systems Analysis, New Mexico Institute of Mining and Technology, Socorro, NM 87801, USA, 4Joseph Stokes Jr. Research Institute, Children's Hospital of Philadelphia, Philadelphia, PA 19104, USA, 5Advanced Tissue Resource Center, Harvard NeuroDiscovery Center and Department of Neurology, Massachusetts General Hospital and Harvard Medical School, Charlestown, MA 02129, USA and 6Neurochemistry Laboratory, Department of Psychiatry, Massachusetts General Hospital and Harvard Medical School, Charlestown, MA 02129, USA
Email: Wei Kong - wkong@bwh.harvard.edu; Xiaoyang Mou - mou@bwh.harvard.edu; Qingzhong Liu - liuqzsc@nmt.edu; Zhongxue Chen - chenz@email.chop.edu; Charles R Vanderburg - cvanderburg@partners.org; Jack T Rogers - jtrogers@partners.org; Xudong Huang* - xhuang3@partners.org
* Corresponding author †Equal contributors
Abstract
Background: Gene microarray technology is an effective tool to investigate the simultaneous activity of multiple cellular pathways from hundreds to thousands of genes. However, because data in the colossal amounts generated by DNA microarray technology are usually complex, noisy, high-dimensional, and often hindered by low statistical power, their exploitation is difficult. To overcome these problems, two kinds of unsupervised analysis methods for microarray data: principal component analysis (PCA) and independent component analysis (ICA) have been developed to accomplish the task. PCA projects the data into a new space spanned by the principal components that are mutually orthonormal to each other. The constraint of mutual orthogonality and second-order statistics technique within PCA algorithms, however, may not be applied to the biological systems studied. Extracting and characterizing the most informative features of the biological signals, however, require higher-order statistics.
Results: ICA is one of the unsupervised algorithms that can extract higher-order statistical structures from data and has been applied to DNA microarray gene expression data analysis. We performed FastICA method on DNA microarray gene expression data from Alzheimer's disease (AD) hippocampal tissue samples and consequential gene clustering. Experimental results showed that the ICA method can improve the clustering results of AD samples and identify significant genes. More than 50 significant genes with high expression levels in severe AD were extracted, representing immunity-related protein, metal-related protein, membrane protein, lipoprotein, neuropeptide, cytoskeleton protein, cellular binding protein, and ribosomal protein. Within the aforementioned categories, our method also found 37 significant genes with low expression levels. Moreover, it is worth noting that some oncogenes and phosphorylation-related proteins are expressed in low levels. In comparison to the PCA and support vector machine recursive feature
Published: 28 January 2009
Molecular Neurodegeneration 2009, 4:5 doi:10.1186/1750-1326-4-5
Received: 26 September 2008 Accepted: 28 January 2009
This article is available from: http://www.molecularneurodegeneration.com/content/4/1/5
© 2009 Kong et al; licensee BioMed Central Ltd.
elimination (SVM-RFE) methods, which are widely used in microarray data analysis, ICA can identify more AD-related genes. Furthermore, we have validated and identified many genes that are associated with AD pathogenesis.
Conclusion: We demonstrated that ICA exploits higher-order statistics to identify gene expression profiles as linear combinations of elementary expression patterns that lead to the construction of potential AD-related pathogenic pathways. Our computing results also validated that the ICA model outperformed PCA and the SVM-RFE method. This report shows that ICA as a microarray data analysis tool can help us to elucidate the molecular taxonomy of AD and other multifactorial and polygenic complex diseases.
Background
Since microarray technology can determine the expres-sion levels of thousands of genes from a single array of chemical sensors, it has become a popular gene expres-sion screening tool in the molecular investigation of vari-ous diseases. This technology allows for two main types of descriptive analyses: firstly, the identification of genes that may be responsible for a clinicopathological feature or phenotype, and secondly, the genomic classification of tissue.
Its ultimate goal is to improve clinical outcome by adapt-ing therapy based on the molecular characteristics of human diseases such as a tumor [1,2]. Various methods have been developed to accomplish these tasks. However, most methods only consider individual genes, making the results difficult for biologists to interpret due to the large number of genes, their complex underlying inter-gene dependency, and the high co-linearity among the gene expression profiles.
Therefore, to understand the coordinated effects of multi-ple genes, researchers need to extract the underlying fea-tures from the multi-variable dataset and thereby reduce dimensionality and redundancy inherent in the measured data. To extract these features, however, any microarray technology, to be truly effective, must address the issue of noise in the array systems that lead to imperfection in experimental design. Additionally, to discover functional modules involved in gene regulatory or signaling path-ways, powerful mathematical and computational meth-ods are needed for modeling and analyzing the microarray data of interest.
Two kinds of unsupervised analysis methods for microar-ray data analysis, principal component analysis (PCA) and independent component analysis (ICA), have been developed to accomplish the tasks. PCA projects the data into a new space spanned by the principal components. Each successive principal component is selected to be orthonormal to the previous ones and to capture the max-imum information that is not already present in the pre-vious components. The constraint of mutual
orthogonality of components implied in classical PCA methods, however, may not be suitable for biological sys-tems. Biological model components are usually statisti-cally independent and without the constraint of orthogonality. Hence, ICA is well suited to biological data because it assumes that the gene expression data gener-ated from the DNA microarray technology is a linear com-bination of some independent components having specific biological interpretations. Another useful advan-tage of ICA is that it does not use any training data and a priori knowledge about a parameter of its data filtering and mixing.
Hori in 2001 [3,4] and Liebermeister in 2002 [5] showed that the ICA model can effectively classify gene expres-sions into biologically meaningful groups and relate them to distinct biological processes. Thus ICA has been widely used in DNA microarray data analysis for feature extrac-tion, clustering, and the classification of gene regulation analysis. Most published literature on the use of ICA anal-ysis for microarray data are about yeast cells' cycle [6-8] and cancer data such as: ovarian cancer [9], breast cancer [10-13], endometrial cancer [14], colon and prostate can-cer [15,16], and acute myeloid leukemia [17], etc. Although the exact causes of AD are not fully revealed, DNA microarray technique has been applied to AD-related gene profiling. However, in our knowledge, appli-cation of ICA in AD-related DNA microarray data analysis has not been reported before. Since ICA can both identify gene expression patterns and group genes into expression classes that might provide much greater insight into bio-logical function and relevance, we employed ICA meth-ods to uncover biologically meaningful patterns in AD microarray gene expression data. Herein, we present a new computational approach to reveal AD-related molec-ular taxonomy and to identify AD pathogenesis-related genes.
Results
expres-sion from control and AD samples [18]. The hippocampal specimens were obtained through the Brain Bank of the Alzheimer's Disease Research Center at the University of Kentucky. The human GeneChips (HG-U133A) of Affymetrix and Microarray Suite 5 were used in the micro-array data collection. The procedures for total RNA isola-tion, labeling, and microarray were described in [18] and [19].
We excluded the samples with significant noise and chose 8 control and 5 severe AD samples for ICA application, with each sample containing 22283 gene expressions. In addition, since microarray data often yield "unregulated" genes, whose expression profile does not contain much information, we filtered out unregulated genes prior to applying ICA. Finally, to perform ICA, we selected 13 sam-ples (8 control and 5 severe AD samsam-ples) and 3617 genes from each sample.
ICA Decomposed AD Microarray Data into Biological Processes
The main modeling hypothesis underlying the applica-tion of ICA to gene expression data analysis is that the gene expression level is determined by a linear combina-tion of biological processes, many of which may up-regu-late or down-reguup-regu-late gene expression. It is assumed that these biological processes correspond to activation or inhibition of single pathways or a network of highly cor-related pathways, and that each of these pathways only affects a relatively small percentage of all genes. Because of the statistical independence assumption inherent in the ICA inference process, we would expect ICA components to map closer to pathways.
Figure 1 gives the ICA decomposition results of the 13 × 3617 AD microarray data matrix X. Each observed sample was considered a linear combination of gene signatures
ICA decomposition results of AD microarray gene expression data Figure 1
captured by ICA under the weights of rows of matrix A. Here, FastICA, presented by Hyvärinen [20]http:// www.cis.hut.fi/projects/ica/fastica/, was applied to the AD microarray data matrix X with rows corresponding to n
(13) samples and columns corresponding to m (3617) genes. It decomposes matrix X into latent variable matrix
A (13 × 13) and gene signature matrix S (13 × 3617). In FastICA algorithm, nonlinear function g(u) = tanh(a1*u) was used as the probability density distribution of the out-puts u during the iteration, where here a1 is a constant. As the FastICA algorithm relies on random initializations for its maximization and faces the problem of convergence to local optima, Chiappetta et al. [10] presented consensus components by rerunning the FastICA algorithm with random initializations and Himberg et al. [21] proposed resampling of ICA components and used estimated cen-trotypes as the representatives of ICA components. In our study, we iterated FastICA 50 times to alleviate the insta-bility of the slightly different results generated from each iteration. The final components were estimated as the cen-trotypes of the iterated estimates for each component.
ICA Improved Gene Clustering Results of AD Samples Sample clustering by matrix A
ICA essentially seeks a new representation of the observed expression profile matrix X with the columns of matrix A
representing the new basis vectors (latent variables). Each row of A contains the weight with which gene signatures contribute to observed expression profiles.
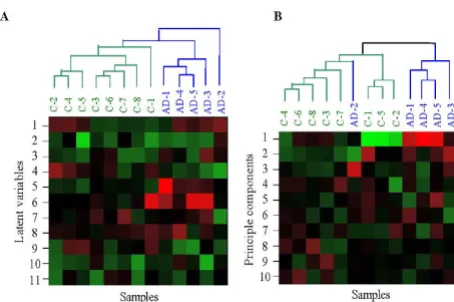
Unsupervised hierarchical clustering was applied to rows of A to validate the efficiency of ICA outputs (Figure 2A). The clustering method was performed on rows of matrix
A with the last two latent variables removed that were con-sidered noise or, since their values are similar across all samples, to have no biological relevance to AD. See the graphical representation of matrix A in Figure 1. As can be seen from the clustering dendrogram, the first 11 ICA latent variables captured sufficient biologically significant information from samples data. The control and severe AD samples can be clearly discriminated. Similar hierar-chical clustering was done on the principal components (PCs) outputted by PCA on the same original data (where the gene expression measurements are the variables and the samples are the observations) in Figure 2B. In the PCA method, the observed samples were represented as a lin-ear combination of the PCs with associated gene scores. Here, the first 10 PCs capturing 95.5% variance were selected to represent the original data, and the remaining PCs with lower variance that contained noise were removed for the clustering. Figure 2B showed that it can cluster some of the control samples and severe AD sam-ples, however, the severe AD sample 'AD-2' cannot be dis-criminated from control samples.
Sample clustering by reconstructed data
ICA transfer is an adaptive process in which the independ-ent componindepend-ents are as sparse as possible. Lee et al. (18) demonstrated that the underlying biological processes are more super-Gaussian than original inputs microarray gene data. For this property, one may assume that the activities of components with small absolute values are noisy or have redundancy information and must be set to zero, retaining just a few components with large activities,
S →Snew. Then the newly reconstructed data are obtained by Xnew = A Snew. Figure 3 shows the unsupervised
hierar-chical clustering was applied to the normalized raw data, with the data reconstructed by PCA and FastICA, respec-tively.
For the original data (Figure 3A), some of the control sam-ples and severe AD samsam-ples have been clustered together, but the highest hierarchical split did not separate the two classes as would have been expected. For the data recon-structed by both PCA and ICA, the clustering results were greatly improved (Figure 3B and 3C). In PCA method, the first 10 components associated with a larger variance were selected to reconstruct data that captured most of the information (the cumulative contribution of their eigen-values exceeded 95.5%) of original data whereas the remaining components with lower variance contained noise and were removed. The ICA method extracted m
Hierarchical clustering of the ICA and PCA outputs Figure 2
Hierarchical clustering of the ICA and PCA outputs.
(A) Hierarchical clustering of the ICA outputs with the last two 'common' components of matrix A removed. To display the cluster dendrogram conveniently, we transposed matrix
A in the graph. That is, the columns of the graphical represen-tation correspond to the rows of matrix A, denoting samples, and the rows of the graphical representation correspond to the columns of matrix A, denoting the ICA latent variables.
(13) gene signatures (rows of matrix S) that were mutually statistically independent as underlying biological proc-esses. Each independent component was as sparse as pos-sible, in which only a few relevant genes were significantly affected, leaving the majority of genes relatively unaf-fected. The filtering capacity of ICA was achieved by set-ting the entries in each gene signature with values that are less than the threshold = 0. Then, the reconstructed data gave a clearer clustering result to discriminate control and severe AD samples from original data.
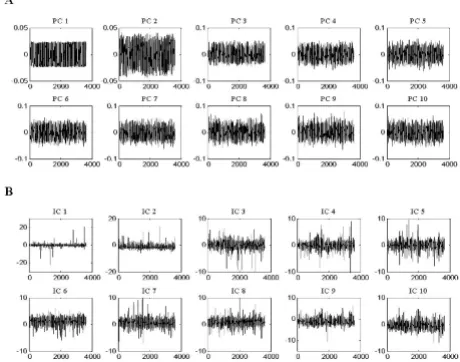
Although ICA produced similar results to PCA on AD sample clustering, it extracted sparser gene signatures that, since each gene signature only affects a relatively small percentage of all genes, were more useful for finding sig-nificant genes related to AD. Figure 4 showed the graphi-cal representation of gene signatures unveiled by PCA (A) and ICA (B). We would expect the identified ICs to map more closely to known pathways than PCA that does not use the statistical independence criterion (we will discuss the discovery of co-regulated genes associated with AD in the next section). Figure 5 showed the histogram of the corresponding PCs and ICs. The underlying biological processes extracted by ICA are more super-Gaussian (sparser) than the PCs.
Unsupervised hierarchical clustering of the normalized raw data
Figure 3
Unsupervised hierarchical clustering of the normal-ized raw data. (A) Data reconstructed by PCA; (B) and the data reconstructed by FastICA; (C) C1–8: control sam-ples, AD1–5: severe AD samples. Red and green blocks rep-resent signal increase and decrease from the mean
respectively. For the PCA reconstructed data, the first 10 principle components were applied and their cumulative con-tribution of the corresponding eigenvalues was 95.5%. For ICA-derived data, the genes with loadings that exceed the threshold (= 2) were considered significant, and the remain-ing genes with lower values were considered as noises and set to zero. Here, by comparing them to the original data, both PCA and ICA-derived data greatly improved the clus-tering results of AD microarray data.
The first 10 PCs and ICs extracted by PCA and ICA methods respectively
Figure 4
The first 10 PCs and ICs extracted by PCA and ICA methods respectively. (A) The first 10 PCs obtained by PCA that capture 95.5% information of original AD microar-ray data. (B) The first 10 ICs (gene signatures) uncovered by ICA from AD microarray data in which only a few relevant genes were significantly affected, leaving the majority of genes unaffected. The x-axis in each graph denotes genes, and the y-axis represents relative signal intensity.
The corresponding histograms of the first 10 PCs (A) and ICs (B) in figure 4
Figure 5
ICA Identified Significant Genes for AD
In the ICA outputs matrix, each row of matrix A contained the weights with which the expression levels of the m
genes contribute to the corresponding observed expres-sion profile (row of matrix X). Therefore, the profile order of rows of A is the same as that of the observed expression profiles, and each column of A is associated with the cor-responding gene signature (IC). Figure 6 shows the Hin-ton diagram representation of matrix A derived by FastICA.
The original data set consisted of 5 severe AD microarray gene expressions (first 5 rows) and 8 control samples (last 8 rows), so this assignment is also valid for the rows of A. In Figure 6, since the sign of the values are distinctly dif-ferent, the 4-th and 5-th columns of A (red circles) dis-criminate between severe AD and the control samples. For example, the values of the 4-th latent variable (4-th col-umns of A) are all negative for severe AD samples (first 5 rows) and positive for most of the control samples (last 8 rows) and the values of the 5-th latent variable (5-th col-umns of A) are all positive for severe AD samples (first 5 rows) and positive for all the control samples (last 8 rows). So the identified latent variables can be related to their corresponding gene signatures (the 4-th and 5-th row of matrix S) to find those individual genes that strongly contribute to that component. In addition, the last two columns of matrix A seem to have no biological relevance to AD because their values are similar across all
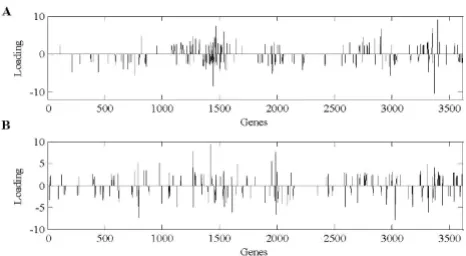
the samples (blue circle). These 'common' components can be ignored from the later investigation. Figure 7 shows the corresponding gene signatures in matrix S (4-th and 5-th row of S) for the 4-th and 5-th component in matrix A.
Genes with loading that exceed the chosen threshold (red line) were considered significant. Here, the threshold = 2 was used for reconstructing the gene expression profile. All of the items whose absolute values in matrix S were less than this threshold were set to zero. By testing multi-ple times, we achieved the threshold = 2 by which the reconstructed gene expression profile data can be success-fully clustered with much fewer significant genes. The pos-itive and negative loadings correspond to up- and down-regulation of expression, respectively. Figure 8 shows the selected significant genes.
Table 1 and 2 show the significant up- and down-regu-lated genes selected by the ICA method. To help further analysis, we display the gene names, their descriptions and the corresponding chromosomal locations.
Discussion
Significant genes found by ICA
Even though the immune system tends to work less effec-tively in older adults than in younger ones, the elderly are prone to neuroinflammation. In fact, even though recent studies have indicated that certain aspects of the inflam-matory response may have therapeutic potential [22-24], neuroinflammation is commonly believed to be a culprit in AD pathogenesis. Associated with this robust inflam-matory response is the extracellular deposition of amyloid
β-protein (Aβ) [25] that together are the characteristic
Hinton diagram representation of latent variable matrix A Figure 6
Hinton diagram representation of latent variable matrix A. The size of each square corresponds to the amount anm of component m in sample n. White and black represent positive and negative values, respectively.
The 4-th (A) and 5-th (B) gene signatures (corresponding to the 4-th and 5-th column of matrix A in figure 6)
Figure 7
pathological features of AD. are To validate the strong link between neuroinflammation and AD, we found that many inflammation-related genes are highly expressed, such as AMIGO2, BTG1, CD24, CD44, CDC42EP4, IFITM1, IFITM2, IRF7, FI44L, IL4R, IRAK1, NFKBIA, as Table 1 shows.
B-cell translocation gene 1 (BTG1) is a member of the anti-proliferative gene family that regulates cell growth and differentiation. Anti-proliferative, BTG1 may partici-pate in the activation-induced cell death of microglia by lowering the threshold for apoptosis; BTG1 increases the sensitivity of microglia to the apoptogenic action of the autocrine cytotoxic mediator [26].
CD24 is a cell adhesion molecule and a cell surface glyco-protein that is expressed on both immune cells and the cells of the CNS. Literature showed that CD24 is required for the induction of experimental autoimmune encepha-lomyelitis (EAE), an experimental model for the human disease multiple sclerosis (MS). The development of EAE requires CD24 expression on both T cells and non-T host cells in the CNS [27].
CD44 is a multifunctional cell surface glycoprotein that serves as a receptor for hyaluronic acid, collagen types I and VI, and mucosal vascular addressin. The localization of CD44 was investigated immunohistochemically in postmortem human brain tissue of control subjects and patients with AD. Morphological diversities of CD44 pos-itive astrocytes were in the cerebral cortex of normal sub-jects and patients with AD. In the AD brain, the number of CD44 positive astrocytes increased dramatically. There-fore, CD44 may be an important adhesion molecule for these astrocytic processes [28,29].
CD22 (in Table 2) is a regulatory molecule that prevents the over-activation of the immune system and the devel-opment of autoimmune diseases. Our results exhibited that CD22 is a down-expression that suggests overinflam-mation in AD.
Rho GTPases (Cdc42) are one of the targets in Aβ-induced neurodegeneration in AD pathology; they have a role in mediating changes in the actin cytoskeletal dynamics. The Rho family of small GTPases (Rho, Rac and Cdc42) are regulators of F-actin polymerization [30], acting as molec-ular switches by cycling between an inactive GDP-bound state and an active GTP-bound state. Rac1 and Cdc42 pro-mote polymerization at the leading edge, orchestrating the formation of lamellipodia and membrane ruffles [31], as well as peripheral actin microspikes and filopodia [32,33]. RhoA is an antagonist, promoting retraction of the leading edge and assembly of stress fibers [34]. Our ICA selected results exhibited NF-κB (NFKBIA) at a high expression in severe AD (see Table 1). NF-κB plays a key role in regulating the immune response to infection. Consistent with this role, incorrect regulation of NF-κB has been linked to cancer, inflammatory and autoim-mune diseases, septic shock, viral infection, and improper immune development. NF-κB has also been implicated in processes of synaptic plasticity and memory. The NF-κB activation provides the potential link between inflamma-tion and hyperplasia.
Table 1 also shows many genes related to metal protein were up-regulated in severe AD including CAMK2B, CALM1, CAPZA2, CHGB, LOC728320/LTF, MPPE1, MT1F, MT1M, SCGN, ZIC1, ZBTB20, ZNF500, ZNF580, ZNF652, ZNF710, SLC24A3 and SLC7A11. Literature showed that the level of metal ion metabolism is closely associated with AD. For example, changes in Ca2+
home-ostasis, as occurring after Aβ addition, may influence sev-eral physiological responses contributing to neuronal imbalance [35]. CaMKII is a holoenzyme composed of 12 monomers, primarily α and β subunits in neurons. Auto-phosphorylation of CaMKIIα at Thr286 is required for normal spatial memory and place-cell representation, pre-sumably through the triggering of its calcium-independ-ent kinase activity [36]. Ca2+ influx through the
N-methyl-D-aspartate (NMDA) type glutamate receptor leads to activation and postsynaptic accumulation of Ca2+
/cal-modulin-dependent protein kinase II. NR1 and NR2B subunits of the NMDA receptor serve as high-affinity Ca2+/calmodulin-dependent protein kinase II docking
sites in dendritic spines on autophosphorylation of Ca2+/
calmodulin-dependent protein kinase II. Research [37,38] showed a reduction of NR1 and phosphorylated Ca2+
/cal-modulin-dependent protein kinase II levels in the frontal cortex and hippocampus of AD brains. On the other
The selected significant genes for 4-th (A) and 5-th (B) gene signatures
Figure 8
Table 1: Selected genes up-regulated in severe AD
Gene name Description Chromosomal location
Immunity-related protein
AMIGO2 adhesion molecule with Ig-like domain 2 chr12q13.11 BTG1 B-cell translocation gene 1, anti-proliferative chr12q22
CD24 CD24 molecule chr6q21
CD44 CD44 molecule (Indian blood group) chr11p13 CDC42EP4 CDC42 effector protein (Rho GTPase binding) 4 chr17q24-q25 IFITM1 interferon-induced transmembrane protein 1 (9–27) chr11p15.5 IFITM2 interferon-induced transmembrane protein 2 (1–8D) chr11p15.5
IRF7 interferon regulatory factor 7 chr11p15.5
IFI44L interferon-induced protein 44-like chr1p31.1
IL4R interleukin 4 receptor chr16p12.1-p11.2
IRAK1 interleukin-1 receptor-associated kinase 1 chrXq28 NFKBIA nuclear factor of kappa light polypeptide gene
enhancer in B-cells inhibitor, alpha
chr14q13
Metal-related protein
CAMK2B calcium/calmodulin-dependent protein kinase (CaM kinase) II beta
chr22q12|7p14.3-p14.1
CALM1 calmodulin 1 (phosphorylase kinase, delta) chr14q24-q31 CAPZA2 capping protein (actin filament) muscle Z-line, alpha 2 chr7q31.2-q31.3 CHGB chromogranin B (secretogranin 1) chr20pter-p12 LOC728320/LTF lactotransferrin/similar to lactotransferrin chr3q21-q23
MPPE1 metallophosphoesterase 1 chr18p11.21
MT1F metallothionein 1F chr16q13
MT1M metallothionein 1M chr16q13
MBP myelin basic protein chr18q23
SCGN secretagogin, EF-hand calcium binding protein chr6p22.3-p22.1 SLC24A3 solute carrier family 24(sodium/potassium/calcium
exchanger), member 3
chr20p13
SLC7A11 solute carrier family 7, (cationic amino acid transporter, y+ system) member 11
chr4q28-q32
ZIC1 zinc family member 1
(odd-paired homolog, Drosophila)
chr3q24
ZBTB20 zinc finger and BTB domain containing 20 chr3q13.2
ZNF500 zinc finger protein 500 chr16p13.3
ZNF580 zinc finger protein 580 chr19q13.42
ZNF652 zinc finger protein 652 chr17q21.32
ZNF710 zinc finger protein 710 chr15q26.1
Neuropeptide
NMB neuromedin B chr15q22-qter
Ribosomal Protein
LOC644166/LO C644191/LOC728937/RPS26 ribosomal protein S26/similar to 40S ribosomal protein S26
chr12q13/chr17q21.31/chr2q31.1/ chr4q26
SORBS3 sorbin and SH3 domain containing 3 chr8p21.3
Cytoskeleton Protein
COL21A1 collagen, type XXI, alpha 1 chr6p12.3-p11.2|6p12.3-p11.2
CTBP1 C-terminal binding protein 1 chr4p16
CAPZA2 capping protein (actin filament) muscle Z-line, alpha 2 chr7q31.2-q31.3 FLNA filamin A, alpha (actin binding protein 280) chrXq28
Cholesterol metabolism
APOC2/APOC4 apolipoprotein C-II/apolipoprotein C-IV chr19q13.2
APOE apolipoprotein E chr19q13.2
ABCA1 ATP-binding cassette, sub-family A (ABC1), member 1
chr9q31.1
hand, Ca2+ conveyed proteins CABP1, CACNG3,
CAMK2B, CAMK1G, CAPZB (in Table 2) that were at low expressions in severe AD. Some primary neuron-specific transcriptional regulators that may be involved in mediat-ing early neural development are also zinc fmediat-inger-based. Brown et al. found the level of neurofilament gene expres-sion seems to directly control axonal diameter that in turn controls how fast electrical signals travel down the axon [39]. Our ICA selected genes (in Table 2): APLP2, CYP26B1, NEFH, NPY, NTRK2, SERPINI1, OLIG2 and NRSN2, showed that the neurofilament family is low in expression in severe AD symptoms presenting at the clinic.
To maintain cellular homeostasis, all cells must continu-ally synthesize new proteins. Ribosomes (polyribosomes) are specialized complexes composed of nucleic acids and proteins that are responsible for mediating all protein syn-thesis. Impairments in protein synthesis occur in the ear-liest stages of AD. They occur in affected cortical regions but not the cerebellum, with impairments in protein syn-thesis apparently mediated by both alterations in ribos-omal nucleic acids as well as the polyribosribos-omal complex itself that suggests a novel role for alterations in protein synthesis as a potential mediator of AD pathogenesis [40]. See Table 2, the ribosomal protein: CSPG5, C1orf115, C20orf149, C9orf16, and HNRPA2/HNRPA3P1 are down-regulated in severe AD.
The changes of the cytoskeleton protein expression leads to the formation of disease, with actin filament-based structures being identified as important players in the complex pathology of AD and related dementias. A direct interaction between Tau and actin has been shown in
[41,42]; actin may be a critical mediator of Tau-induced neurotoxicity in AD and related disorders. These kinds of abnormalities also showed in our ICA results for cytoskel-eton protein. Some genes like COL21A1, CTBP1, CAPZA2 and FLNA were up-regulated (Table 1), whereas some genes like ACTB and SMARCA4 were down-regulated (Table 2).
APOE, which has three alleles: APOE ε2, APOE ε3 and APOE ε4, is a protein that helps to carry cholesterol and fat in the blood. APOE ε4 is regarded as the best known genetic risk factor for late-onset sporadic AD [43-47]. Aberrant cholesterol metabolism has been implicated in AD and other neurological disorders. Oxysterols and other cholesterol oxidation products are effective ligands of liver X activated receptor (LXR) nuclear receptors and major regulators of genes subserving cholesterol homeos-tasis. LXR receptors act as molecular sensors of cellular cholesterol concentrations and effectors of tissue choles-terol reduction. Following their interaction with oxyster-ols, activation of LXRs induce the expression of ATP-binding cassette, sub-family A member 1, and a pivotal modulator of cholesterol efflux. The relative solubility of oxysterols facilitate lipid flux among brain compartments and egress across the blood-brain barrier [48]. The high expression levels of APOC2/APOC4, APOE and ABCA1 can be seen in Table 1.
In addition, ICA also found some significant genes of lipoprotein, binding protein, and membrane protein etc. were up-regulated in severe AD (Table 1), such as: GAD2, LDLRAP1, AEBP1, TAP1, UBAP2L, HLA-DRB4, TRHDE, TMEM92, SPARC and SERPINA3; and some significant genes were down-regulated, such as: CABP1, RIMS3, PCSK1, RIMS2, GRIN1, MBP, MOBP, PIP3-E, PLD3,
GAD2 glutamate decarboxylase 2 (pancreatic islets and brain, 65 kDa)
chr10p11.23
LDLRAP1 low density lipoprotein receptor adaptor protein 1 chr1p36-p35
Binding protein
AEBP1 AE binding protein 1 chr7p13
TAP1 transporter 1, ATP-binding cassette, sub-family B (MDR/TAP)
chr6p21.3
UBAP2L ubiquitin associated protein 2-like chr1q21.3
Membrane Protein
HLA-DRB4 major histocompatibility complex, class II, DR beta 4 chr6p21.3 TRHDE thyrotropin-releasing hormone degrading enzyme chr12q15-q21
TMEM92 Transmembrane protein 92 chr17q21.33
SERPINA3 serpin peptidase inhibitor, clade A (alpha-1 antiproteinase, antitrypsin), member 3
chr14q32.1
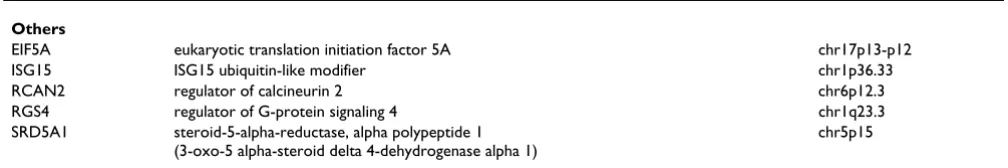
Others
CDKN1C cyclin-dependent kinase inhibitor 1C (p57, Kip2) chr11p15.5
GSTM5 glutathione S-transferase M5 chr1p13.3
SPARC secreted protein, acidic, cysteine-rich (osteonectin) chr5q31.3-q32
Table 2: Selected genes down-regulated in severe AD
Gene name Description Chromosomal location
Immunity
CD22/MAG CD22 molecule/myelin associated glycoprotein chr19q13.1
Metal-related protein
CABP1 calcium-binding protein 1 chr12q24.31
CACNG3 calcium channel, voltage-dependent, gamma subunit 3 chr16p12-p13.1 CAMK2B calcium/calmodulin-dependent protein kinase (CaM kinase) II beta chr22q12|7p14.3-p14.1 CAMK1G calcium/calmodulin-dependent protein kinase IG chr1q32-q41
CAPZB capping protein (actin filament) muscle Z-line, beta chr1p36.1 MET met proto-oncogene (hepatocyte growth factor receptor) chr7q31
ZNF365 zinc finger protein 365 chr10q21.2
TFRC transferrin receptor (p90, CD71) chr3q29
Neuropeptide
APLP2 amyloid beta (A4) precursor-like protein 2 chr11q23-q25|11 q24 CYP26B1 cytochrome P450, family 26, subfamily B, polypeptide 1 chr2p13.3
NEFH neurofilament, heavy polypeptide 200 kDa chr22q12.2 NEFL neurofilament, light polypeptide 68 kDa chr8p21
NPY neuropeptide Y chr7p15.1
NTRK2 neurotrophic tyrosine kinase, receptor, type 2 chr9q22.1 SERPINI1 serpin peptidase inhibitor, clade I (neuroserpin), member 1 chr3q26.1 OLIG2 oligodendrocyte lineage transcription factor 2 chr21q22.11
NRSN2 neurensin 2 chr20p13
Ribosomal Protein
CSPG5 chondroitin sulfate proteoglycan 5 (neuroglycan C) chr3p21.3 C1orf115 chromosome 1 open reading frame 115 chr1q41 C20orf149 chromosome 20 open reading frame 149 chr20q13.33
C9orf16 chromosome 9 open reading frame 16 chr9q34.1
HNRPA3/ HNRPA3P1
heterogeneous nuclear ribonucleoprotein A3 pseudogene 1/heterogeneous nuclear ribonucleoprotein A3
chr10q11.21/chr2q31.2
Cytoskeleton Protein
ACTB actin, beta chr7p15-p12
SMARCA4 SWI/SNF related, matrix associated, actin dependent regulator of chromatin, subfamily a, member 4
chr19p13.2
Oncogene
ABCA2 ATP-binding cassette, sub-family A (ABC1), member 2 chr9q34 ATP6V0C ATPase, H+ transporting, lysosomal 16 kDa, V0 subunit c chr16p13.3
ATP13A2 ATPase type 13A2 chr1p36
BCAS1 breast carcinoma amplified sequence 1 chr20q13.2-q13. 3
Binding Protein
CABP1 calcium-binding protein 1 chr12q24.31
Membrane Protein
RIMS3 regulating synaptic membrane exocytosis 3 chr1pter-p22.2 PCSK1 proprotein convertase subtilisin/kexin type 1 chr5q15-q21 RIMS2 regulating synaptic membrane exocytosis 2 chr8q22.3
Lipoprotein
GRIN1 glutamate receptor, ionotropic, N-methyl D-aspartate 1 chr9q34.3
MBP myelin basic protein chr18q23
MOBP myelin-associated oligodendrocyte basic protein chr3p22.1
Phosphorylation-related Protein
PIP3-E phosphoinositide-binding protein PIP3-E chr6q25.2
PLD3 phospholipase D family, member 3 chr19q13.2
PTPRT, EIF5A, ISG15, RCAN2, RGS4, SRD5A1 (Table 2). Especially, some oncogenes like ABCA2, ATP6V0C, ATP13A2, BCAS1 had low expression levels in severe AD (Table 2).
Significant genes found by PCA
To compare PCA with ICA, the PCA method for finding differentially expressed genes proposed by Jonnalagadda in 2008 [49] was performed on the same AD microarray data. Firstly, we modeled the control microarray data (where the samples are the variables and the gene expres-sion measurements are the observations) using PCA and represented the expression profile of each gene as a linear combination of the dominant principal components (PCs). Then, the severe AD microarray data were projected onto the developed PCA model, and the scores were extracted. The first 100 most varied genes between the scores obtained by control data and severe AD data were selected for further biological analysis.
PCA also extracted some significant genes in immunore-actions, metal protein, membrane protein, lipoprotein, neuropeptide, cytoskeleton protein, binding protein, ribosomal protein and phosphorylation-related protein. But PCA extracted fewer genes than ICA. In immunity-related protein, PCA found only two significant genes: BCL6 and CD24 had high expression in severe AD. In metal-related protein, PCA found many up-regulated genes of the metallothionein family like: MT1P2, MT1E, MT1F, MT1G, MT1H/MT1P2, MT1X, MT2A; and CAMK2A, CALM1 and zinc finger ZBTB20, LDHA, LOC643287/PTMA. GPRC5B was the only gene found as membrane protein. In the category of lipoprotein, APOE was extracted as an important gene. For neuropeptide, NGFRAP1 and PPIA were extracted. ATP1B1 is the only phosphorylation-related protein found. Many down-reg-ulated genes of cytoskeleton protein were extracted by the PCA method, such as: B2M, COL5A2, CSRP1, COX6A1, MAP1A, SPARC, TUBA1B, TUBA1C, TUBB, TUBB2A and TUBB2C. And PCA found many ribosomal proteins: LOC653737/LOC728501/LOC729402/LOC731567/ RPL21, RPL29, RPL30, LOC342994/LOC651249/ LOC729536/RPL34, RPL35, RPL4, RPL9, RPS10, RPS11, that were all down-regulated in severe AD, except one gene RPL13 that was up-regulated.
Significant genes found by SVM-RFE
By comparing the weights of the support vectors in a sequential backward elimination manner, the Support Vector Machine Recursive Feature Elimination (SVM-RFE) method is widely used in microarray data analysis. In our experiments, to keep track of variation in gene expression associated with the development of AD, and hence, to biologically analyze the significant genes with the devel-opment of AD, the control data were treated as group 1, and the AD case data, at the first stage, were placed in group 2. With the use of SVM-RFE, by comparing the data in group 1 and group 2, the significant genes were identi-fied; then the AD case data at the second stage (moderate) were treated as group 2, and, by comparing the gene expression data between group 1 and group 2, the signifi-cant genes were extracted. Finally group 2 consists of the AD case data at the third stage (severe), by comparing data in groups 1 and 2, the significant genes are profiled. The SVM-RFE method found significant genes in immu-noreactions such as CD44, CD74, CDC42EP4, CDK2AP1, MAL, PTMA, among which CD74 and MAL were not found by the ICA and PCA methods. Many metal metab-olism-related proteins were also selected by the SVM-RFE method: MT1F, MT1H/MT1P2, MT1M, MT1X, VEZF1, ZBTB20, ZNF91, ZDHHC11, ZHX3. APOC1, USP34 and SPARC were extracted in lipoprotein, neuropeptide and secreted protein, respectively. In cytoskeleton protein, COL21A1, FGFR3, ITGB4, TPPP3, GSN, GFAP, MFAP3 were found up-regulated in severe AD. In ribosomal pro-tein, the SVM-RFE method extracted many high expres-sion genes like: RPL10, RPL13, RPL13A, RPL5, RPS4X, LOC387867, and two low expression genes: RNASE1 and RPL4. In the category of membrane protein, TMEM123 and LAMP2 were extracted as important genes. In phos-phorylation-related protein, PIP4K2A, PDE4C, PEA15, PTPN11, PTPRK, ATP8B1, ANP32B, ABCA1, CNP were found up-regulated in severe AD. The SVM-RFE method also selected some significant oncogenes, TPT1, GLTSCR2, GUSBP1, GDF1/LASS1 that were highly expressed, as opposed to MCAM that was found to have low expression levels in severe AD.
Figure 9 showed the number of the significant genes selected by the ICA, PCA and SVM-RFE methods on a
dif-Others
EIF5A eukaryotic translation initiation factor 5A chr17p13-p12
ISG15 ISG15 ubiquitin-like modifier chr1p36.33
RCAN2 regulator of calcineurin 2 chr6p12.3
RGS4 regulator of G-protein signaling 4 chr1q23.3
SRD5A1 steroid-5-alpha-reductase, alpha polypeptide 1 (3-oxo-5 alpha-steroid delta 4-dehydrogenase alpha 1)
chr5p15
ferent chromosome. In contrast to PCA and SVM-RFE, ICA extracted more significant genes on chromosome 1, 3, 4, 7, 8, 9, 11, 12, 14, 17, 18, 19, 20, 21 and 22. In particular, the genes numbered on chromosome 1, 3, 7 and 20, extracted by ICA, were significantly higher than ones obtained by PCA and SVM-RFE.
Conclusion
In summary, to the best of our knowledge, this work is the first attempt to explore the power of the ICA on analyzing AD-related microarray gene expression data. By validating and identifying known and novel genes in AD-related pathogenesis, it confirms the added value of ICA over PCA and the SVM-RFE methods Our results further indicate that ICA can give researchers the ability to extract poten-tially disease-related genes from microarray gene expres-sion data, and thus to delineate relevant molecular pathways of disease pathogenesis. Hence, ICA can help to elucidate the molecular taxonomy of AD and enable bet-ter experimental design to further validate and identify potential biomarkers and therapeutic targets of AD.
Methods
Let the n × m matrix X denote the microarray gene expres-sion data with m genes under n samples or conditions. xij
in X is the expression level of the j-th gene in the i-th sam-ple. Generally speaking, the number of genes m is much larger than that of the samples n, m>>n. Suppose that the data have been preprocessed and normalized, i.e. each sample has a zero mean and standard deviation, then the ICA model for gene expression data can be expressed as:
And it can also be rewritten in the vector format as:
X = AS (2) In some documents, m × n matrix X was used to denote m
genes under n samples. Then the transform, XT, was used
in the ICA model: XT = AS. So, XT here denoted the same n
× m matrix in the ICA model.
In the ICA model of microarray data, the columns of A = [a1, a2,..., an] are the n × n latent vectors of the gene micro-array data, S denotes the n × m gene signature matrix or expression mode, in which, the rows of S are statistically independent to each other, and the gene profiles in X are considered to be a linear mixture of statistically independ-ent componindepend-ents S combined by an unknown mixing matrix A. Figure 10 presents the vector framework of the ICA model.
The gene expression data provided by microarray technol-ogy is considered a linear combination of some independ-ent componindepend-ents having specific biological interpretations. Lee and Batzoglou [50], and Schachtner et al. [51] gave detailed analyses for matrix S and A. The n-th row matrix A contained the weights with which the expression levels of the m genes contribute to the n-th observed expression profile. Hence the assignment for the observed expression profiles with different classes is valid for the rows of A. Each column of A can be associated with one specific expression mode. For an example of two classes, suppose one of the independent expression modes sn is characteristic of a putative cellular gene regu-lation process. It should contribute substantially to one of the class experiments whereas its contribution to another class experiments should be less, or vice versa. Since the n -th column of A contains the weights with which sn con-tributes to all observations, this column should show large or small entries according to the class labels. After such characteristically latent variables have been obtained, the corresponding elementary modes can be identified to yield useful information for classification. Also, the distribution of gene expression levels generally features a small number of significantly overexpressed or underexpressed genes that form very biologically coherent groups and may be interpreted in terms of regulatory pathways [3-5,10,51].
To obtain S and A, the demixing model can be expressed as
Y = WX (3)
Where W is an n × n demixing matrix. Figure 11 shows the processing of ICA algorithms on microarray gene expres-sion data. x t x t a a a a s t s n m
n nm m
1 11 1
1 1 ( ) ( ) ( ) ( M L
M O M
L M ⎡ ⎣ ⎢ ⎢ ⎢ ⎤ ⎦ ⎥ ⎥ ⎥ = ⎡ ⎣ ⎢ ⎢ ⎢ ⎤ ⎦ ⎥ ⎥ ⎥ tt)
⎡ ⎣ ⎢ ⎢ ⎢ ⎤ ⎦ ⎥ ⎥ ⎥ (1)
The number of the significant genes on each chromosome selected by the ICA, PCA and SVM-RFE methods, respec-tively
Figure 9
Competing interests
The authors declare that they have no competing interests.
Authors' contributions
WK carried out the ICA studies on the Alzheimer's DNA microarray gene expression data and drafted the manu-script. XM help with data interpretation and manuscript drafting. QL performed the data analysis using SVM-RFE method. ZC performed the statistical analysis of the data. CV and JR participated in the final data analysis and inter-pretation. XH conceived of the study, and participated in
its design and coordination. All authors read and approved the final manuscript.
Acknowledgements
WK would like to express her gratitude for the supports from the Research Foundation of Shanghai Municipal Education Commission (No. 06FZ012 and No.2008098), the National Natural Science Foundation of China (No. 60801060), and Radiology Department of Brigham and Women's Hospital (BWH). XH is supported by grants from the NIA/NIH (5R21AG028850), Alzheimer's Association (IIRG-07-60397), and the research funds from BWH Radiology Department. We thank Ms. Kimberly Lawson at BWH Radiology Department for her extremely helpful com-ments and editing of our manuscript.
References
1. Saidi SA, Holland CM, Kreil DP, MacKay D, Charnock-Jones DS:
Independent component analysis of microarray data in the study of endometrial cancer. Oncogene 2004, 23(39):6677-6683. 2. Beer DG, Kardia SL, Huang CC, Giordano TJ, Levin AM, Misek DE, Lin L, Chen G, Gharib TG, Thomas DG, Lizyness ML, Kuick R, Haya-saka S, Taylor JM, Iannettoni MD, Orringer MB, Hanash S: Gene-expression profiles predict survival of patients with lung ade-nocarcinoma. Nat Med 2002, 8:816-824.
3. Hori G, Inoue M, Nishimura S, Nakahara H: Blind gene classifica-tion based on ICA of microarray data. 3rd Internaclassifica-tional Con-ference on Independent Component Analysis and Signal Separation. In Proc ICA2001 Volume 3. San Diego, USA; 2001:332-336.
4. Hori G, Inoue M, Nishimura S, Nakahara H: Blind gene classifica-tion – an applicaclassifica-tion of a signal separaclassifica-tion method. Genome Informatics Workshop, GIW2001. Tokyo, Japan 2001:255-256. 5. Liebermeister W: Linear modes of gene expression
deter-mined by independent component analysis. Bioinformatics 2002, 18(1):51-60.
6. Liao XJ, Dasgupta N, Lin SM, Carin L: ICA and PLS modeling for functional analysis and drug sensitivity for DNA microarray signals. IEEE International Conference on Acoustics, Speech, and Signal Processing, ICASSP 2002, IV:3880-3883.
7. Suri RE: Application of independent component analysis to microarray data. International Conference on Integration of Knowl-edge Intensive Multi-Agent Systems 2003:375-378.
8. Lu XG, Lin YP, Yue W, Wang HJ, Zhou SW: ICA based supervised gene classification of Microarray data in yeast functional
ICA vector model of microarray gene expression data Figure 10
ICA vector model of microarray gene expression data. Matrix X denotes the microarray gene expression data with m
genes under n samples or conditions. The columns of A = [a1, a2,..., an] are the n × n latent vectors of the gene microarray data, where S denotes the n × m gene signature matrix or expression mode, in which, the rows of S are statistically independent to each other. Each gene profile provided x(t) obtained by microarray technology that was considered to be a linear combination of statistically independent components S that have specific biological interpretations and latent variables A.
Theoretical framework of ICA algorithms on microarray gene expression data
Figure 11
Theoretical framework of ICA algorithms on micro-array gene expression data. In the ICA model for micro-array gene expression data, the matrix X is the only one we know. According to the hypothesis (left frame) that gene profiles are linear combinations of statistically independent components S and the latent variables A, the demixing proc-ess of ICA (right frame) can be applied to extract the latent variables (once we get the demixing matrix W, we can obtain latent variables A easily by A = W-1) and gene signatures that
have specific biological interpretations (Y is the estimator of
genome. Eighth International Conference on High-Performance Comput-ing in Asia-Pacific Region, BeijComput-ing, China 2005:633-638.
9. Martoglio AM, Miskin JW, Smith SK, Mackay DJC: A decomposition model to track gene expression signatures: preview on observer-independent classification of ovarian cancer. Bioin-formatics 2002, 18(12):1617-1624.
10. Chinappetta P, Roubaud MC, Torrésani B: Blind source separation and the analysis of microarray data. Journal of Computational Biol-ogy 2004, 11(6):1090-1109.
11. Berger JA, Mitra SK, Edgren H: Studying DNA microarray data using independent component analysis. First International Sym-posium on Control, Communications and Signal Processing 2004:747-750. 12. Journée M, Teschendorff AE, Absil PA, Tavaré S, Sepulchre R: Geo-metric optimization methods for the analysis of gene expression data. BMC Plant Biol 2006, 14:6-27.
13. Teschendorff AE, Journee M, Absil PA, Sepulchre R, Caldas C: Eluci-dating the altered transcriptional programs in breast cancer using independent component analysis. PLoS Comput Biol 2007,
3(8):e161.
14. Saidi SA, Holland CM, Kreil DP, MacKay D, Charnock-Jones DS:
Independent component analysis of microarray data in the study of endometrial cancer. Oncogene 2004, 23(39):6677-6683. 15. Zhu L, Tang C: Microarray sample clustering using independ-ent componindepend-ent analysis. Proceedings of the 2006 IEEE/SMC Inter-national Conference on System of Systems Engineering, Los Angeles, CA, USA 2006:112-117.
16. Zhang XW, Yap YL, Wei D, Chen F, Danchin A: Molecular diagno-sis of human cancer type by gene expression profiles and independent component analysis. European journal of Huaman Genetics 2005, 13:1303-1311.
17. Frigyesi A, Veerla S, Lindgren D, Hoglund M: Independent compo-nent analysis reveals new and biologically significant struc-tures in micro array data. BMC Bioinformatics 2006, 7:290-301. 18. Blalock EM, Geddes JW, Chen KC, Porter NM, Markesbery WR,
Landfield PW: Incipient Alzheimer's disease: microarray cor-relation analyses reveal major transcriptional and tumor suppressor responses. PNAS 2004, 101(7):2173-2178.
19. Blalock EM, Chen KC, Sharrow K, Herman JP, Porter NM, Foster TC, Landfield PW: Gene microarrays in hippocampal aging: statis-tical profiling identifies novel processes correlated with cog-nitive impairment. J Neurosci 2003, 23(9):3807-19.
20. Hyvärinen A, Oja E: A fast fixed-point algorithm for independ-ent componindepend-ent analysis. Neural Computation 1997,
9(7):1483-1492.
21. Himberg J, Hyvärinen A, Esposito F: Validating the independent components of neuroimaging time-series via clustering and visualization. NeuroImage 2004, 22:1214-1222.
22. Stacie CW, Bruce AY: Inflammation and Alzheimer disease: The good, the bad, and the ugly. Nature Medicine 2001,
7:527-528.
23. Iwai K, Hirata K, Ishida T, Takeuchi S, Hirase T, Rikitake Y, Kojima Y, Inoue N, Kawashima S, Yokoyama M: An anti-proliferative gene BTG1 regulates angiogenesis in vitro. Biochem Biophys Res Com-mun 2004, 316(3):628-635.
24. Meyer-Luehmann M, Spires-Jones TL, Prada C, Garcia-Alloza M:
Rapid appearance and local toxicity of amyloid-beta plaques in a mouse model of Alzheimer's disease. Nature 2008,
451:720-725.
25. Tony WC, Carol L, Fengrong Y, Gui-Qiu Y, Michelle R, Lisa MC, Eliezer M, Lennart M: TGF-β1 promotes microglial amyloid-β clearance and reduces plaque burden in transgenic mice.
Nature Medicine 2001, 7:612-618.
26. Akiyama H, Tooyama I, Kawamata T, Ikeda K, McGeer PL: Morpho-logical diversities of CD44 positive astrocytes in the cerebral cortex of normal subjects and patients with Alzheimer's dis-ease. Brain Res 1993, 632(1–2):249-259.
27. Liu JQ, Carl JW Jr, Joshi PS, RayChaudhury A, Pu XA, Shi FD, Bai XF:
CD24 on the resident cells of the central nervous system enhances experimental autoimmune encephalomyelitis. J Immunol 2007, 178(10):6227-6235.
28. Vogel H, Butcher EC, Picker LJ: H-CAM expression in the human nervous system: evidence for a role in diverse glial interac-tions. J Neurocytol 1992, 21(5):363-373.
29. Kalaria RN, Pax AB: Increased collagen content of cerebral microvessels in Alzheimer's disease. Brain Res 1995, 705(1– 2):349-52.
30. Bishop AL, Hall A: Rho GTPases and their effector proteins.
Biochem 2000, 348:241-255.
31. Ridley AJ, Paterson HF, Johnston CL, Diekmann D, Hall A: The small GTP-binding protein rac regulates growth factor-induced membrane ruffling. Cell 1992, 70(3):401-410.
32. Kozma R, Ahmed S, Best A, Lim L: The Ras-related protein Cdc42Hs and bradykinin promote formation of peripheral actin microspikes and filopodia in Swiss 3T3 fibroblasts. Mol Cell Biol 1995, 15:1942-1952.
33. Nobes CD, Hall A: Rho, rac, and cdc42 GTPases regulate the assembly of multimolecular focal complexes associated with actin stress fibers, lamellipodia, and filopodia. Cell 1995,
81(1):53-62.
34. Schmitz AA, Govek EE, Bottner B, Van AL: Rho GTPases: signal-ing, migration, and invasion. Exp Cell Res 2000, 261:1-12. 35. Soderling TR, Chang BH, Brickey DA: Cellular signaling through
multifunctional Ca2+/calmodulin-dependent protein kinase II. J Biol Chem 2001, 276:3719-3722.
36. Giese KP, Fedorov NB, Filipkowski RK, Silva AJ: Autophosphoryla-tion at Thr286 of the alpha calcium-calmodulin kinase II in LTP and learning. Science 1998, 279:870-873.
37. Amada N, Aihara K, Ravid R, Horie M: Reduction of NR1 and phosphorylated Ca2+/calmodulin-dependent protein kinase II levels in Alzheimer's disease. Neuroreport 2005,
16(16):1809-1813.
38. Cheung KH, Shineman D, Müller M, Cárdenas C, Mei L, Yang J, Tom-ita T, Iwatsubo T, Lee VM, Foskett JK: Mechanism of Ca2 Disrup-tion in Alzheimer's Disease by Presenilin RegulaDisrup-tion of InsP3 Receptor Channel Gating. Neuron 2008, 58:871-883.
39. Brown A, Wang L, Jung P: Stochastic simulation of neurofila-ment transport in axons: the "stop-and-go" hypothesis. Mol Biol Cell 2005, 16(9):4243-55.
40. Ding Q, Markesbery WR, Chen Q, Li F, Keller JN: Ribosome dys-function is an early event in Alzheimer's disease. J Neurosci 2005, 25(40):9171-9175.
41. Gallo G: Tau is actin up in Alzheimer's disease. Nat Cell Biol 2007, 9(2):133-134.
42. Fulga TA, Elson-Schwab I, Khurana V, Steinhilb ML, Spires TL, Hyman BT, Feany MB: Abnormal bundling and accumulation of F-actin mediates tau-induced neuronal degeneration in vivo. Nat Cell Biol 2007, 9(2):139-48.
43. Cosentino S, Scarmeas N, Helzner E, Glymour MM, Brandt J, Albert M, Blacker D, Stern Y: APOE epsilon 4 allele predicts faster cognitive decline in mild Alzheimer disease. Neurology 2008,
70(19 Pt 2):1842-1849.
44. Zhong N, Scearce-Levie K, Ramaswamy G, Weisgraber KH: Apoli-poprotein E4 domain interaction: synaptic and cognitive def-icits in mice. Alzheimers Dement 2008, 4(3):179-92.
45. Percy M, Moalem S, Garcia A, Somerville MJ, Hicks M, Andrews D, Azad A: Involvement of ApoE E4 and H63D in sporadic Alzhe-imer's disease in a folate-supplemented Ontario population.
J Alzheimers Dis 2008, 14(1):69-84.
46. Related A, Haasl RJ, Ahmadi MR, Meethal SV, Gleason CE, Johnson SC, Asthana S, Bowen RL, Atwood CS: A luteinizing hormone receptor intronic variant is significantly associated with decreased risk of Alzheimer's disease in males carrying an apolipoprotein E epsilon4 allele. BMC Med Genet 2008, 9:37-49. 47. Bekris LM, Millard SP, Galloway NM, Vuletic S, Albers JJ, Li G, Galasko DR, DeCarli C, Farlow MR, Clark CM, Quinn JF, Kaye JA: Multiple SNPs within and surrounding the apolipoprotein E gene influence cerebrospinal fluid apolipoprotein E protein levels.
J Alzheimers Dis 2008, 13(3):255-266.
48. Jacob V, Hyman MS: Oxysterols, cholesterol homeostasis, and Alzheimer disease. Journal of Neurochemistry 2007,
102:1727-1737.
49. Jonnalagadda S, Srinivasan R: Principal components analysis based methodology to identify differentially expressed genes in time-course microarray data. BMC Bioinformatics 2008,
9:267-282.
50. Lee SI, Batzoglou S: Application of independent component analysis to microarrays. Genome Biology 2003,
4(11):R76.1-R76.21.