OncoTargets and Therapy 2018:11 253–269
OncoTargets and Therapy
Dove
press
submit your manuscript | www.dovepress.com 253
O r i g i n a l r e s e a r c h
open access to scientific and medical research
Open access Full Text article
a support vector machine and a random forest
classifier indicates a 15-miRNA set related to
osteosarcoma recurrence
Yunfei he1,2,*
Jun Ma1,*
an Wang1,3,*
Weiheng Wang1
shengchang luo1
Yaoming liu2
Xiaojian Ye1
1Department of Orthopaedics, changzheng hospital affiliated with second Military Medical University, shanghai, 2Department of Orthopaedics, lanzhou general hospital of lanzhou Military command region, lanzhou, 3Department of Orthopaedics, shanghai armed Police Force hospital, shanghai, People’s republic of china
*These authors contributed equally to this work
Background: Osteosarcoma, which originates in the mesenchymal tissue, is the prevalent primary solid malignancy of the bone. It is of great importance to explore the mechanisms of metastasis and recurrence, which are two primary reasons accounting for the high death rate in osteosarcoma.
Data and methods: Three miRNA expression profiles related to osteosarcoma were down-loaded from GEO DataSets. Differentially expressed miRNAs (DEmiRs) were screened using MetaDE.ES of the MetaDE package. A support vector machine (SVM) classifier was con-structed using optimal miRNAs, and its prediction efficiency for recurrence was detected in independent datasets. Finally, a co-expression network was constructed based on the DEmiRs and their target genes.
Results: In total, 78 significantly DEmiRs were screened. The SVM classifier constructed by 15 miRNAs could accurately classify 58 samples in 65 samples (89.2%) in the GSE39040 database, which was validated in another two databases, GSE39052 (84.62%, 22/26) and GSE79181 (91.3%, 21/23). Cox regression showed that four miRNAs, including hsa-miR-10b, hsa-miR-1227, hsa-miR-146b-3p, and hsa-miR-873, significantly correlated with tumor recur-rence time. There were 137, 147, 145, and 77 target genes of the above four miRNAs, respec-tively, which were assigned to 17 gene ontology functionally annotated terms and 14 Kyoto Encyclopedia of Genes and Genomes pathways. Among them, the “Osteoclast differentiation” pathway contained a total of seven target genes and was analyzed further.
Conclusion: The 15-miRNAs-based SVM classifier provides a potential useful tool to predict the recurrence of osteosarcoma. Our results suggest the possible mechanisms of osteosarcoma metastasis and recurrence and provide fresh DEmiRs as potential biomarkers or therapeutic targets for osteosarcoma.
Keywords: osteosarcoma, microRNA, lncRNA, SVM classifier, co-expression network
Introduction
Osteosarcoma, which originates in the mesenchymal tissue, is the most frequent
primary solid malignancy of the bone.1 The high death rate of osteosarcoma may be
attributed to metastasis and recurrence, especially pulmonary metastasis, and over 90%
of patients with osteosarcoma die from pulmonary metastases.1,2 However, molecular
mechanisms of metastasis and recurrence are still not well known. Therefore, it has a very important significance to understand the molecular mechanisms of metastasis and recurrence, and this will be helpful to develop novel prognostic biomarkers and targeted therapeutic agents for osteosarcoma.
correspondence: Yaoming liu Department of Orthopaedics, lanzhou general hospital of lanzhou Military command region, 333 nanbinhe road, lanzhou 730050, People’s republic of china
Tel +86 931 8996 211 email [email protected]
Xiaojian Ye
Department of Orthopaedics, Changzheng Hospital Affiliated with second Military Medical University, 415 Fengyang road, shanghai 200003, People’s republic of china
Tel +86 21 6053 1431 email [email protected]
Journal name: OncoTargets and Therapy Article Designation: Original Research Year: 2018
Volume: 11
Running head verso: He et al
Running head recto: Therapeutic targets for osteosarcoma DOI: http://dx.doi.org/10.2147/OTT.S148394
OncoTargets and Therapy downloaded from https://www.dovepress.com/ by 118.70.13.36 on 25-Aug-2020
For personal use only.
Dovepress
he et al
MicroRNAs (miRNAs) are noncoding small RNAs involved in gene regulation, which repress translation and
cleave mRNAs by base-pairing to the 3′-untranslated region
of the target genes, and thus participate in the regulation of various critical biological processes, including differentiation, progression, apoptosis, and proliferation of tumor cells.3
Recent research demonstrated that miRNAs played important roles in the occurrence and development of osteosarcoma, and there were abnormal expressions of many miRNAs in
osteosarcoma.4,5 For example, downregulated miRNA-143
in osteosarcoma could promote apoptosis and suppress
tum-origenicity by targeting Bcl-2,6 and downregulated
miRNA-199a-3p in osteosarcoma could regulate cell proliferation and
migration.7 In contrast, overexpression of miR-125b could
suppress proliferation and migration of osteosarcoma cells
through downregulation of STAT3,8 and overexpression
of miR-451 in the osteosarcoma cells could significantly inhibit cell proliferation, migration, and tumorigenesis as well as promote cell apoptosis.5 A study by Maire et al
found that five upregulated miRNAs were related to genes with low expression, whereas five downregulated miRNAs were related to genes with high expression, indicating that miRNAs provide a novel post-transcriptional mechanism for fine-tuning the expression of specific genes and pathways
relevant to osteosarcoma.9 Although accumulating evidences
have proved the important roles of various miRNAs in osteo-sarcoma, there remains a large amount of unknown miRNAs involved in osteosarcoma, and it is necessary to explore more novel miRNAs that can provide a new theoretical basis for development of targeted therapy for osteosarcoma.
In addition, a series of long non-coding RNAs (lncRNAs), which may be participants in the regulation of diverse cellular processes such as cell proliferation and apoptosis, stem cell
pluripotency, and development,10–12 have been shown to be
involved in osteosarcoma. For instance, MALAT1 promotes proliferation and metastasis of osteosarcoma cells by
acti-vating the PI3K/Akt pathway.13 Abnormal expressions of
lncRNAs in osteosarcoma have been shown in many studies. For example, downregulation of lncRNA TUG1 inhibits
osteosarcoma cell proliferation and promotes apoptosis,14 and
decreased expression of lncRNA MEG3 could act as a poten-tial predictor biomarker in the progression and poor prognosis
of osteosarcoma.15 Overexpression of lncRNAs UCA1 and
TUG1 correlates with poor prognosis in osteosarcoma,16,17
and upregulation of lncRNA HNF1A-AS1 promotes cell proliferation and metastasis in osteosarcoma through
activa-tion of the Wntβ-catenin signaling pathway.18 Increasingly,
studies have evidenced that lncRNAs are capable of acting as
either competitive endogenous RNAs for miRNAs or miRNA
sponges, thus modulating miRNA activity.19,20 Moreover, it
has been demonstrated that lncRNAs and miRNAs cooperate closely in fine-tuning gene expression transcriptionally and post-transcriptionally.21 Tan et al have provided evidence
for miRNA-mediated interplay between lncRNAs and
mRNAs in mouse embryonic stem cells.22 Recently, it has
been reported that crosstalks between lncRNAs and miRNAs are crucial for cancer metastasis.23 However, interactions
between lncRNAs and miRNAs have not been systematically investigated in osteosarcoma.
Furthermore, although more and more people devote effort to explore osteosarcoma-related miRNAs and lncRNAs, most of these studies focus on either miRNAs or lncRNAs, and underlying mechanisms remain unclear. Recent develop-ments in bioinformatics and statistical genomics provide systems biology approaches, allowing for a better under-standing of transcriptome organization and transcriptional regulation. Among these systems biology approaches, gene network analysis is a powerful approach that considers gene interactions and has been widely applied in gene expression
studies of humans and model organisms.24–26
This study aimed to identify promising candidate miRNAs significantly associated with osteosarcoma recurrence and uncover the underlying molecular mechanisms. For doing this, we tried to use large quantities of miRNA-seq data in GEO DataSets to screen out miRNAs with differential expression between osteosarcoma recurrence and non-recurrence samples, and then undertook correlational analysis between optimal feature miRNA combination and recurrence time. Finally, a co-expression network was constructed on the basis of the differential expression of miRNAs and their target genes. Moreover, lncRNAs related to osteosarcoma were searched in the lncRNA and disease (LncRNADisease) database, and the relationships between these lncRNAs and their target miRNAs were integrated using the two prediction databases – miRcode and starBase.
Data and methods
collection and pretreatment of expression
profile data
Public expression profiling data in GEO DataSets were retrieved with “osteosarcoma, homo sapiens and miRNA” as key words on July 25, 2016. Three miRNA expression profiles, named GSE39040, GSE39052, and GSE79181, were achieved, among which the former two emerged from the platform “GPL15762 Illumina Human v2 MicroRNA Expression BeadChip”, whereas the last one arose from the
OncoTargets and Therapy downloaded from https://www.dovepress.com/ by 118.70.13.36 on 25-Aug-2020
Dovepress Therapeutic targets for osteosarcoma
platform “GPL15497 Applied Biosystems TaqMan Array Human MicroRNA Cards”. There were 23, 15, and 14 osteo-sarcoma recurrence samples, and 42, 11, and 9 osteoosteo-sarcoma non-recurrence samples in these three datasets, separately. Meanwhile, original values of the abovementioned transcripts were downloaded in .txt format. Each probe was annotated as the corresponding gene after rejecting null probes, and then normalized by a limma package.
screening of differentially expressed
miRNA (DEmiR) by meta-analysis
DEmiRs between osteosarcoma recurrent and non-recurrent samples were screened using MetaDE.ES of the MetaDE
package.27 First, heterogeneity tests of miRNA
expres-sion values from various platforms were carried out using MetaDE.ES to obtain statistical parameters for judging
heterogeneity, including tau2, Q value, and Qpval. The
judg-ment criteria were as follows: when the tau2 value was 0 or
the Q value was submitted to the K-1 degree of freedom
chi-square test with Qpval .0.05, the study object was
homogeneous and unbiased. Subsequently, a significant
expression difference test (P,0.05) of miRNA from the
integrated dataset was conducted between different groups. In this study, sources of distinct miRNAs were ensured to be unbiased on the basis of reliable parameters of the
homoge-neity test (ie, tau2=0 and Qpval .0.05). Moreover, P,0.05
was chosen as a significant threshold of miRNA differential expression.
Construction of specimen classification
model using support vector machine
(sVM) and random forest (rF)
acquisition of optimal feature mirna combination
In the present study, GSE39040 was used as a training data-set, and hierarchical clustering analysis was undertaken based on the expression values of DEmiRs and the unsupervised clustering method. Moreover, the aforementioned miRNAs had undergone selection of optimal feature combinations
using a recursive feature elimination (RFE)28 algorithm,
applied in machine learning. Performances of different types of samples were evaluated through combinations of iterative random features until the optimal feature combina-tion was obtained. Representative miRNAs were selected out after serial analyses, which can be used as identifiers of clinical diagnosis to construct a model and assess recur-rent osteosarcoma based on expression levels of represen-tative miRNAs.
Construction of SVM classifier
A significant combination of informative miRNAs was achieved using optimization of feature selection, and a SVM classifica-tion model was then constructed using the GSE39040 dataset
by the e1071 package (https://cran.r-project.org/web/packages/
e1071/index.html). Samples were classified and discriminated according to expression values of their informative miRNAs; later, probabilities of samples belonging to some class were predicted and estimated on the basis of their eigen values, so as to distinguish and predict the risk of osteosarcoma recurrence based on these informative expression levels of miRNAs.
Construction of RF classifier
Furthermore, a RF classifier was established using the same informative miRNAs as in SVM classifier in the GSE39040
dataset by the randomForest package (https://cran.r-project.
org/web/packages/randomForest/index.html). Samples were classified into different recurrence statuses and discriminated according to expression values of their informative miRNAs by the RF classifier.
Validation of SVM and RF classifier
In order to confirm the robustness and transferability of the SVM and RF classifier, the remaining two datasets – GSE39052 and GSE79181 – were used as verification sets. The classification effect was comprehensively evaluated in terms of sensitivity (Se), specificity (Sp), positive predictive value (PPV), negative predictive value (NPV), and the area under the ROC curve (AUROC).
correlation analysis of selected mirnas
and recurrence time
Multiple analysis of optimal feature mirnas and recurrence time
All samples in the training set were divided into a recurrence group and a non-recurrence group using the SVM classifier. Using Kaplan–Meier survival analysis of survfit function in
R language,29 correlation analysis between optimal feature
miRNAs and the recurrence time of each corresponding sample was undertaken in the two groups.
cox regression analysis of optimal
feature mirnas and recurrence time
According to clinical information, all samples in the train-ing set were categorized into a recurrence group and a non-recurrence group. With expression values of the optimal feature combination of miRNAs as variables, associations of optimal feature miRNAs with recurrence time were studied
OncoTargets and Therapy downloaded from https://www.dovepress.com/ by 118.70.13.36 on 25-Aug-2020
Dovepress
he et al
by Cox regression analysis using the coxph R function of the survival package in R language.
Prediction of miRNA-regulated target
genes using mirTarBase database
MiRTarBase (http://mirtarbase.mbc.nctu.edu.tw) provides the
latest and extensive experimental validation of miRNA–target interaction information.29,30 Using the latest updated version of
this database, the target genes of the miRNAs significantly asso-ciated with recurrence were searched. Subsequently, interaction networks of target genes regulated by these miRNAs were established after integration of the interaction data of human genes from the three protein-interaction databases, including the Biological General Repository for Interaction Datasets
(BioGRID) (http://thebiogrid.org/), Human Protein Reference
Database (HPRD) (http://www.hprd.org/), and the Database of
Interacting Proteins (DIP) (http://dip.doe-mbi.ucla.edu/).
Function and pathway of target genes
in mirna regulation network
The miRNA control networks were visualized by Cytoscape. Later, the gene ontology (GO) function nodes and Kyoto Encyclopedia of Genes and Genomes (KEGG) pathways significantly enriched with the target genes were identified. The enrichment process was calculated by Fisher exact test algorithm, and the calculation formula was as follows:
p
i x
= 1−
− −
= 0 − 1
M i
N K
M i N K
∑
N is the total number of genes in the whole genome; M is the number of genes in the pathway; and K is the number of differentially expressed genes.
search of disease lncrnas and regulation
relationship
search for lncrnas associated with osteosarcoma from database
LncRNAs related to osteosarcoma were searched in the
LncR-NADisease database31 (http://210.73.221.6/lncrnadisease)
which contained 321 lncRNAs and 221 related diseases reported in more than 500 documents.
Prediction of relationship between
lncRNAs and target-regulating miRNAs
The regulatory relation between lncRNAs and miRNAs was
integrated using two prediction databases, miRecode (http://
www.mircode.org/)32 and starBase.33 Then, the regulatory
relationship between the osteosarcoma-related lncRNAs and the miRNA-targeted genes was built according to the previ-ously obtained miRNAs relevant to this disease.
Results
screening of candidate mirnas
by meta-analysis
The parametric values of each miRNA, including pval,
tau2, Qpval, and Qval, were calculated using the MetaDE
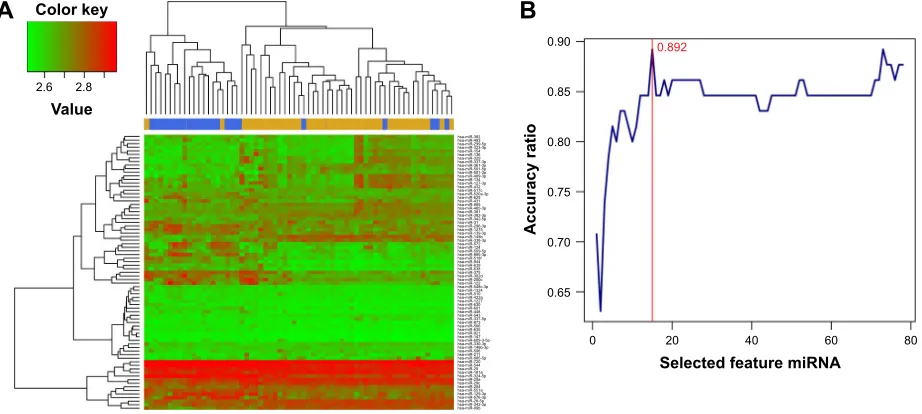
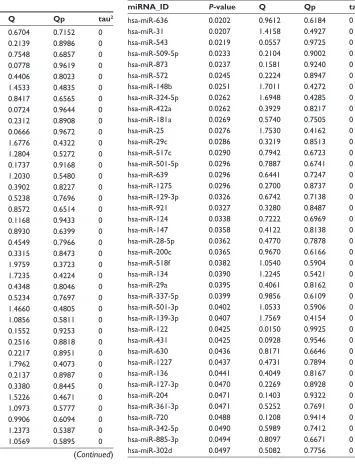
package. According to the screening threshold described in the section “Data and methods”, there were 78 signifi-cantly DEmiRs screened from the three datasets, of which the top ten miRNAs selected according to P-values were hsa-miR-432, hsa-miR-329, hsa-miR-889, hsa-miR-337-3p, miR-635, miR-296-3p, miR-548c-3p, hsa-miR-625, hsa-miR-551a, and hsa-miR-510 (Table S1). Meanwhile, heat maps of the three datasets were drawn out by the heatmap.sig.genes function of the MetaDE pack-age (Figure 1).
Model construction of sample
classification using SVM and RF
Construction of SVM and RF classifier based
on optimal feature mirna combination
Hierarchical clustering analysis was carried out in the training dataset GSE39040 based on expression values of DEmiRs and an unsupervised clustering method. The results indicated that samples of the same type tended to gather together on the basis of the expression values of the 78 DEmiRs (Figure 2A). In order to obtain a collection of miRNAs representative of all the DEmiRs the RFE algorithm was adopted to select the optimal characteristic combination of miRNAs with a significant difference in expression in the GSE39040 data-set. Following serial analyses, the result showed that the optimal miRNA combination had the highest classification accuracy of 89.2% when the number of miRNA was set at 15 (Figure 2B). These 15 miRNAs in the optimal combina-tion were hsa-miR-10b, hsa-miR-146b-3p, hsa-miR-1324, hsa-miR-873, hsa-miR-1275, hsa-miR-129-3p, hsa-miR-124, hsa-miR-200c, hsa-miR-134, hsa-miR-139-3p, hsa-miR-122, 1227, 136, 127-3p, and hsa-miR-885-3p (Table 1).
Using these 15 miRNAs in the optimal combination, analysis of two-way hierarchical clustering was applied to
all samples (n=65) in database GSE39040, and the result was
similar to that in Figure 2A; namely, samples of the same type also tended to gather together (Figure 3A). Moreover, the SVM classifier constructed by these 15 miRNAs could
OncoTargets and Therapy downloaded from https://www.dovepress.com/ by 118.70.13.36 on 25-Aug-2020
Dovepress Therapeutic targets for osteosarcoma
accurately classify 58 of the 65 samples. The classification scatter diagram and ROC chart of samples are shown in Figure 3B and C, respectively.
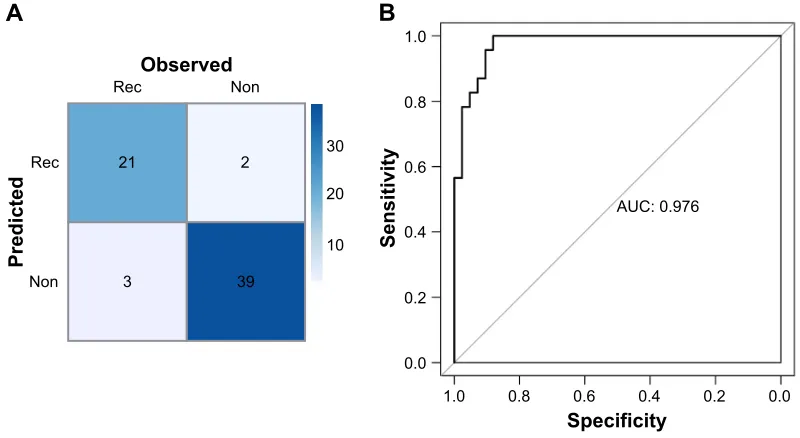
For the RF classifier, those 15 miRNAs could accurately classify 60 of the 65 samples, including 21 recurrence sam-ples and 39 non-recurrence samsam-ples. The RF classification confusion table diagram and the ROC chart of samples are shown in Figure 4A and B, respectively.
independent validation and evaluation
of SVM classifier performance
GSE39052 and GSE79181, the remaining two datasets, were regarded as the verification sets to confirm robustness and transferability of the constructed classifier. The results showed that the SVM classifier categorized 22 samples
precisely in GSE39052, with a classification accuracy rate of 84.62% (22/26); 21 of 23 samples were accurately clas-sified in GSE79181, with 91.3% accuracy rate. The scatter diagrams and ROC charts of the two abovementioned datasets are presented in Figure 5.
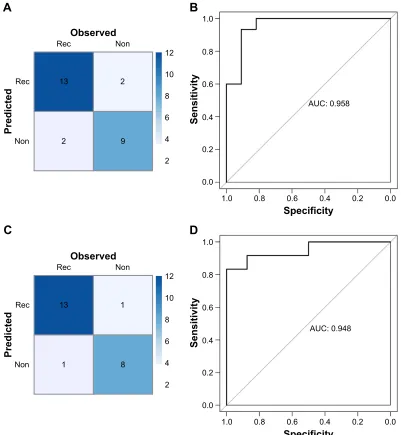
Moreover, the RF classifier was validated in GSE39052 and GSE79181 datasets, which also showed high accuracy in recurrence status classification. The accuracy were 84.62% (22/26) in GSE39052 and 91.3% (21/23) in GSE79181 (Figure 6).
Furthermore, the sample classification effect of the SVM and RF classifier after training was evaluated using a variety of indicators, such as “Correct Rate”, “Sensitivity”, “Specificity”, “PPV”, “NPV”, and “AUROC”, which are described in Table 2.
Figure 1 heat maps of datasets gse39052, gse39040, and gse79181.
1RQ 1RQ 1RQ 1RQ 5HF 1RQ 1RQ 1RQ 1RQ 1RQ 1RQ 1RQ 1RQ 1RQ 1RQ 1RQ 1RQ 1RQ 1RQ 1RQ 1RQ
*6( *6( *6(
5HF 5HF 5HF 5HF 5HF 5HF 5HF 5HF 5HF 5HF 5HF 5HF 5HF 5HF 5HF 5HF
Figure 2 Bidirectional hierarchical clustering of 78 mirnas based on their expression value (A) and feature elimination curves of 78 mirna (B).
$FFXUDF\UDWLR
6HOHFWHGIHDWXUHPL51$
&RORUNH\
9DOXH
KVDPL5 KVDPL5 KVDPL5S KVDPL5S KVDPL5 KVDPL5 KVDPL5 KVDPL5S KVDPL5S KVDPL5S KVDPL5S KVDPL5S KVDPL5 KVDPL5S KVDPL5 KVDPL5F KVDPL5DS KVDPL5 KVDPL5 KVDPL5 KVDPL5S KVDPL5 KVDPL5S KVDPL5S KVDPL5 KVDPL5S KVDPL5 KVDPL5S KVDPL5E KVDPL5S KVDPL5 KVDPL5 KVDPL5S KVDPL5S KVDPL5I KVDPL5 KVDPL5 KVDPL5 KVDPL5 KVDPL5G KVDPL5F KVDPL5 KVDPL5FS KVDPL5 KVDPL5 KVDPL5D KVDPL5 KVDPL5 KVDPL5 KVDPL5 KVDPL5 KVDPL5S KVDPL5 KVDPL5 KVDPL5 KVDPL5 KVDPL5 KVDPL5S KVDPL5S KVDPL5ES KVDPL5 KVDPL5 KVDPL5S KVDPL5 KVDPL5 KVDPL5 KVDPL5D KVDPL5S KVDPL5D KVDPL5F KVDPL5 KVDPL5D KVDPL5S KVDPL5S KVDPL5S KVDPL5S KVDPL5E
$
%
OncoTargets and Therapy downloaded from https://www.dovepress.com/ by 118.70.13.36 on 25-Aug-2020
Dovepress
he et al
correlation analysis between optimal
feature mirna combination and
recurrence time
Expression values of the optimal feature miRNAs and recur-rence time of each corresponding sample were obtained in the GSE39040 dataset, and all samples in the set were divided into a non-recurrence group and a recurrence group by the constructed SVM model. Kaplan–Meier survival analysis was then carried out for the two groups. The result showed that the survival time of the non-recurrence group was significantly longer compared to the recurrence group
(P=4.61e-05; Figure 7).
In addition, using expression values of the optimal 15 miRNAs as variables, their correlation with the recurrence
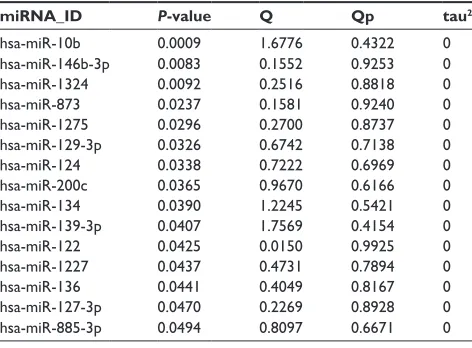
Table 1 Statistical parameters of 15 miRNAs of optimal
combi-nation
miRNA_ID P-value Q Qp tau2
hsa-miR-10b 0.0009 1.6776 0.4322 0 hsa-miR-146b-3p 0.0083 0.1552 0.9253 0 hsa-miR-1324 0.0092 0.2516 0.8818 0 hsa-miR-873 0.0237 0.1581 0.9240 0 hsa-miR-1275 0.0296 0.2700 0.8737 0 hsa-miR-129-3p 0.0326 0.6742 0.7138 0 hsa-miR-124 0.0338 0.7222 0.6969 0 hsa-miR-200c 0.0365 0.9670 0.6166 0 hsa-miR-134 0.0390 1.2245 0.5421 0 hsa-miR-139-3p 0.0407 1.7569 0.4154 0 hsa-miR-122 0.0425 0.0150 0.9925 0 hsa-miR-1227 0.0437 0.4731 0.7894 0 hsa-miR-136 0.0441 0.4049 0.8167 0 hsa-miR-127-3p 0.0470 0.2269 0.8928 0 hsa-miR-885-3p 0.0494 0.8097 0.6671 0
Figure 3 Bidirectional hierarchical clustering of 15 mirnas from the optimal mirna combination (A), scatter diagram (B), and rOc chart (C) of gse39040 samples using
the SVM classifier.
Abbreviations: aUc, area under curve; sVM, support vector machine.
&RORUNH\
9DOXH
KVDPL5 KVDPL5S KVDPL5F KVDPL5 KVDPL5S KVDPL5 KVDPL5S KVDPL5 KVDPL5 KVDPL5 KVDPL5 KVDPL5 KVDPL5ES KVDPL5E KVDPL5S
$
6HQVLWLYLW\
6SHFLILFLW\
$8&
±
±
±
±
;SRVLWLRQ
<SRVLWLRQ
±
%
&
1RQUHFXUUHQFH 5HFXUUHQFH
OncoTargets and Therapy downloaded from https://www.dovepress.com/ by 118.70.13.36 on 25-Aug-2020
Dovepress Therapeutic targets for osteosarcoma
Figure 4 confusion table diagram (A) and rOc chart (B) of GSE39040 samples using the RF classifier.
Abbreviations: AUC, area under curve; Non, non-recurrence; Rec, recurrence; RF, random forest; ROC, receiver operating characteristic curve.
21 2
3 39
Non
Observed
Predicte
d Rec
Rec Non
30
20
10
1.0
0.8
0.6
0.4
AUC: 0.976
0.2
0.0
0.0 0.2 0.4 0.6
Specificity
Sensitivit
y
0.8 1.0
B
A
Figure 5 Scatter diagram and ROC chart of classification by the SVM classifier in validation datasets GSE39052 (A, B) and gse79181 (C, D). Abbreviations: aUc, area under curve; rOc, receiver operating characteristic curve; sVM, support vector machine.
6SHFLILFLW\
6HQVLWLYLW\
$8&
6SHFLILFLW\
6HQVLWLYLW\
$8&
±
±
±
;SRVLWLRQ
<SRVLWLRQ
1RQUHFXUUHQFH 5HFXUUHQFH
± ± ±
±
;SRVLWLRQ
<
SRVLWLRQ
1RQUHFXUUHQFH 5HFXUUHQFH
$
%
&
'
OncoTargets and Therapy downloaded from https://www.dovepress.com/ by 118.70.13.36 on 25-Aug-2020
Dovepress
he et al
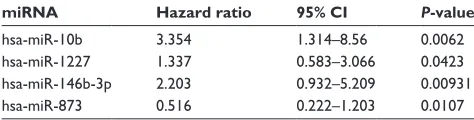
time and sample status (recurrence or non-recurrence) according to clinical information was analyzed by Cox regression analysis. Four miRNAs were significantly corre-lated with recurrence, including hsa-miR-10b, hsa-miR-1227,
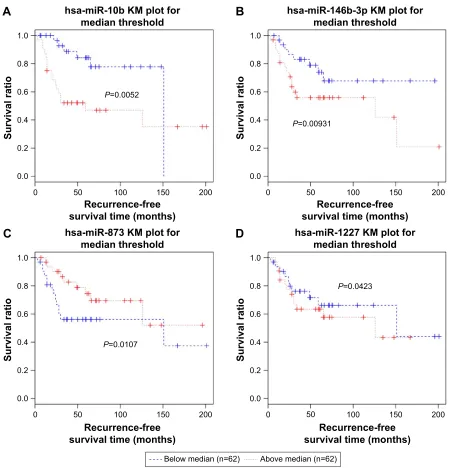
hsa-miR-146b-3p, and hsa-miR-873 (Table 3). Kaplan–Meier survival curve analysis was conducted to validate the signifi-cant relevance between the expression of the four miRNAs and recurrence (Figure 8). With median expression of each of
1RQ
2EVHUYHG
3UHGLFWHG
5HF
5HF 1RQ
$8&
6SHFLILFLW\
6HQVLWLYLW\
%
$
1RQ
2EVHUYHG
3UHGLFWHG
5HF
5HF 1RQ
$8&
6SHFLILFLW\
6HQVLWLYLW\
'
&
Figure 6 confusion table diagram (A) and rOc chart (B) by the RF classifier in validation datasets GSE39052 (A, B) and gse79181 (C, D). Abbreviations: AUC, area under curve; Non, non-recurrence; Rec, recurrence; RF, random forest; ROC, receiver operating characteristic curve.
Table 2 List of index items used in evaluating classification effect of the SVM and RF classifier in the test datasets
Datasets Number of
samples
Correct rate Sensitivity Specificity PPV NPV AUROC
SVM classifier
gse39040 65 0.892 0.87 0.905 0.833 0.927 0.962
gse39052 26 0.846 0.867 0.818 0.867 0.818 0.903
gse79181 23 0.913 0.929 0.889 0.929 0.889 0.979
RF classifier
gse39040 65 0.923 0.875 0.951 0.913 0.929 0.976
gse39052 26 0.846 0.867 0.818 0.867 0.818 0.958
gse79181 23 0.913 0.927 0.889 0.929 0.889 0.948
Abbreviations: aUrOc, area under the rOc curve; PPV, positive predictive value; nPV, negative predictive value; rF, random forest; sVM, support vector machine; rOc,
receiver operating characteristic curve.
OncoTargets and Therapy downloaded from https://www.dovepress.com/ by 118.70.13.36 on 25-Aug-2020
Dovepress Therapeutic targets for osteosarcoma
the four miRNAs as the cutoff, all samples in the GSE39040 dataset were divided into two groups, separately. With regard to each miRNA, differences in the recurrence-free survival time between the patients with above-median value and the patients with below-median value were significant
(P,0.05).
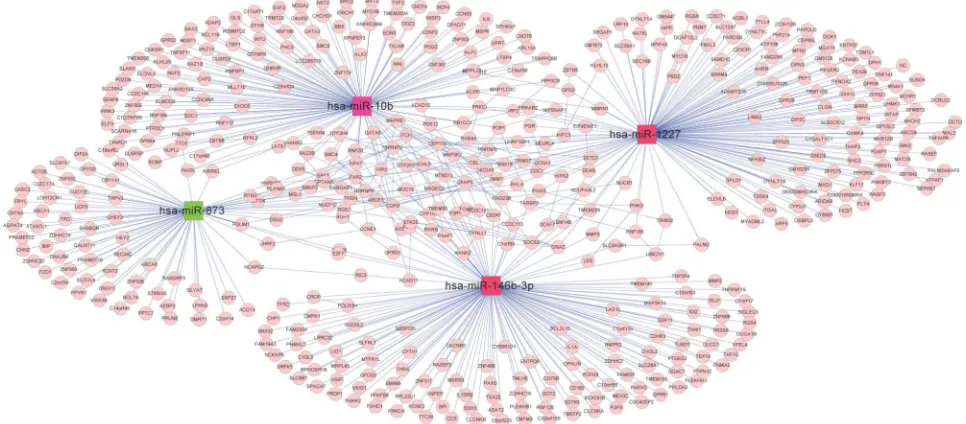
interaction network analysis of target
genes regulated by mirna
Target genes of the four abovementioned miRNAs, including miR-10b, miR-1227, miR-146b-3p, and hsa-miR-873, were discovered from the miRTarBase database, whose gene numbers were 137, 147, 145, and 77, separately. The interactive relationships among these target genes were comprehensively searched in the three protein databases as described in the section “Data and methods”, and 141 pairs of gene links were obtained. Interaction networks of target genes under regulation of the four miRNAs were built by integrat-ing two kinds of connections – miRNA–gene and gene–gene. The network contained two types of nodes after visualization by Cytoscape: compared with the non-recurrence group, a red square node represented a miRNA with upregulated expression in the recurrence group, and a green square node stood for a miRNA with downregulated expression in the
recurrence group. Moreover, pink rounds indicated target genes (Figure 9).
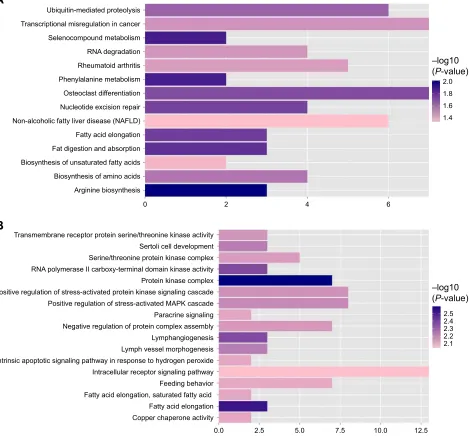
Function annotation and pathway
enrichment of target genes in mirna
regulation network
The functions and pathways of target genes involved in the above interaction networks were enriched by the hyper-geometric distribution pathway enrichment analysis using Fisher algorithm. The results in Figure 10 indicated 14 significant KEGG pathways (Figure 10A) and 17 significant GO function terms (Figure 10B and Table S2). Among these significant KEGG pathways, one named the “Osteoclast differentiation” pathway was considered to be closely related to osteoblasts and osteosarcoma, and significantly involved a total of seven target genes, including Interleukin 1 alpha (IL1A), CAMK4, TNFSF11, NCF4, PPP3CB, MAP3K7, and suppressor of cytokine signaling (SOCS) 3 (Table S3). They were validated to be targeted by hsa-miR-10b, hsa-miR-1227, and hsa-miR-146b-3p, separately, in this study.
Searching of osteosarcoma-related
lncrnas and establishment of relationships
among lncrna, mirna, and target genes
Three lncRNAs – named BC040587,34 LSAMP-AS3,35 and
MALAT113 – were checked for an association with
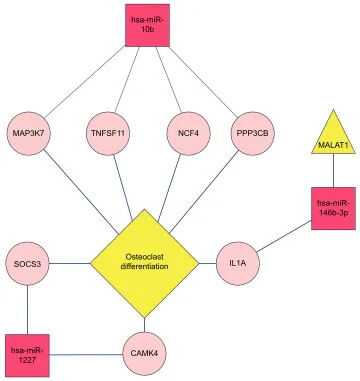
osteosar-coma in the LncRNADisease database. miRNAs regulated by the three lncRNAs were searched in the miRecode and starBase databases and, afterward, compared with the four obtained important miRNAs in hsa-miR-10b, hsa-miR-1227, hsa-miR-146b-3p, hsa-miR-873. A regulatory network of the lncRNA–miRNA–target gene pathway was built by integrat-ing various relationships between lncRNA and miRNAs, miRNAs and target genes, and target genes involved in pathways (Figure 11). In the regulatory network, MALAT1 may directly regulate hsa-miR-146b-3p, which imposed a regulatory effect on the IL1A gene involved in the osteogenic differentiation pathway related to osteosarcoma.
Discussion
Metastasis and recurrence are the main factors that affect the prognosis of osteosarcoma, and involve a series of functional and regulating factors, such as miRNAs. Recent research demonstrated that miRNAs played important roles in the occurrence and development of osteosarcoma, and there were
abnormal expressions of many miRNAs in osteosarcoma.4–9
There was great significance and relevance in comparing the expression of miRNAs between osteosarcoma recurrence
3 H
5HFXUUHQFHIUHHVXUYLYDOWLPHPRQWKV
6XUYLYDOUDWLR
1RQUHFXUUHQFH 5HFXUUHQFH
Figure 7 Kaplan–Meier survival curve between recurrence and non-recurrence samples.
Table 3 results of cox regression analysis
miRNA Hazard ratio 95% CI P-value
hsa-miR-10b 3.354 1.314–8.56 0.0062 hsa-miR-1227 1.337 0.583–3.066 0.0423 hsa-miR-146b-3p 2.203 0.932–5.209 0.00931 hsa-miR-873 0.516 0.222–1.203 0.0107
OncoTargets and Therapy downloaded from https://www.dovepress.com/ by 118.70.13.36 on 25-Aug-2020
Dovepress
he et al
samples and osteosarcoma non-recurrence samples. In the present study, three miRNA expression profiles related to osteosarcoma recurrence samples and osteosarcoma non-recurrence samples – named GSE39052, GSE39040, and GSE79181 – were first downloaded from GEO DataSets, and then the DEmiRs were screened using MetaDE.ES of
the MetaDE package.27 In total, 78 significantly DEmiRs
were screened from the three datasets, and hierarchical clustering analysis on the basis of these miRNAs expression values indicated that the same-type samples in the GSE39040 dataset tended to gather together. The top ten DEmiRs were hsa-miR-432, hsa-miR-329, hsa-miR-889, hsa-miR-337-3p,
635, 296-3p, 548c-3p, miR-625, miR-551a, and miR-510. Among these,
hsa-miR-337-3p,36 miR-62537, and miR-551a38 were reported to
be associated with lymph node metastasis of human gastric cancer, indicating the potential relationship between these miRNAs and osteosarcoma.
The SVM, a supervised machine-learning technique, has been shown to perform well in multiple areas of bio-logical analysis, including evaluating microarray expression data,39 and in analyzing expression data.40,41 In the present
study, in order to construct a specimen classification model using the SVM, the selection of optimal feature miRNA
A
B
C
D
hsa-miR-10b KM plot for median threshold
P=0.0052 1.0
0.8
0.6
0.4
0.2
0.0
0 50 100 150 200
Survival ratio
Recurrence-free survival time (months)
hsa-miR-146b-3p KM plot for median threshold
P=0.00931 1.0
0.8
0.6
0.4
0.2
0.0
0 50 100 150 200
Survival ratio
Recurrence-free survival time (months) hsa-miR-1227 KM plot for
median threshold
P=0.0423 1.0
0.8
0.6
0.4
0.2
0.0
0 50 100 150 200
Survival ratio
Recurrence-free survival time (months) hsa-miR-873 KM plot for
median threshold
P=0.0107 1.0
0.8
0.6
0.4
0.2
0.0
0 50 100 150 200
Survival ratio
Recurrence-free survival time (months)
Below median (n=62) Above median (n=62)
Figure 8 Kaplan–Meier curves of hsa-miR-10b (A), hsa-miR-146b-3p (B), hsa-miR-873 (C), and hsa-miR-1227 (D), which are significantly associated with recurrence information.
OncoTargets and Therapy downloaded from https://www.dovepress.com/ by 118.70.13.36 on 25-Aug-2020
Dovepress Therapeutic targets for osteosarcoma
combination was first done in the GSE39040 dataset, and results showed that the optimal miRNA combination had the highest classification accuracy (89.2%) when the number of miRNA was set at 15. Further analysis of two-way hier-archical clustering was applied to samples in the GSE39040 database using the 15 miRNAs in the optimal combination, and the result was similar to that obtained using 78 signifi-cantly DEmiRs. Moreover, the SVM classifier constructed by these 15 miRNAs could accurately classify 58 of 65 samples in the GSE39040 database, and this sample clas-sification effect was validated and evaluated in another two databases – GSE39052 and GSE79181 – which showed that the classifier could successfully categorize 22 samples in GSE39052 (84.62%, 22/26) and 21 samples in GSE79181 (91.3%, 21/23), indicating the sound performance of the SVM classifier constructed in the present study.
Kaplan–Meier survival analysis is one of the best options to measure the fraction of subjects living for a certain amount of time after treatment.42,43 In the present study, Kaplan–
Meier survival analysis was first carried out according to the expression values of optimal feature miRNAs, the recurrence time of each corresponding sample, and the status (including recurrence and no recurrence) classified by the previously constructed SVM model, and the results showed that the survival time of the non-recurrence group was significantly longer than that of the recurrence group, and the decline rates of the survival ratio of the former group were signifi-cantly lower than that of the latter group. In addition, using
expression values of the 15 optimal miRNAs as variables, their correlation with the recurrence time and sample status was analyzed by Cox regression, and four significantly correlated miRNAs – miR-10b, miR-1227, hsa-miR-146b-3p, and hsa-miR-873 – were identified. The hsa-miR-10b is a particularly interesting candidate miRNA, given its close correlations with metastatic behaviors of
breast cancer44 and gastric cancer.45 The hsa-miR-1227, a
miRNA abundant in large oncosomes, can enhance
migra-tion of cancer-associated fibroblasts.46 A number of studies
have examined the role of miR-146b microRNAs in cancer cell lines, one isoform of which, miR-146b-3p, was identi-fied as a frequent constituent of six-miRNA SVM classifiers that could predict recurrence with a mean accuracy of 69%; the expression level of miR-146b-3p in human non-small cell lung cancer was associated with the recurrence of this
cancer postoperatively.47 The hsa-miR-873 is a novel tumor
suppressor in ER-positive breast cancer48 and can inhibit
tumorigenesis and metastasis of glioblastoma.49 This study
suggests that these four miRNAs might be possible biomark-ers for osteosarcoma recurrence.
It is well known that miRNAs are involved in cancer initiation and progression as well as in multiple metabolic
pathways by regulating target gene expression.50,51 Due
to the rapid development in bioinformatics and statistical genomics, gene network analysis has become a powerful approach that considers gene interactions and has been widely applied in gene expression studies of humans and Figure 9 Interaction network among target genes of hsa-miR-10b, hsa-miR-1227, hsa-miR-146b-3p, and hsa-miR-873. A pink circle indicates a target gene; a red square node indicates a miRNA with upregulated expression in the recurrence group against the non-recurrence group, whereas a green square node indicates a downregulated miRNA in the recurrence group.
OncoTargets and Therapy downloaded from https://www.dovepress.com/ by 118.70.13.36 on 25-Aug-2020
Dovepress
he et al
model organisms.24,26 In the present study, 141 pairs of
interaction links between hsa-miR-1227, hsa-miR-146-b-3p, hsa-miR-873, and their target genes were obtained, and interaction networks were built by integrating the two kinds of connections, miRNA–gene and gene–gene. As genes that are highly interconnected within the network are usually involved in the same biological modules or pathways, functional annotations of the miRNA targeted genes according to GO and KEGG databases would provide ample numbers of candidate genes and more information about the mechanism of osteosarcoma. In total, 17 GO functionally annotated terms and 14 KEGG pathways were identified, of which one KEGG pathway was “Osteoclast differentiation”, which was closely related to osteoblasts
and osteosarcoma.52,53 There were a total of seven target
genes involved in the “Osteoclast differentiation” pathway, including IL1A, CAMK4, TNFSF11, NCF4, PPP3CB, MAP3K7, and SOCS3. The IL1A is known as a mediator of inflammation and a regulator of the blood–testis barrier, and participates in inhibiting Leydig cell steroidogenesis and
stimulating Sertoli cell transfer.54 TNFSF11 is a member of
the tumor necrosis factor family and plays essential roles in lymph node organogenesis, normal cellular immunity,
osteoclastogenesis, and skeletal development.55 MAP3K7,
also known as TGFβ-associated kinase 1 (TAK1), is
asso-ciated with early prostate-specific antigen recurrence in
prostate cancer.56 SOCS3 is a cytokine-inducible inhibitor
with critical, but selective, cell-specific effects, and also
7UDQVPHPEUDQHUHFHSWRUSURWHLQVHULQHWKUHRQLQHNLQDVHDFWLYLW\
%
6HUWROLFHOOGHYHORSPHQW 6HULQHWKUHRQLQHSURWHLQNLQDVHFRPSOH[ 51$SRO\PHUDVH,,FDUER[\WHUPLQDOGRPDLQNLQDVHDFWLYLW\ 3URWHLQNLQDVHFRPSOH[ 3RVLWLYHUHJXODWLRQRIVWUHVVDFWLYDWHGSURWHLQNLQDVHVLJQDOLQJFDVFDGH 3RVLWLYHUHJXODWLRQRIVWUHVVDFWLYDWHG0$3.FDVFDGH 3DUDFULQHVLJQDOLQJ 1HJDWLYHUHJXODWLRQRISURWHLQFRPSOH[DVVHPEO\ /\PSKDQJLRJHQHVLV /\PSKYHVVHOPRUSKRJHQHVLV ,QWULQVLFDSRSWRWLFVLJQDOLQJSDWKZD\LQUHVSRQVHWRK\GURJHQSHUR[LGH
)DWW\DFLGHORQJDWLRQVDWXUDWHGIDWW\DFLG ,QWUDFHOOXODUUHFHSWRUVLJQDOLQJSDWKZD\ )HHGLQJEHKDYLRU
)DWW\DFLGHORQJDWLRQ &RSSHUFKDSHURQHDFWLYLW\
±ORJ 3YDOXH
8ELTXLWLQPHGLDWHGSURWHRO\VLV
$
7UDQVFULSWLRQDOPLVUHJXODWLRQLQFDQFHU 6HOHQRFRPSRXQGPHWDEROLVP 51$GHJUDGDWLRQ 5KHXPDWRLGDUWKULWLV 3KHQ\ODODQLQHPHWDEROLVP 2VWHRFODVWGLIIHUHQWLDWLRQ 1XFOHRWLGHH[FLVLRQUHSDLU 1RQDOFRKROLFIDWW\OLYHUGLVHDVH1$)/' )DWW\DFLGHORQJDWLRQ )DWGLJHVWLRQDQGDEVRUSWLRQ %LRV\QWKHVLVRIXQVDWXUDWHGIDWW\DFLGV %LRV\QWKHVLVRIDPLQRDFLGV $UJLQLQHELRV\QWKHVLV
±ORJ 3YDOXH
Figure 10 Kegg pathway (A) and column chart of gO function annotation (B) significantly related to target genes.
Abbreviations: gO, gene ontology; Kegg, Kyoto encyclopedia of genes and genomes.
OncoTargets and Therapy downloaded from https://www.dovepress.com/ by 118.70.13.36 on 25-Aug-2020
Dovepress Therapeutic targets for osteosarcoma
hsa-miR-10b
MAP3K7 TNFSF11 NCF4 PPP3CB
MALAT1
hsa-miR-146b-3p
hsa-miR-1227
SOCS3 IL1A
CAMK4 Osteoclast differentiation
Figure 11 A regulatory network of lncRNA–miRNA–target gene pathway significantly related to osteosarcoma.
acts as an essential negative regulator of IL-23 signaling, the inhibition of which constrains the generation of Th17
differentiation.57 These target genes were validated to be
targeted by hsa-miR-10b, hsa-miR-1227, and hsa-miR-146-b-3p, separately. These results suggest that hsa-miR-10b, hsa-miR-1227, and hsa-miR-146b-3p might exert an effect on the osteoclast differentiation pathway via regulation of the seven target genes, thus affecting recurrence.
Considering lncRNAs may participate in the regulation of diverse cellular processes, such as cell proliferation and
apoptosis, stem cell pluripotency, and development,10–12
a series of lncRNAs have been shown to be involved in the osteosarcoma. Emerging studies have suggested that several lncRNAs play a regulatory role in cellular processes via a complicated network involving mRNAs, miRNAs, and
protein.58,59 Furthermore, networks involving lncRNAs,
miRNAs, and mRNAs were explored in the present study. lncRNAs related to osteosarcoma were searched in the
LncRNADisease database,31 which screened out three
lncRNAs – BC040587,34 LSAMP-AS3,35 and MALAT1.13
The regulatory relationship between osteosarcoma-related lncRNAs and miRNA-targeted genes was then built accord-ing to the previously obtained miRNAs relevant to this disease. The result showed that MALAT1 might directly regulate hsa-miR-146b-3p, which exerted a regulatory effect on the IL1A gene involved in the osteogenic differentiation pathway related to osteosarcoma. Previous studies have proved that MALAT1 could promote proliferation and metastasis of osteosarcoma cells by activating the PI3K_Akt pathway,13 and could be a potential therapeutic target in
osteosarcoma.60 All of the above published studies prove
the reliability of our present study and, therefore, the rest of the identified miRNAs and lncRNAs could be fresh fac-tors related to the survival of patients with osteosarcoma. It should be mentioned that biological experiments were not carried out in this study. Further experimental studies using a large cohort of samples will be undertaken to validate the findings of this study.
OncoTargets and Therapy downloaded from https://www.dovepress.com/ by 118.70.13.36 on 25-Aug-2020
Dovepress
he et al
Conclusion
This study proposes a 15-miRNAs-based SVM classifier as a potential useful tool to predict osteosarcoma recurrence. The hsa-miR-10b, hsa-miR-1227, hsa-miR-146b-3p, and hsa-miR-873 miRNAs were closely associated with recur-rence of osteosarcoma. Several pathways and GO functions significantly enriched with target genes of the four miRNAs were unraveled. LncRNA MALAT1 may directly regulate IL1A, involved in the osteoclast differentiation pathway, by targeting hsa-miR-146b-3p in osteosarcoma. Our results suggest possible mechanisms of osteosarcoma metastasis and recurrence, and provide DEmiRs which could be applied as potential biomarkers or therapeutic targets for osteosarcoma recurrences. More studies are warranted to verify the results of this study.
Disclosure
The authors report no conflicts of interest in this work.
References
1. Picci P. Osteosarcoma (osteogenic sarcoma). Orphanet J Rare Dis. 2007;2(6):1–4.
2. Weeden S, Grimer RJ, Cannon SR, Taminiau AH, Uscinska BM; European Osteosarcoma Intergroup. The effect of local recurrence on survival in resected osteosarcoma. Eur J Cancer. 2001;37(1):39–46. 3. Bartel DP. MicroRNAs: genomics, biogenesis, mechanism, and
func-tion. Cell. 2004;116(2):281–297.
4. Kobayashi E, Hornicek FJ, Duan Z. MicroRNA involvement in osteo-sarcoma. Sarcoma. 2012;2012:359739.
5. Yuan J, Lang J, Liu C, Zhou K, Chen L, Liu Y. The expression and function of miRNA-451 in osteosarcoma. Med Oncol. 2015;32(1):324. 6. Zhang H, Cai X, Wang Y, Tang H, Tong D, Ji F. microRNA-143, down-regulated in osteosarcoma, promotes apoptosis and suppresses tumori-genicity by targeting Bcl-2. Oncol Rep. 2010;24(5):1363–1369. 7. Duan Z, Choy E, Harmon D, et al. MicroRNA-199a-3p is downregulated
in human osteosarcoma and regulates cell proliferation and migration.
Mol Cancer Ther. 2011;10(8):1337–1345.
8. Liu LH, Li H, Li JP, et al. miR-125b suppresses the proliferation and migration of osteosarcoma cells through down-regulation of STAT3.
Biochem Biophys Res Commun. 2011;416(1–2):31–38.
9. Maire G, Martin JW, Yoshimoto M, Chilton-MacNeill S, Zielenska M, Squire JA. Analysis of miRNA-gene expression-genomic profiles reveals complex mechanisms of microRNA deregulation in osteosar-coma. Cancer Genet. 2011;204(3):138–146.
10. Deng Q, He B, Gao T, et al. Up-regulation of 91H promotes tumor metastasis and predicts poor prognosis for patients with colorectal cancer. PLoS One. 2014;9(7):e103022.
11. Gupta RA, Shah N, Wang KC, et al. Long non-coding RNA HOTAIR reprograms chromatin state to promote cancer metastasis. Nature. 2010;464(7291):1071–1076.
12. Prensner JR, Iyer MK, Sahu A, et al. The long noncoding RNA SChLAP1 promotes aggressive prostate cancer and antagonizes the SWI/SNF complex. Nat Genet. 2013;45(11):1392–1398.
13. Dong Y, Liang G, Yuan B, Yang C, Gao R, Zhou X. MALAT1 promotes the proliferation and metastasis of osteosarcoma cells by activating the PI3K/Akt pathway. Tumour Biol. 2015;36(3):1477–1486.
14. Zhang Q, Geng PL, Yin P, Wang XL, Jia JP, Yao J. Down-regulation of long non-coding RNA TUG1 inhibits osteosarcoma cell prolifera-tion and promotes apoptosis. Asian Pac J Cancer Prev. 2013;14(4): 2311–2315.
15. Tian ZZ, Guo XJ, Zhao YM, Fang Y. Decreased expression of long non-coding RNA MEG3 acts as a potential predictor biomarker in progression and poor prognosis of osteosarcoma. Int J Clin Exp Pathol. 2015;8(11):15138–15142. eCollection 2015.
16. Zhou M, Wang X, Shi H, et al. Characterization of long non-coding RNA-associated ceRNA network to reveal potential prognostic lncRNA biomarkers in human ovarian cancer. Oncotarget. 2016;7(11): 12598–12611.
17. Ma B, Li M, Zhang L, et al. Upregulation of long non-coding RNA TUG1 correlates with poor prognosis and disease status in osteosar-coma. Tumour Biol. 2016;37(4):4445–4455.
18. Zhao H, Hou W, Tao J, et al. Upregulation of lncRNA HNF1A-AS1 promotes cell proliferation and metastasis in osteosarcoma through activation of the Wnt/β-catenin signaling pathway. Am J Transl Res. 2016;8(8):3503–3512. eCollection 2016.
19. Jendrzejewski J, He H, Radomska HS, et al. The polymorphism rs944289 predisposes to papillary thyroid carcinoma through a large intergenic noncoding RNA gene of tumor suppressor type. Proc Natl
Acad Sci U S A. 2012;109(22):8646–8651.
20. Johnsson P, Ackley A, Vidarsdottir L, et al. A pseudogene long non-coding RNA network regulates PTEN transcription and translation in human cells. Nat Struct Mol Biol. 2013;20(4):440–446.
21. Liz J, Esteller M. lncRNAs and microRNAs with a role in cancer development. Biochim Biophys Acta. 2016;1859(1):169–176. 22. Tan JY, Sirey T, Honti F, et al. Extensive microRNA-mediated crosstalk
between lncRNAs and mRNAs in mouse embryonic stem cells. Genome
Res. 2015;25(5):655–666.
23. Cao MX, Jiang YP, Tang YL, Liang XH. The crosstalk between lncRNA and microRNA in cancer metastasis: orchestrating the epithelial-mesenchymal plasticity. Oncotarget. 2017;8(7):12472–12483. 24. Lee I, Date SV, Adai AT, Marcotte EM. A probabilistic functional
network of yeast genes. Science. 2004;306(5701):1555–1558. 25. Oldham MC, Konopka G, Iwamoto K, et al. Functional organization of the
transcriptome in human brain. Nat Neurosci. 2008;11(11):1271–1282. 26. Ponomarev I, Wang S, Zhang L, Harris RA, Mayfield RD. Gene coex-pression networks in human brain identify epigenetic modifications in alcohol dependence. J Neurosci. 2012;32(5):1884–1897.
27. Li J, Tseng GC. An adaptively weighted statistic for detecting differen-tial gene expression when combining multiple transcriptomic studies.
Ann Appl Stat. 2011;5(2A):994–1019.
28. Baur B, Bozdag S. A feature selection algorithm to compute gene cen-tric methylation from probe level methylation data. PLoS One. 2016; 11(2):e0148977.
29. Hsu SD, Lin FM, Wu WY, et al. miRTarBase: a database curates experimentally validated microRNA-target interactions. Nucleic Acids
Res. 2011;39(Database issue):D163–D169.
30. Chou CH, Chang NW, Shrestha S, et al. miRTarBase 2016: updates to the experimentally validated miRNA-target interactions database.
Nucleic Acids Res. 2016;44(D1):D239–D247.
31. Chen G, Wang Z, Wang D, et al. LncRNADisease: a database for long-non-coding RNA-associated diseases. Nucleic Acids Res. 2013; 41(Database issue):D983–D986.
32. Robinson MD, McCarthy DJ, Smyth GK. edgeR: a Bioconductor package for differential expression analysis of digital gene expression data. Bioinformatics. 2010;26(1):139–140.
33. Ge Y, Dudoit S, Speed TP. Resampling-based multiple testing for microarray data analysis. Test. 2003;12(1):1–77.
34. Pasic I, Shlien A, Durbin AD, et al. Recurrent focal copy-number changes and loss of heterozygosity implicate two noncoding RNAs and one tumor suppressor gene at chromosome 3q13.31 in osteosarcoma.
Cancer Res. 2010;70(1):160–171.
35. Lipovich L, Johnson R, Lin CY. MacroRNA underdogs in a microRNA world: evolutionary, regulatory, and biomedical significance of mam-malian long non-protein-coding RNA. Biochim Biophys Acta. 2010; 1799(9):597–615.
36. Wang Z, Wang J, Yang Y, et al. Loss of hsa-miR-337-3p expression is associated with lymph node metastasis of human gastric cancer. J Exp
Clin Cancer Res. 2013;32:76.
OncoTargets and Therapy downloaded from https://www.dovepress.com/ by 118.70.13.36 on 25-Aug-2020
Dovepress Therapeutic targets for osteosarcoma
37. Wang M, Li C, Nie H, et al. Down-regulated miR-625 suppresses invasion and metastasis of gastric cancer by targeting ILK. FEBS Lett. 2012;586(16):2382–2388.
38. Li Z, Cao Y, Jie Z, et al. miR-495 and miR-551a inhibit the migration and invasion of human gastric cancer cells by directly interacting with PRL-3. Cancer Lett. 2012;323(1):41–47.
39. Brown MP, Grundy WN, Lin D, et al. Knowledge-based analysis of microarray gene expression data by using support vector machines.
Proc Natl Acad Sci U S A. 2000;97(1):262–267.
40. Furey TS, Cristianini N, Duffy N, Bednarski DW, Schummer M, Haussler D. Support vector machine classification and validation of cancer tissue samples using microarray expression data. Bioinformatics. 2000;16(10):906–914.
41. Mukherjee S, Rifkin R. Support Vector Machine Classification of Microarray Data. AI Memo 1677. Cambridge, MA: Massachusetts Institute of Technology. 2010;1(5):1–4.
42. Goel MK, Khanna P, Kishore J. Understanding survival analysis: Kaplan-Meier estimate. Int J Ayurveda Res. 2010;1(4):274–278. 43. May WL. Kaplan-Meier survival analysis. In: Schwab M, editor.
Encyclopedia of Cancer. Berlin Heidelberg: Springer; 2008.
44. Ma L. Role of miR-10b in breast cancer metastasis. Breast Cancer Res. 2010;12(5):210.
45. Li Z, Lei H, Luo M, et al. DNA methylation downregulated mir-10b acts as a tumor suppressor in gastric cancer. Gastric Cancer. 2015; 18(1):43–54.
46. Morello M, Minciacchi VR, de Candia P, et al. Large oncosomes mediate intercellular transfer of functional microRNA. Cell Cycle. 2013;12(22):3526–3536.
47. Patnaik SK, Kannisto E, Mallick R, Yendamuri S. Overexpression of the lung cancer-prognostic miR-146b microRNAs has a minimal and negative effect on the malignant phenotype of A549 lung cancer cells.
PLoS One. 2011;6(7):e22379.
48. Cui J, Yang Y, Li H, et al. MiR-873 regulates ERα transcriptional activity and tamoxifen resistance via targeting CDK3 in breast cancer cells. Oncogene. 2015;34(30):3895–3907.
49. Wang RJ, Li JW, Bao BH, et al. MicroRNA-873 (miRNA-873) inhibits glioblastoma tumorigenesis and metastasis by suppressing the expres-sion of IGF2BP1. J Biol Chem. 2015;290(14):8938–8948.
50. Calin GA, Croce CM. MicroRNA-cancer connection: the beginning of a new tale. Cancer Res. 2006;66(15):7390–7394.
51. Paul P, Chakraborty A, Sarkar D, et al. Interplay between miRNAs and human diseases: a review. J Cell Physiol. Epub 2017 Feb 9. 52. Boyle WJ, Simonet WS, Lacey DL. Osteoclast differentiation and
activation. Nature. 2003;423(6937):337–342.
53. Thomas DM, Johnson SA, Sims NA, et al. Terminal osteoblast differen-tiation, mediated by runx2 and p27KIP1, is disrupted in osteosarcoma.
J Cell Biol. 2004;167(5):925–934.
54. Sarkar O, Mathur PP, Cheng CY, Mruk DD. Interleukin 1 alpha (IL1A) is a novel regulator of the blood-testis barrier in the rat. Biol Reprod. 2008;78(3):445–454.
55. Odgren PR, Kim N, Mackay CA, Mason-Savas A, Choi Y, Marks SC Jr. The role of RANKL (TRANCE/TNFSF11), a tumor necrosis factor family member, in skeletal development: effects of gene knockout and transgenic rescue. Connect Tissue Res. 2003;44(Suppl 1):264–271. 56. Kluth M, Hesse J, Heinl A, et al. Genomic deletion of MAP3K7 at 6q12-22
is associated with early PSA recurrence in prostate cancer and absence of TMPRSS2:ERG fusions. Mod Pathol. 2013;26(7):975–983. 57. Chen Z, Laurence A, Kanno Y, et al. Selective regulatory function of
Socs3 in the formation of IL-17-secreting T cells. Proc Natl Acad Sci
U S A. 2006;103(21):8137–8142.
58. Ernst C, Morton CC. Identification and function of long non-coding RNA. Front Cell Neurosci. 2013;7:168.
59. Yang G, Lu X, Yuan L. LncRNA: a link between RNA and cancer.
Biochim Biophys Acta. 2014;1839(11):1097–1109.
60. Cai X, Liu Y, Yang W, et al. Long noncoding RNA MALAT1 as a potential therapeutic target in osteosarcoma. J Orthop Res. 2016;34(6): 932–941.
OncoTargets and Therapy downloaded from https://www.dovepress.com/ by 118.70.13.36 on 25-Aug-2020
Dovepress
he et al
Supplementary materials
Table S1 Screened 78 miRNAs with significant differential
expression
miRNA_ID P-value Q Qp tau2
hsa-miR-432 0.00002 0.6704 0.7152 0 hsa-miR-329 0.00002 0.2139 0.8986 0 hsa-miR-889 0.0002 0.7548 0.6857 0 hsa-miR-337-3p 0.0002 0.0778 0.9619 0 hsa-miR-635 0.0004 0.4406 0.8023 0 hsa-miR-296-3p 0.0004 1.4533 0.4835 0 hsa-miR-548c-3p 0.0006 0.8417 0.6565 0 hsa-miR-625 0.0006 0.0724 0.9644 0 hsa-miR-551a 0.0006 0.2312 0.8908 0 hsa-miR-510 0.0006 0.0666 0.9672 0 hsa-miR-10b 0.0009 1.6776 0.4322 0 hsa-miR-375 0.0015 1.2804 0.5272 0 hsa-miR-586 0.0017 0.1737 0.9168 0 hsa-miR-211 0.0018 1.2030 0.5480 0 hsa-miR-338-3p 0.0030 0.3902 0.8227 0 hsa-miR-509-3-5p 0.0030 0.5238 0.7696 0 hsa-miR-601 0.0032 0.8572 0.6514 0 hsa-miR-506 0.0035 0.1168 0.9433 0 hsa-miR-493 0.0036 0.8930 0.6399 0 hsa-miR-382 0.0052 0.4549 0.7966 0 hsa-miR-448 0.0052 0.3315 0.8473 0 hsa-miR-485-3p 0.0056 1.9759 0.3723 0 hsa-miR-330-3p 0.0061 1.7235 0.4224 0 hsa-miR-885-5p 0.0062 0.4348 0.8046 0 hsa-miR-154 0.0067 0.5234 0.7697 0 hsa-miR-323-3p 0.0073 1.4660 0.4805 0 hsa-miR-381 0.0081 1.0856 0.5811 0 hsa-miR-146b-3p 0.0083 0.1552 0.9253 0 hsa-miR-1324 0.0092 0.2516 0.8818 0 hsa-miR-544 0.0095 0.2217 0.8951 0 hsa-miR-342-3p 0.0099 1.7962 0.4073 0 hsa-miR-944 0.0122 0.2137 0.8987 0 hsa-miR-409-3p 0.0124 0.3380 0.8445 0 hsa-miR-362-3p 0.0128 1.5226 0.4671 0 hsa-miR-520a-3p 0.0129 1.0973 0.5777 0 hsa-miR-299-5p 0.0141 0.9906 0.6094 0 hsa-miR-99b 0.0145 1.2373 0.5387 0 hsa-miR-576-3p 0.0198 1.0569 0.5895 0
(Continued)
Table S1 (Continued)
miRNA_ID P-value Q Qp tau2
hsa-miR-636 0.0202 0.9612 0.6184 0 hsa-miR-31 0.0207 1.4158 0.4927 0 hsa-miR-543 0.0219 0.0557 0.9725 0 hsa-miR-509-5p 0.0233 0.2104 0.9002 0 hsa-miR-873 0.0237 0.1581 0.9240 0 hsa-miR-572 0.0245 0.2224 0.8947 0 hsa-miR-148b 0.0251 1.7011 0.4272 0 hsa-miR-324-5p 0.0262 1.6948 0.4285 0 hsa-miR-422a 0.0262 0.3929 0.8217 0 hsa-miR-181a 0.0269 0.5740 0.7505 0 hsa-miR-25 0.0276 1.7530 0.4162 0 hsa-miR-29c 0.0286 0.3219 0.8513 0 hsa-miR-517c 0.0290 0.7942 0.6723 0 hsa-miR-501-5p 0.0296 0.7887 0.6741 0 hsa-miR-639 0.0296 0.6441 0.7247 0 hsa-miR-1275 0.0296 0.2700 0.8737 0 hsa-miR-129-3p 0.0326 0.6742 0.7138 0 hsa-miR-921 0.0327 0.3280 0.8487 0 hsa-miR-124 0.0338 0.7222 0.6969 0 hsa-miR-147 0.0358 0.4122 0.8138 0 hsa-miR-28-5p 0.0362 0.4770 0.7878 0 hsa-miR-200c 0.0365 0.9670 0.6166 0 hsa-miR-518f 0.0382 1.0540 0.5904 0 hsa-miR-134 0.0390 1.2245 0.5421 0 hsa-miR-29a 0.0395 0.4061 0.8162 0 hsa-miR-337-5p 0.0399 0.9856 0.6109 0 hsa-miR-501-3p 0.0402 1.0533 0.5906 0 hsa-miR-139-3p 0.0407 1.7569 0.4154 0 hsa-miR-122 0.0425 0.0150 0.9925 0 hsa-miR-431 0.0425 0.0928 0.9546 0 hsa-miR-630 0.0436 0.8171 0.6646 0 hsa-miR-1227 0.0437 0.4731 0.7894 0 hsa-miR-136 0.0441 0.4049 0.8167 0 hsa-miR-127-3p 0.0470 0.2269 0.8928 0 hsa-miR-204 0.0471 0.1403 0.9322 0 hsa-miR-361-3p 0.0471 0.5252 0.7691 0 hsa-miR-720 0.0488 0.1208 0.9414 0 hsa-miR-342-5p 0.0490 0.5989 0.7412 0 hsa-miR-885-3p 0.0494 0.8097 0.6671 0 hsa-miR-302d 0.0497 0.5082 0.7756 0
OncoTargets and Therapy downloaded from https://www.dovepress.com/ by 118.70.13.36 on 25-Aug-2020
OncoTargets and Therapy
Publish your work in this journal
Submit your manuscript here: http://www.dovepress.com/oncotargets-and-therapy-journal OncoTargets and Therapy is an international, peer-reviewed, open access journal focusing on the pathological basis of all cancers, potential targets for therapy and treatment protocols employed to improve the management of cancer patients. The journal also focuses on the impact of management programs and new therapeutic agents and protocols on
patient perspectives such as quality of life, adherence and satisfaction. The manuscript management system is completely online and includes a very quick and fair peer-review system, which is all easy to use. Visit http://www.dovepress.com/testimonials.php to read real quotes from published authors.
Dovepress
Dove
press
Therapeutic targets for osteosarcoma
Table S2 GO annotation significantly related to target genes
Term Count P-value Genes
lymphangiogenesis 3 0.0043 PPP3CB, FLT4, BMPR2
Transmembrane receptor protein serine/threonine kinase activity 3 0.0069 LTBP4, LTBP1, BMPR2
Feeding behavior 7 0.0078 MCHR1, PPYR1, OPRD1, GLS, ASIP, PHF21A, IAPP
RNA polymerase II carboxy-terminal domain kinase activity 3 0.0043 GTF2H1, CDK9, GTF2H4
copper chaperone activity 2 0.0077 PARK7, CCS
Fatty acid elongation, saturated fatty acid 2 0.0077 ELOVL4, ELOVL6
Fatty acid elongation 3 0.0029 ELOVL2, ELOVL4, ELOVL6
intracellular receptor signaling pathway 13 0.0090 ZNF536, CCNE1, DCBLD2, PGR, MAP3K7, GPR56, ITCH, NOD1, KANK2, THRA, PARK7, RXRB, DDX5
negative regulation of protein complex assembly 7 0.0071 THRA, HEY2, SPTAN1, MAP3K7, OPRD1, MAPRE1, PARK7
Positive regulation of stress-activated MAPK cascade 8 0.0064 IL1A, FLT4, MAP3K10, TNFSF11, NOD1, HIPK2, MAP3K7, STK25
lymph vessel morphogenesis 3 0.0059 PPP3CB, FLT4, BMPR2
intrinsic apoptotic signaling pathway in response to hydrogen peroxide 2 0.0077 PARK7, STK25
Paracrine signaling 2 0.0077 TNFSF11, PGR
sertoli cell development 3 0.0059 DMRT1, ARID4B, SDC1
Positive regulation of stress-activated protein kinase signaling cascade 8 0.0067 IL1A, FLT4, MAP3K10, TNFSF11, NOD1, HIPK2, MAP3K7, STK25
serine/threonine protein kinase complex 5 0.0072 GTF2H1, CDK9, MAP3K7, RB1CC1, GTF2H4
Protein kinase complex 7 0.0026 GTF2H1, CDK9, CCNE1, PRKAB2, GTF2H4, MAP3K7,
RB1CC1 Abbreviation: gO, gene ontology.
Table S3 The KEGG pathway significantly related to target genes
Term Count P-value Genes
arginine biosynthesis 3 0.0100 ARG2, GOT2, GLS
Fatty acid elongation 3 0.0171 ELOVL2, ELOVL4, ELOVL6
nucleotide excision repair 4 0.0178 GTF2H1, LIG1, RAD23B, GTF2H4
Osteoclast differentiation 7 0.0195 IL1A, CAMK4, TNFSF11, NCF4, PPP3CB, MAP3K7, SOCS3
rheumatoid arthritis 5 0.0379 ITGAL, TNFSF11, IL8, MMP3, IL1A
Phenylalanine metabolism 2 0.0128 GLYAT, GOT2
selenocompound metabolism 2 0.0128 SEPHS1, TXNRD1
Fat digestion and absorption 3 0.0152 PNLIPRP1, ABCA1, GOT2
Ubiquitin-mediated proteolysis 6 0.0235 PIAS3, CBL, TRIM32, ITCH, TRIM37, SOCS3
Biosynthesis of amino acids 4 0.0276 ARG2, GOT2, RPE, MAT2B
Transcriptional misregulation in cancer 7 0.0351 CDK9, MMP3, IL8, PAX5, RXRB, CCNA1, DDX5
rna degradation 4 0.0354 DDX6, CNOT6, 10200, CNOT4
Biosynthesis of unsaturated fatty acids 2 0.0459 ELOVL2, ELOVL6
Non-alcoholic fatty liver disease (NAFLD) 6 0.0500 IL1A, PRKAB2, IL8, ITCH, NDUFA4L2, SOCS3 Abbreviation: Kegg, Kyoto encyclopedia of genes and genomes.
OncoTargets and Therapy downloaded from https://www.dovepress.com/ by 118.70.13.36 on 25-Aug-2020