EXPECTATION VIOLATIONS AND EMOTIONAL LEARNING
Cordelia Fine
Department of Psychology,
University College London.
Thesis submitted for the degree of Ph D. in Psychology,
University of London.
ProQuest Number: U642080
All rights reserved
INFORMATION TO ALL USERS
The quality of this reproduction is dependent upon the quality of the copy submitted. In the unlikely event that the author did not send a complete manuscript and there are missing pages, these will be noted. Also, if material had to be removed,
a note will indicate the deletion.
uest.
ProQuest U642080
Published by ProQuest LLC(2015). Copyright of the Dissertation is held by the Author. All rights reserved.
This work is protected against unauthorized copying under Title 17, United States Code. Microform Edition © ProQuest LLC.
ProQuest LLC
789 East Eisenhower Parkway P.O. Box 1346
Acknowledgements
Foremost, I’d like to thank James Blair for his indispensable guidance and
encouragement. His patience and sense of humour have helped make my PhD an
enjoyable experience. I am also indebted to Uta Frith for her constructive criticism,
encouragement and support. Lisa Cipolotti, Caroline Edmonds, and John Morton
also deserve thanks for giving their time to discuss many ideas in this thesis.
I am grateful to Peter Dayan for his supervision of my project during the year I spent
in the Computer Science department. His expert advice, interest and patience were
greatly appreciated. I am also extremely grateful to Essi Colledge, John Lumsden
and Derek Mitchell for their help with the patient research.
Thanks also to all who have provided computer support and help and advice, in
particular, Giulia Abbonizio, Sylvie Berthoz, Janice Brown, Essi Colledge, Caroline
Edmonds, Sarah Paterson, Daniel Reisel, Caleb Smith, and especially Charmaine
Bill. John Draper must also be thanked for his administrative omniscience and
unfailing good humour.
I thank all my family for their great encouragement and support. And finally, thanks
to Russell.
This PhD was supported by a Medical Research Council studentship and a
Abstract
Chapter 1 discusses the representation of reinforcement expectations. Chapter 2
tested the prediction that expectation violations will trigger arousal and rapid
behavioural change. It was found that unexpected valence changes, but not
magnitude changes, triggered arousal increases and rapid behavioural change. It was
therefore suggested that an instrumental learning system represents both magnitude
and valence information, but that a separable instrumental re-leaming system only
represents valence. These hypotheses were implemented in a computational model
in Chapter 3. This model successfully simulated human behavioural data from three
experiments in Chapter 2. The model also predicted that the instrumental learning
and instrumental re-leaming systems could be independently damaged. This was
investigated in Chapters 4 and 5 with case studies of an amygdala patient and two
orbitofrontal patients. The amygdala patient was severely impaired in instrumental
learning. In contrast, the orbitofrontal patients were only impaired in instrumental
re-leaming. This dissociation supported the hypothesis that instrumental leaming
and re-leaming are mediated by separable systems. Chapter 6 found support for the
hypotheses that developmental psychopathy is associated with amygdala dysfunction
and orbitofrontal cortex function by assessing instmmental leaming and re-leaming
in a population of psychopathic individuals. Chapters 7 and 8 investigated further
the effects of early amygdala damage on emotional and social cognition. A patient
with early left amygdala damage was shown to be impaired in the recognition of fear
and sadness, and showed a lack of empathy. These findings were predicted by the
early amygdala dysfunction hypothesis of developmental psychopathy. Chapter 8
demonstrated a severe theory of mind impairment in the amygdala patient, in the
absence of any executive dysfunction. This finding suggests that theory of mind is
not simply a function of more general executive functions, and supports the
hypothesis that the amygdala plays a role in the development of the circuitry
mediating theory of mind. In the last chapter, future research directions are
TABLE OF CONTENTS
Chapter 1: Response outcome expectations: representation and violation...15
1.1: Introduction... 15
1.2: Reinforcement expectations and expectation violations...15
1.3: Inferring expectations from autonomic arousal... 18
1.4: When a discrepancy is not a violation... 21
1.5: The somatic marker hypothesis... 23
1.6: Data in support of the somatic marker hypothesis... 24
1.7: Alternative accounts of the Four Pack Gambling task results... 26
1.8: Summary and experimental aims of Chapter 2 ...27
Chapter 2: Autonomic arousal and behavioural change following expectation violations...28
2.1: Introduction of aims and predictions... 28
2.2: The use of SCR as an index of autonomic nervous system arousal...28
2.3: Experiment 1 ...29
2.4: M eth o d ...30
2.4.1: Subjects...30
2.4.2: A pparatus...30
2.4.3: Procedure...30
2.4.4: Data T reatm ent...32
2.5: Results & D iscussion... 33
2.5.1: Data A nalyses...33
2.5.2: Behavioural D a ta ... 33
2.5.3: SCRs following magnitude changes...35
2.5.4: Token choice behaviour following magnitude ch an g es...36
2.6: Experiment 2 ...37
2.7: M eth o d ... 38
2.7.1: Subjects...38
2.7.2: Procedure...38
2.8: Results & D iscussion... 39
2.8.1: Behavioural D a ta ... 39
2.8.2: SCRs following valence changes and magnitude changes... 40
2.10: M eth o d ... 44
2.10.1: Subjects... 44
2.10.2: Procedure... 44
2.10.3: Data T reatm ent... 44
2.11: Results & D iscussion... 45
2.11.1 Behavioural D a ta ... 45
2.11.2: SCRs following valence changes...46
2.11.3: Token choice behaviour following valence violations...48
2.12: Experim ent 4 ... 49
2.13: M eth o d ... 50
2.13.1: D esign...50
2.13.1: Subjects...50
2.13.2: A pparatus... 50
2.13.3: Procedure... 50
2.13: Results & D iscussion... 53
2.13.1: Data analyses...53
2.13.2: SCRs following Response Change and Valence Change stim uli... 53
2.13.3: Behavioural change following Response Change stim u li... 55
2.14: General D iscussion...55
2.14.1: Summary of fin d ing s...55
2.14.2: Implications for response outcome expectation violation detection...56
2.14.3: Implications for the processing aim of the expectation violation detection m echanism ... 57
2.14.4: Multiple representations of reinforcement?... 58
2.14.5: Expectation violation detection and instrumental re-leam ing...59
2.14.6: Implications for models of emotional leam ing... 60
2.14.7: Sum m ary... 60
Chapter 3: The Valence Change Reset model: A computational model of instmmental leaming and re-leam ing...62
3.1: Introduction...62
3.2: Computational models of emotional leam in g... 62
3.3: Implementation of hypotheses in the connectionist m o d el... 63
3.3.1: Overview of m o d el... 63
3.3.2: The Instmmental Leaming system :...65
3.2.2.1: Decision m le ...65
3.3.2.2: Reinforcement function:... 66
3.3.2.3: Leaming m le ...67
3.3.3: Instmmental Re-leaming system ... 67
3.4: M e th o d ...68
3.4.1: Procedure and model parameter values... 68
3.5: Results and D iscussion... 69
3.5.1: Results of simulations of Experiment 1... 69
3.5.2: Results of simulations of Experiment 2 ... 71
3.5.3: Results of simulations of Experiment 3 ... 73
3.6: D iscussion...75
3.7: Sum m ary... 77
Chapter 4: Investigating the role of the human amygdala in instrumental leaming: A case study... 78
4.1: Introduction...78
4.2: The basolateral amygdala and response outcome expectation representation ....78
4.2.1: Animal lesion and electrophysiological evidence...78
4.2.2: Evidence from humans with amygdala dam age... 80
4.2.3: Evidence from functional imaging studies in hum ans... 80
4.3: Aims of investigation... 81
4.4: Case report... 81
4.4.1 : Case D escription...81
4.4.2: Lesion Localization... 83
4.4.3: Neuropsychological assessm ent... 84
4.5: Experiment 1 - The Four-Token Snake task ... 85
4.6. M ethod...86
4.6.1: Control subjects...86
4.6.2: Procedure...86
4.6.3: Data treatm ent... 87
4.7: Results and D iscussion... 87
4.8: Experiment 2 - The Ask for Money ta sk ...88
4.9: M eth o d ...88
4.9.1: Control S u b jects... 88
4.9.2: Procedure...89
4.9.3: Data analysis... 91
4.10: Results and D iscussion... 91
4.11: Experiment 3 - performance of “intact” and “impaired” Valence Change Reset m o d el... 92
4.12: Method & Procedure... 92
4.12.1: “Intact” Valence Change Reset m o d e l... 92
4.12.2: “Impaired” Valence Change Reset m odel...92
4.13: Results and Discussion... 93
4.13.1: Performance of the “intact” Valence Change Reset model compared with co n tro ls...93
4.13.2: Performance of the “Impaired” Valence Change Reset model compared with B M ...93
4.14: General D iscussion...94
4.14.1: Implications for the role of amygdala in instrumental le a m in g ... 94
4.14.2: Alternative accounts of findings... 94
4.15: Sum m ary... 95
Chapter 5: Investigating the role of the human orbitofrontal cortex in instrumental leam ing and re-leaming: Two case studies...96
5.1: Introduction...96
5.2: The orbitofrontal cortex and instmmental re-leam ing...96
5.3: The orbitofrontal cortex and instmmental leam ing... 97
5.4: Summary and aim s...99
5.6: Case rep o rts...100
5.6.1: Case D escriptions... 100
5.6.2: Lesion Localizations... 101
5.6.3: Neuropsychological assessm ent... 101
5.7: Experim ent 1 - Intra-dimensional/Extra-dimensional Shift ta sk ... 102
5.8: M e th o d ...103
5.8.1: Control subjects...103
5.9: Procedure... 103
5.10: Results & D iscussion... 103
5.11: Experiment 2 - Four token Snake T a s k ...104
5.12: M e th o d ... 104
5.12.1: Control subjects...104
5.13: Procedure... 105
5.13.1: Data A nalysis...105
5.14: Results & D iscussion... 105
5.15: Experiment 3 - performance of “intact” and “impaired” netw ork...108
5.16: M ethod & Procedure... 108
5.18: General D iscussion... 109
5.18.1: The role of the orbitofrontal cortex in instrumental re-leam ing... 110
5.18.2: Implications for the role of the orbitofrontal cortex in instrumental leaming 110 5.18.3: Implications for the Valence Change Reset m odel...I l l 5.19: S u m m ary ...112
Chapter 6: Developmental psychopathy and instmmental leam ing and re-leaming 113 6.1: Introduction... 113
6.2: Developmental psychopathy...113
6.3: Evidence for amygdala dysfunction in developmental psychopathy...114
6.4: Developmental psychopathy and instmmental le a m in g ...115
6.5: The BIS dysfunction and response set modulation accounts of instmmental leam ing d eficits... 116
6.6: Evidence for orbitofrontal cortex dysfunction in developmental psychopathy 118 6.7: Summary and Experimental A im s ... 120
6.8: Experimental Investigation... 121
6.8.1: Subjects... 121
6.8.2: Procedure... 121
6.8.3: Data analysis...121
6.9: R esu lts... 122
6.10: D iscu ssion ... 123
6.10.1: Implications for neurological dysfunction in developmental psychopathy ...124
6.10.2: BIS deficit and response set modulation deficit accounts of findings 126 6.11: S u m m ary ... 127
Chapter 7: Investigating the behavioural similarities between the effects of early amygdala damage and developmental psychopathy... 129
7.1: Introduction... 129
7.2: Em otion expression processing in psychopathic individuals and the possible role of the am ygdala... 129
7.2.1: Neuropsychological and functional imaging evidence for the role o f the amygdala in the processing of fear and sadness... 130
7.3: Summary and aim of Experiments 1-3... 132
7.5: C om m ent... 133
7.6: Experiment 2 - The Morph emotion recognition ta s k ... 134
7.7: C om m ent... 134
7.8: Experiment 3 - Threshold ta s k ... 135
7.9: C om m ent... 136
7.10 Discussion of Experiments 1-3... 136
7.11: Experiment 4 - Hare Psychopathy Checklist-Revised assessment... 137
7.12: General Discussion...138
7.12.1: Implications for the role of the amygdala in developmental psychopathy ... 138
7.12.2: Implications for the role of the amygdala in emotion expression processing ... 140
7.13: Sum m ary... 141
Chapter 8: Dissociation between Theory of M ind and executive functions: A case stu d y ...142
8.1: Introduction...142
8.2: Theory of M in d ... 142
8.3: The anatomical basis of theory of m in d ... 143
8.4: Theory of M ind and executive functioning...144
8.5: Case R epo rt... 147
8.6: Experimental Investigation...147
8.7: Control subjects... 147
8.8: Theory of Mind A ssessm ent:... 147
8.8.1: Tasks 1-5: False Belief T ests...148
8.8.2: Tasks 6-7: Joke Comprehension tests...148
8.8.3: Tasks 8-9: Advanced Theory of M ind T est...149
8.8.4: Task 10: Non-literal speech comprehension...150
8.9: C om m ent... 151
8.10: Executive Functions A ssessm ent...151
8.10.1: Tasks 11-16: Inhibition T e sts... 152
8.10.2: Tasks 17-21: Intentionality T e s ts ... 153
8.10.3: Tasks 22-26: Executive M em ory... 153
8.12: D iscussion...154
8.12.1: Implications for the anatomy of Theory of M in d ...154
8.12.2: Implications for the relationship between Theory of M ind and executive functioning... 155
8.13: The amygdala, Theory of Mind, and developmental psychopathy...158
8.14: Sum m ary... 158
Chapter 9: Summary, Conclusions, and Future D irections... 160
9.1: Introduction...160
9.2: Summary and Conclusions...160
9.3: Future directions... 163
9.3.1: Further tests of the Valence Change Reset m odel... 163
9.3.2: The amygdala, developmental psychopathy, and instrumental learning.... 164
9.3.3: The role of the amygdala in social cognition...165
9.3.4: The role of the amygdala in emotion expression processing... 165
9.4 Sum m ary... 166
Reference L ist... 167
LIST OF TABLES
Table 1.1: Expected and unexpected events: from M acDowell & M andler (1989)...20
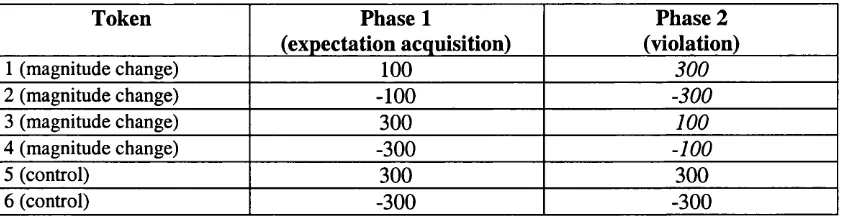
Table 2.1: Points values of tokens in phase 1 and phase 2 of Experiment 1. Italic text indicates a magnitude change in phase 2 ...32
Table 2.2: Points values of tokens in phase 1 and phase 2 of Experiment 2. Bold italic text indicates a valence change in phase 2. Bold text indicates a magnitude change in phase 2 ...38
Table 2.3: Mean (standard deviation) Valence Change, Magnitude Change and Control difference scores, Experiment 2 ...41
Table 2.4: Points values of tokens in phase 1 and phase 2 of Experiment 3. Bold text indicates a small valence change in phase 2. Bold italic text indicates a large valence change in phase 2 ...44
Table 2.5: Mean (standard deviation) Valence Change, Control, Small Valence Change and Large Valence Change difference scores. Experiment 3... 47
Table 2.6: Default payments, and amounts of money given or taken away by relatives when asked for money, in phases 1 and 2 of Experiment 4. RC+VC = Response Change & Valence Change, RC = Response Change, VC = Valence Change 52
Table 4.1: B M ’s neuropsychological perform ance... 84
Table 4.2: Token values in phase 1 (expectation acquisition), phase 2 (reversal 1), and phase 3 (reversal 2) of Four-Token Snake task. Bold indicates a valence change.
...87
Table 4.3: Percentage correct responses by BM and controls in phase 1 of the Four- Token Snake task... 88
Table 4.4: Pounds given or taken away by relatives in phase 1 (expectation
acquisition) and phase 2 (reversal), when either hinted to or begged for money. Bold text indicates the optimal response for that relative... 90
Table 4.5: Number of correct responses by BM and controls in Ask for Money task. ... 91
Table 4.6: Performance of the “intact” model, controls, “impaired” model, and BM in phase 1 (expectation acquisition), phase 2 (reversal 1) and phase 3 (reversal 2) of the Four-Token Snake task...93
Table 5.1: C M ’s and D J’s performance on executive function tasks... 101
Table 5.2: Performance (errors) of CM, DJ, and control subjects on Intra-
dimensional and Extra-dimensional shifts, and reversal trials... 104
in the 18th percentile. D J’s age was 53 years and his estimated IQ was in the 82nd percentile...105
Table 5.4: Mean, standard deviation, and range of percent correct token choices in the three phases of the Four Token Snake task... 106
Table 5.5: Performance of CM, DJ and controls on token combinations involving no valence changes and token combinations involving one or two valence changes, in phases 2 and 3 of the Four Token Snake task...108
Table 5.6: Performance of CM, DJ, and the “impaired” model in phases 1, 2 and 3 of the Four-Token Snake task...109
Table 6.1: H are’s Psychopathy Checklist-Revised (Hare, 1991)... 114
Table 6.2: Mean, standard deviation, and range of age, PCL-R Total score and Ravens matrices score for psychopathic and control groups...121
Table 6.3: Mean, standard deviation, and range of percent correct token choices for psychopathic individuals and controls in phases 1, 2, and 3 of the Four Token Snake task... 123
Table 7.1: Statistically significant impairments on facial and auditory emotion processing tasks in 13 bilateral amygdala patients... 131
Table 7.2: Performance of BM and control subjects on three emotion expression recognition tasks... 135
Table 8.1: Performance of BM and control subjects on Theory of M ind (TOM) tasks ... 149
LIST OF FIGURES
Figure 1.1: Possible representation of M andler’s discrepancy/arousal model (e.g., Mandler, 1984)...16
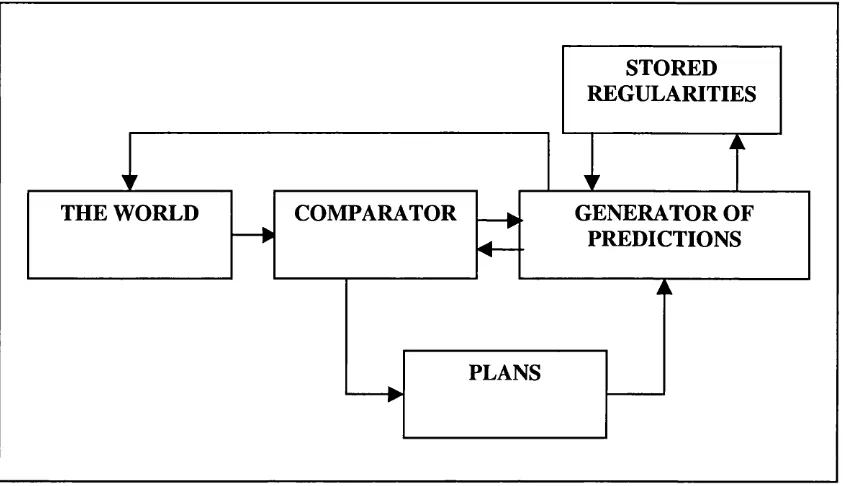
Figure 1.2: The comparator predicts the anim als’ expected state in the next instant of time, and compares this prediction to the actual state of the world. From Gray, 1982: p263...17
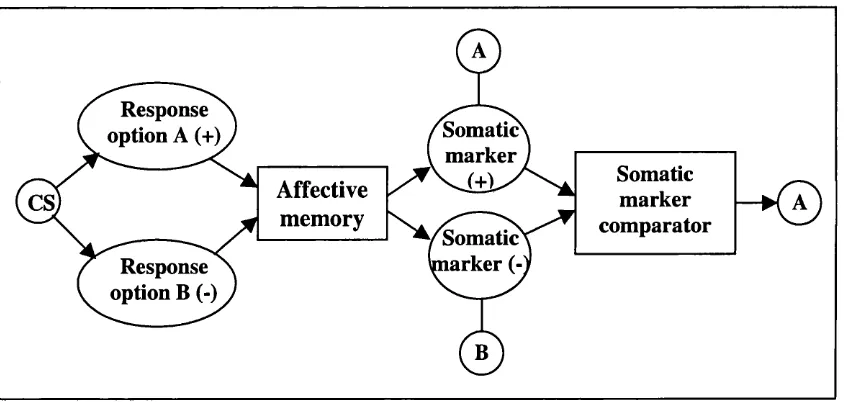
Figure 1.3: Possible representation of the somatic marker hypothesis (e.g., Damasio, 1994; Bechara et al., 2000). CS = conditioned stimulus... 24
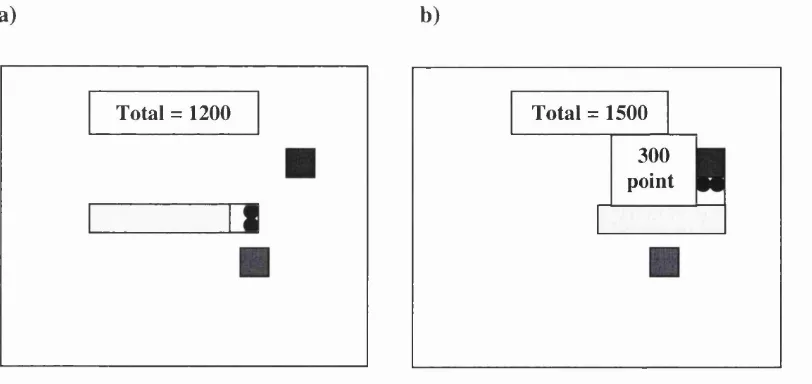
Figure 2.1: Computer screen display (a) before subject token choice and (b) after reinforcement...31
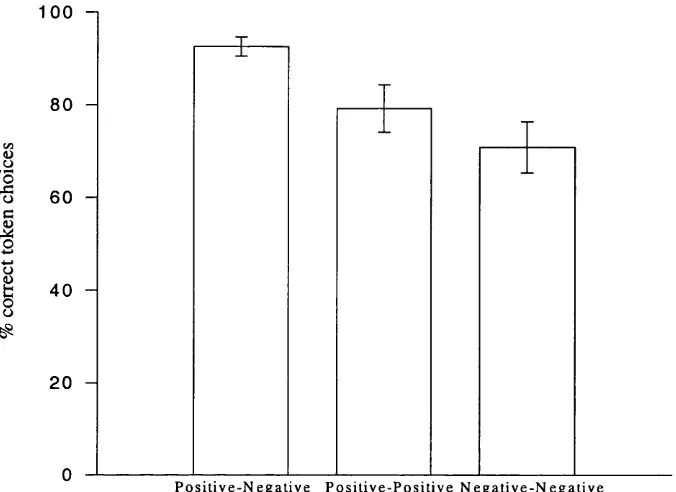
Figure 2.2: Token choice performance (percentage correct) for token combinations consisting of: a positive and a negative token; two positive tokens of different values; two negative tokens of different values... 34
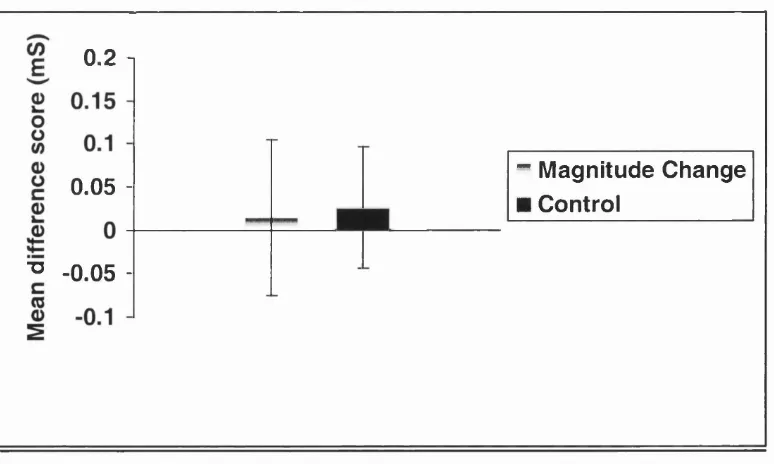
Figure 2.3: Mean Magnitude Change and Control difference scores. Experim ent 1. 35
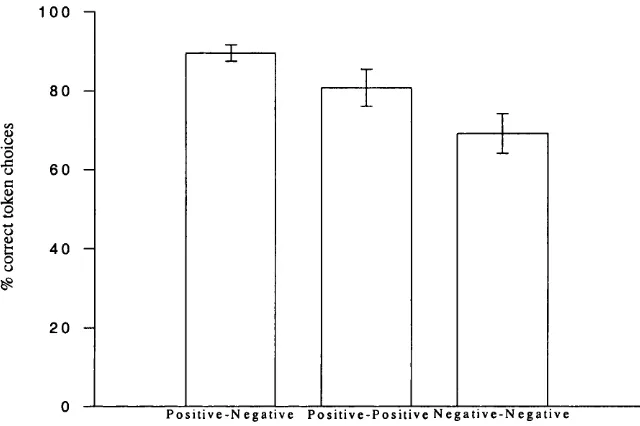
Figure 2.4: Token choice performance (percentage correct) for token combinations consisting of: a positive and a negative token; two positive tokens of different values; two negative tokens of different values... 40
Figure 2.5: Valence Change, Magnitude Change and Control difference scores. Experiment 2... 41
Figure 2.6: Token choice performance (percentage correct) for token combinations consisting of: a positive and a negative token; two positive tokens of different values; two negative tokens of different values... 46
Figure 2.7: Valence Change and Control difference scores. Experim ent 3... 47
Figure 2.8: Schematic diagram of computer screen layout for Experiment 4 ... 52
Figure 2.9: Response Change & Valence Change (RC & VC), Response Change (RC), Valence Change (VC), and Control difference scores...54
Figure 2.10: Schematic diagram of the Instrumental Leaming system, the
Instrumental Re-leaming system, and the interaction between the two. Dotted line indicates that only valence information is represented. “Reset” connection between the two systems indicates that the Instrumental Re-leaming system is involved in changing inaccurate response outcome expectations in the Instmmental Leaming system, following valence violations. The Motivational Significance system is also shown. It is not clear how this system receives feedback on response outcomes. CS = conditioned stimulus, CR = conditioned response, ANS = autonomic nervous system... 61
selection of Token y. Dotted arrow means that only valence information is
represented. See text for further details...64
Figure 3.2: Schematic diagram of Instrumental Leaming system... 65
Figure 3.3: Transformed sigmoid reinforcement function... 66
Figure 3.4: Performance of model and humans in phase 1 of Experiment 1...70
Figure 3.5: Model and human performance in phase 1, Experiment 2... 72
Figure 3.6: Performance of model and humans in phase 1, Experim ent 3 ...74
Figure 4.1: M RI scan showing abnormal signal return on T2 and possible low intensity lesion in T1 in the lateral part of the basal nuclei of the left amygdala 83 Figure 4,2: Schematic diagram of computer screen layout for Ask for Money experiment... 90
Figure 5.1: Performance of controls, CM and DJ in phase 1 (expectation acquisition), phase 2 (reversal 1) and phase 3 (reversal 2) of the Four-Token Snake task 107 Figure 6.1: Performance of psychopathic individuals and controls in phase 1 (expectation acquisition), phase 2 (first reversal) and phase 3 (second reversal) of the Four-Token S n ^ e task... 122
Chapter 1
Response outcome expectations: representation and violation
1.1: Introduction
Few would disagree with the notion that much of our behaviour is guided by
expectations of the positive or negative consequences of our actions (e.g., Tolman,
1932; Bolles, 1972; Balleine & Dickinson, 1998). This chapter is concerned with the
question of how these expectations of future reward and punishment are represented
cognitively.
1.2: Reinforcement expectations and expectation violations
The representation of the expected relationship between response and reinforcement
is implicit or explicit in most influential models of emotional processing, for
example, models of emotional experience (e.g., Mandler, 1984; Oatley & Johnson-
Laird, 1987), anxiety (e.g.. Gray, 1982), stimulus-reinforcement association re-
leaming (e.g., Grossberg, 1982; Rolls, 1990), fmstration (Amsel, 1992), latent
inhibition (Schmajuk, Lam, & Gray, 1996), and consciousness (Gray, 1995). These
models also include mechanisms that detect violations of expectation. Moreover, the
detection of these violations have important consequences, physically and/or
psychologically. For example, in his model of the constm ction of emotional
experience, M andler proposes that discrepancies of perception, action, or thought are
detected by a “difference detector” (Mandler, 1991) that triggers autonomic arousal
(e.g., Mandler, 1964; Mandler, 1984; see figure 1.1). This arousal determines the
intensity of the resulting emotional experience. In addition, the discrepancy results
us
cs-us
ASSOCIATION
MEMORY
EXPECTED
REINFORCEMENT
.
VALUE
.
DIFFERENCE
DETECTOR
MISMATCH
AUTONOMIC
NERVOUS
SYSTEM
AROUSAL
Figure 1.1: Possible representation of Mandler’s discrepancy/arousal model
(e.g., Mandler, 1984).
G ray’s model of the behavioural inhibition system describes an information
processing system that compares the current state of the world to predictions of the
expected state of the world (e.g., Gray, 1982; Gray, 1987; Gray, 1995; see figure
1.2). For example, if reward is expected but does not occur, the behavioural
inhibition system is activated and the animal will become aroused, increase attention,
and inhibit current behaviour. It is proposed that activation of the behavioural
STORED REGULARITIES
THE WORLD COMPARATOR — ^ GENERATOR OF
— >
4— PREDICTIONS
PLANS
Figure 1.2: The comparator predicts the animals’ expected state in the next
instant of time, and compares this prediction to the actual state of the world.
From Gray, 1982: p263.
Amsel’s frustration theory proposes that a short-term increment in arousal follows
the omission of an expected reward, or reward that is less than expected (Amsel,
1992). In Grossberg’s model, expectation violations trigger the orienting response,
which allows rapid re-leaming of stimulus-reinforcement associations to occur
(Grossberg, 1982).
Responses that result in reinforcement events that violate expectations are therefore
of cmcial importance in these important models of emotional processing. In each
model, an expectation of future reward or punishment must be compared with actual
reinforcement. However, depending on how reinforcement expectations are
represented, it is possible that not all discrepancies of reinforcement will violate
expectations. If a particular variable - for example, valence - is represented in a
reinforcement expectation, then a change in the valence of reinforcement will violate
expectations. In contrast, if a particular variable is not represented in a reinforcement
expectation - for example, magnitude - then a change in the magnitude of
reinforcement will not violate expectations. In some models, reinforcement
expectations have been explicitly defined computationally. In Grossberg’s (1982)
model, expected and actual events are represented as vectors of activity. An
event is sufficiently large that the combination of the two vectors is suppressed as
noise. A “vigilance parameter” determines the degree of mismatch that will be
tolerated. However, Grossberg does not state what parameters of the stimulus are
represented in the vectors. In Schmajuk et al.’s (1996) model of latent inhibition,
differences in magnitude between expected and actual reinforcement are detected.
M andler (1984) and Amsel (1992) also assume that discrepancies in the magnitude
of expected and actual reinforcement are detected and responded to behaviourally
and psychophysiologically. However, despite the importance in these models of
what constitutes an expectation violation, the question of what information is
represented in expectations of future reinforcement has not been well researched.
The next section introduces a possible methodology for exploring this question.
1.3: Inferring expectations from autonomic arousal
A methodology for investigating the representation of expectations is suggested by
the research o f Sokolov (1960) on the orienting response. The orienting response is a
non-specific response that includes increases in autonomic arousal. Sokolov was
interested in orienting responses to novel events. He argued that novelty is the
noncoincidence between external stimuli and a neuronal (or internal) model of
predicted stimuli. He suggested that:
" . . . the function o f this neuronal model ...is to filte r the signals in the
nervous system. This means that a selective prevention o f transmission o f impulses from certain kinds o f stimulation must take place. We can measure the property o f this biological filte r by changing stimuli and by
measuring reaction. " Sokolov, 1960: p208.
In other words, by manipulating a stimulus parameter and measuring consequent
arousal, it is possible to infer what stimulus parameters are represented in the internal
predictive model. For example, Sokolov (1960) habituated subjects to a sound of a
particular frequency. He then measured a number of indices of the orienting
response, including skin conductance response and respiration rate, following sounds
of different frequencies. The size of the orienting response was proportional to the
magnitude of the difference in frequency between the novel stimulus and the
habituated stimulus. From this it could be inferred that stimulus frequency was
A number of other studies have explored autonomic arousal responses following
unexpected and/or novel stimuli. Lewis & Goldberg (1969) found that violations of
colour, form, content and curvature of a stimulus resulted in an arousal response.
Wilton & Boersma (1974) found that violations of principles of conservation
produced arousal responses in children who had acquired the principle of
conservation, but not in children who had not. In a study by M andler (1964),
subjects learnt a sentence or a sequence of digits. The sequences were either learnt
to mastery, or were over-learned. Subjects were then asked to anticipate each word
or digit as the experimenter said the sequence they had learnt. On critical trials, an
unexpected word or digit was said after the subject had anticipated the correct one.
There was a skin conductance increase following the discrepant events, and this was
greater when the sequences had been over-learned than when they had only been
leam t to mastery. This suggests that the greater the expectation for an event, the
greater the arousal response when that expectation is violated. Similarly, Nakamura
(cited in MacDowell & Mandler, 1989) produced unexpected endings for stories and
measured skin conductance in subjects listening to the stories. Unexpected endings
produced skin conductance responses, and these were greater following unexpected
endings to well-known proverbs than to novel stories.
Thus these data support the position that violations of expectation produce arousal
and that the greater the violation, the greater the arousal that follows. In a similar
way, in can be predicted that violations of reinforcement expectations will also
trigger autonomic arousal responses. Indeed, this prediction is made by the
discrepancy/arousal hypothesis (e.g., Mandler, 1984), the behavioural inhibition
system model (e.g.. Gray, 1982), frustration theory (Amsel, 1992) and Grossberg’s
computational model (Grossberg, 1982). Following the approach of Sokolov (1960),
arousal responses following reinforcement can be used to infer what information is
and is not represented in reinforcement expectations that input into a violation
detection mechanism. If a particular variable is represented in a reinforcement
expectation, then discrepancy in that variable will produce arousal. In contrast, if a
particular variable is not represented in a reinforcement expectation, then
kinds of violations produce arousal, we can infer what information is represented in
reinforcement expectations.
So far, only one study conducted by MacDowell & M andler (1989) has tested the
prediction that discrepant reinforcements produce arousal. In this experiment,
subjects played an interactive adventure computer game in which both good and bad
events could occur. The dependent variables assessed autonomic arousal responses,
indexed by heart rate response, heart rate response acceleration, skin conductance
response, and skin conductance response acceleration. There were three phases to
the experiment. Session 1 was a one hour expectation acquisition session. In session
2, autonomic arousal responses to the expected events were recorded. In the third
session, unexpected events occurred randomly, and autonomic arousal responses to
the events were recorded (see table 1.1). Two unexpected events comprised
outcomes better than the typical event, and two involved outcomes worse than the
typical event.
EVENT E X PE C T E D U N EX PEC TED
POSITIVE
Gold 70 pieces 1000 pieces
Death Kill weak monster Powerful monster drops dead
NEGATIVE
Gold 30 pieces 3 pieces
Death Killed by powerful monster Killed by weak monster
Table 1.1: Expected and unexpected events: from MacDowell & Mandler
(1989).
It was found that, as predicted, discrepant events were associated with a greater
increase in heart rate than expected events. However, this association was not
significant for the other three measures of autonomic arousal. A further difficulty
with interpreting the results was that the unexpected events differed to the expected
events in ways other than whether they violated expectations. It is therefore possible
that the unexpected events were intrinsically more arousing than the expected events.
was of greater magnitude than the expected event (70 gold pieces). Thus the greater
heart rate increase seen following the unexpected events cannot be unambiguously
attributed to violations of expectation. An additional drawback is that MacDowell &
M andler (1989) did not establish that subjects had actually developed expectations
during the first two sessions of the experiment.
The results of this study are therefore inconclusive. However, the use of a computer
game provides a useful approach to investigating the effects of discrepant
reinforcement on autonomic arousal. This approach was used in the experiments
described in Chapter 2. The first aim of these experiments was to explore what
discrepancies of reinforcement produce arousal, whilst controlling for absolute levels
of reinforcement.
1.4: When a discrepancy is not a violation
The previous section discussed the possibility that not all discrepancies will result in
arousal. If so, then an interesting question is why this might be the case. As Sokolov
(1960) suggested, the answer may lie in the processing aim of the system detecting
violations of expectations. In M andler’s model, violations result in interruption of
ongoing behaviour, and the arousal readies the individual for a potentially important
change in the environment (e.g., Mandler, 1964; Mandler, 1984; Mandler, 1991). In
G ray’s model, violations of expectation, together with punishment and non-reward,
activate the behavioural inhibition system which prevents the individual from
continuing with plans that are potentially maladaptive (e.g.. Gray, 1982). Grossberg
(e.g., Grossberg, 2000) and Rolls (e.g.. Rolls, 1990; 1996) both stress the importance
of detecting expectation violations in order to rapidly re-leam reinforcement
contingencies, preventing perseverative responding. In other words, the models
suggest that an important consequence of detecting an expectation violation is a rapid
behavioural change or behavioural interruption.
This suggests a reason why not all discrepancies may be detected as violations;
behavioural change may not always be appropriate, as Grossberg (1982) has argued.
“ maintain themselves in a stable fashion against the erosive effects o f
behaviourally irrelevant environmental fluctuations yet . . . nonetheless
adapt rapidly in response to environmental fluctuations that are crucial
to survival. ” Grossberg, 1982: p536.
Grossberg terms this the stability-plasticity dilemma. The dilemma arises from the
system not “knowing” a priori what are and are not important violations o f what is
expected. The effects of reinforcement discrepancy on arousal and behaviour have
been investigated previously in two experimental paradigms: extinction and reversal
leaming. In extinction, termination of an expected reinforcement abolishes both
classical and instrumental responding to a conditioned stimulus (see LeDoux, 1998).
In reversal leaming, the reinforcement value of a stimulus is changed from positive
to negative or vice versa. Control subjects rapidly adapt their instmmental responses
in response to the changed reinforcement contingencies. For example, in the Intra-
dimensional/Extra-dimensional Shift task - a visual discrimination and attentional
set-shifting task - the mean number of errors on simple visual discrimination
reversals was between 1 and 2 (Rahman, Sahakian, Hodges, Rogers, & Robbins,
1999).
Thus, the termination of reinforcement or reversal of valence of reinforcement results
in rapid behavioural change. In contrast, the effects of magnitude changes on
instmmental responding are not clear. A small number of studies have examined
instmmental responses in rats following shifts in the magnitude o f reward associated
with a particular behavioural response (see Flaherty, 1982: p 422-423). However,
the findings are inconclusive since in these studies, following changes in
reinforcement magnitudes, the stimuli between which the animal had to choose were
of equal value. Thus these experiments did not have the potential to demonstrate
adaptive behavioural change following changes in reward magnitude. The second
aim then of the experiments in Chapter 2 was to measure behavioural change
following changes in the magnitude and valence of reinforcement, and to explore the
relationship between arousal following expectation violations and behavioural
change. If the models discussed here are correct in proposing that the function of
detecting expectation violations is rapid behavioural change, then there should be an
This section has so far omitted an influential neurocognitive model of the
representation of reinforcement expectations and how they control behaviour. This
is the somatic marker hypothesis (Damasio, Tranel, & Damasio, 1991; Damasio,
1994; Damasio, 1996; Bechara, Damasio, & Damasio, 2000). This model differs
importantly to those discussed above by claiming that the arousal responses that
precede behavioural decisions index expectations about the outcome of behaviour.
In contrast, in the models discussed previously, arousal responses index violations of
these expectations. The somatic marker hypothesis is the subject of the next section.
1.5: The somatic marker hypothesis
The somatic marker hypothesis proposes that bodily states, or “somatic markers”,
guide emotional decision-making:
“...when the somatosensory image which defines a certain emotional response is juxtaposed to the images which describe a related scenario o f future outcome, and which triggered the emotional response via the
ventromedial linkage, the somatosensory pattern marks the scenario as good or bad.
“When this process is overt, the somatic state operates as an alarm or incentive signal. The somatic state is alerting you to the goodness or
badness o f a certain option-outcome pair. ” Bechara et al., 2000: p297.
It can be seen from this description that the somatic marker hypothesis predicts the
occurrence of conditioned autonomic responses to conditioned stimuli. These
autonomic responses are labelled somatic markers. Furthermore, the model differs
importantly from the classical conditioning account. Its major claim is that the
function of these markers is to guide behaviour, by acting as an “alarm bell” or a
“beacon of incentive” (Damasio, 1994). That is, the arousal responses that precede a
behavioural choice are causal in determining behaviour (see figure 1.3). In contrast,
in the models discussed previously, while arousal responses may accompany the
presence of conditioned stimuli, they are not considered to play a causal role in
Response
option A (+) Somatic
marker
Somatic marker comparator
Affective
memory
CS,
Somatic^ marker (-Response
option B (-)
Figure 1.3: Possible representation of the somatic marker hypothesis (e.g.,
Damasio, 1994; Bechara et al., 2000). CS = conditioned stimulus.
1.6: Data in support of the somatic markj;r hypothesis
Findings from a gambling game, the Four Pack Gambling task, provide the main
support for the somatic marker hypothesis (Damasio et ah, 1991; Bechara, Damasio,
Damasio, & Anderson, 1994; Bechara, Damasio, Tranel, & Damasio, 1997; Bechara,
Damasio, Damasio, & Lee, 1999). This innovative task has provided one of the first
consistent demonstrations of a cognitive deficit in patients with ventromedial
prefrontal cortex damage. In addition, the task has provided an impetus for the
development of other important decision-making tasks (e.g., Rogers, Everitt,
Baldacchino, et al., 1999). In the Four Pack Gambling task, subjects are told to
select cards at will from any of four decks. Two of the decks yield high rewards and
high punishments (counterfeit money) that sum to a net loss (bad decks). The other
two decks yield low rewards and low punishments that sum to a net gain (good
decks). One good deck and one bad deck are associated with small but frequent
punishment, and the other two decks are associated with larger but less frequent
punishment. There are three dependent variables; one behavioural and two
psychophysiological. The behavioural variable is the number of choices of good and
bad decks. The two psychophysiological variables are skin conductance responses
(SCRs) preceding the decision of which deck to choose, and SCRs following
Neurologically intact control subjects and patients with ventromedial frontal lobe
(VMF) damage were given the task. VMF patients are characterised as showing
poor social and emotional decision-making, including an insensitivity to the social
repercussions of their behaviour (e.g., Eslinger & Damasio, 1985; Rolls, Homak,
Wade, & McGrath, 1994). This impairment cannot be explained in terms of defects
in pertinent knowledge (Saver & Damasio, 1991), intellectual ability as assessed by
IQ (e.g., Eslinger & Damasio, 1985; Rolls et al., 1994), or basic working memory
(Bechara, Damasio, Tranel, & Anderson, 1998). The gambling task was designed to
“simulate real-life decisions in terms o f uncertainty, reward, and punishm ent.”
(Bechara et al., 1999: p5473). It was therefore of interest to investigate whether the
VMF patient group would make poor decisions in the task, as they do in everyday
life.
As predicted, unlike controls, the VMF patients did not learn to avoid the bad packs.
In addition, their psychophysiological data differed to that of the controls. Both the
VMF patients and the controls generated SCRs following rewards and punishments
from their card selections. However, as the experiment progressed, controls began to
generate large SCRs as they reached for cards from the bad decks, as if in
anticipation of the punishment they might be about to receive. In contrast, the VMF
patients did not produce anticipatory SCRs. Moreover, they failed to leam to avoid
the high risk packs.
Bechara et al. (Bechara et al., 1994; 1997; 1999) interpreted the absence of
anticipatory SCRs in the VMF patients as an absence of negative somatic markers to
“warn” them away from the bad decks. They suggested that:
“the poor decision-making associated with VMF damage is related to an inability to integrate effectively all o f the somatic state information triggered by the amygdala as well as other somatic effectors such as the hypothalamus and brainstem nuclei. ... When subjects decide to select cards from a specific deck, the neural activity pertaining to this information is signaled to VM cortices, which in turn activate the
amygdala . . . This latter activity would reconstitute a somatic state that
integrates the numerous and conflicting instances o f reward and punishment encountered with individual card draws fro m that deck. ”
A recent functional imaging study has investigated this claim. The study revealed
activity in bilateral medial prefrontal areas both preceding and during SCRs in an
emotional decision-making task (Critchley, Elliott, Mathias, & Dolan, 2000). The
authors argue that this is consistent with a role for this region in generating and
representing somatic markers. However, while these findings support the role of the
medial prefrontal cortical areas in representing reinforcement and expectations of
future outcomes, which are themselves associated with SCRs, this does not imply
that these SCRs are causal in emotional decision-making.
1.7: Alternative accounts of the Four Pack Gambling task results
Indeed, in the same way it cannot be assumed that the larger anticipatory SCRs seen
in controls preceding choices from the bad decks in the Four Pack Gambling task
reflect the action of negative somatic markers. This is because the bad decks were
associated with higher levels of reward as well as punishment. Thus the larger
anticipatory SCRs for these decks may be explained by the higher absolute
reinforcement values associated with the bad decks compared with the good decks.
Damasio (1996) does consider a similar alternative account, but counters this with
the observation that subjects develop their anticipatory SCRs before they can
explicitly categorise the decks as good or bad. However, evidence of conditioning to
a stimulus does not necessarily imply that the subject is explicitly aware of the
stimulus-reinforcement contingencies (e.g., Edwards, 1990; Johnsrude, Owen, Zhao,
& White, 1999).
With regard to the data from the VMF patients, their reduced anticipatory SCRs may
be attributable to the passive nature of the decision-making stage of the experiment.
Damasio, Tranel, & Damasio (1990) found that patients with bilateral lesions in
orbital and lower mesial frontal lesions did not generate SCRs while passively
looking at slides of conditioned stimuli. Possible alternative accounts of the VMF
patients’ poor behavioural choices include an instrumental re-leaming deficit (Rolls,
2000) and an inability to resolve effectively between two competing response options
1.8: Summary and experimental aims of Chapter 2
Numerous important models of emotional processing include mechanisms that detect
violations of response outcome expectations (e.g., Gray, 1982; Mandler, 1984;
Schmajuk et al., 1996; Grossberg, 2000). Following Sokolov (1960), it is argued that
the representation of expectations can be investigated by presenting the subject with
outcomes that do not match their expectations. If mismatch on a particular stimulus
parameter produces an arousal response, this indicates that that parameter is
represented in the expectation. Conversely, the absence of an arousal response
suggests that the parameter is not represented. The first aim of the next chapter was
to explore the representation of response outcome expectations by measuring
autonomic arousal responses following reinforcement discrepancies. The importance
of the detection of response outcome expectations violations for rapid behavioural
change and interruption of behaviour is stressed by a number of models (e.g.,
Mandler, 1964; Gray, 1982; Rolls, 1990). The second aim of Chapter 2 was to
investigate whether rapid behavioural change is associated with arousal responses
Chapter 2
Autonomic arousal and behavioural change following expectation
violations
2.1: Introduction of aims and predictions
The experiments reported in this chapter were designed to achieve the aims
summarised in section 1.8 of the previous chapter. The first aim is to explore the
representation of reinforcement expectations by measuring arousal responses
following reinforcement expectation violations. In the models discussed in Chapter
1, it is either implicitly or explicitly proposed that both magnitude and valence
violations are detected. It is therefore predicted that both magnitude and valence
violations will trigger autonomic arousal. The second aim is to investigate whether
arousal responses following expectation violations are associated with rapid
behavioural change. This is because in many of the models discussed in Chapter 1,
the detection of expectation violations results in behavioural inhibition or
behavioural change (e.g., Gray, 1982; Grossberg, 1982; Mandler, 1984).
In the first three experiments, three variants of an instrumental learning and re-
leaming task were used. The task took the form of a computer game in which two
stimuli were presented simultaneously, and subjects won or lost points according to
the value of the stimulus they chose. In the first phase of the experiment
(expectation acquisition), subjects learnt how many points each o f the six different
stimuli were worth. The points value of tokens, positive or negative, is referred to
here as reinforcement. In the second phase (violation), the points value of some of
the stimuli were changed, i.e., reinforcement violated expectations. Skin
conductance responses (SCRs) following reinforcement and token choice behaviour
were the dependent variables.
2.2: The use of SCR as an index of autonomic nervous system arousal
The autonomic nervous system (ANS) has two subdivisions: the sympathetic branch
and the parasympathetic branch. The sympathetic branch serves what has come to be
known as the ‘emergency reaction’ (Cannon, 1927), or autonomic nervous system
accelerated heart rate, increased respiration, increased electrodermal response,
inhibition of digestion, secretion of adrenaline and noradrenaline, conversion of
glycogen to bile, and inhibition of bladder contraction. ANS arousal is elicited by
changes in both the physical and psychological environment. Psychological changes
that elicit the ANS arousal response include emotionally significant stimuli, and
novel or orienting stimuli. Physical changes include those that will potentially
disrupt the balance of any organ. The parasympathetic division serves to reverse
these responses since, on the whole, the two branches act antagonistically.
SCR was used as the measure of ANS arousal for three main reasons. First, SCR
measurement is non-intrusive and causes no irritation to the subject. Second, the use
of SCR enables comparison with other studies that have also chosen SCR as the
dependent variable (e.g., Mandler, 1964; MacDowell & Mandler, 1989). Finally,
and most importantly, SCR is determined only by the sympathetic branch of the
autonomic nervous system, and increases monotonically with intensifying
stimulation. SCR is also the best predictor of self-reported psychological arousal
(Lang, Greenwald, Bradley, & Hamm, 1993). In contrast, heart rate -w hich has also
been used as an index of autonomic arousal in psychological research - is innervated
by both the sympathetic and parasympathetic branches of the ANS, and has a
complex relationship with subjective reports of emotional arousal (Lang et al., 1993).
2.3: Experiment 1
It was hypothesised that magnitude of reinforcement would be represented in
response outcome expectations. It was therefore predicted that violations of
expected magnitude of reinforcement would result in significantly larger SCRs than
those following expected reinforcements of the same value. It was also predicted
that the detection of magnitude violations would be associated with rapid behavioural
change. Specifically, it was predicted that when presented with stimulus
combinations for which the correct stimulus to choose changed because of magnitude
2.4; Method
2.4.1: Subjects
Subjects were recruited locally and received payment and performance-related
chocolate rewards. Since the hypotheses to be tested were concerned with
psychophysiological and behavioural responses following expectation violations,
only subjects who developed expectations were included in the analyses. Thus two
subjects who made fewer than 60% correct token choices in phase 1 (expectation
acquisition) of the experiment were excluded from the analyses. This exclusion
criterion was also used in Experiments 2 and 3. The remaining 30 subjects comprised
12 male subjects and 18 female subjects. The mean age was 26 years (s.d. = 6).
2.4.2: Apparatus
An IBM-PC computer attached to a VGA colour monitor was used for game
presentation, and for the storage of token presentation sequences and subjects' token
choices. A MPIOOWSW Biopac physiological recording system was used with an
IBM-PC computer for storage of skin conductance data. The two computers were
interfaced.
Relative galvanic skin response was measured using a galvanic skin response
amplifier module together with Ag-AgCl finger electrodes attached to the medial
phalanges of the first and second fingers of the non-dominant hand. Standard
laboratory electrode gel was used as a conductant.
2.4.3: Procedure
A computerised task was used. A brief verbal description of the computer game and
the physiological measurement to be taken was given. The subject was then
connected to the physiological recording equipment and requested to sit as still as
possible. Only the dominant hand was used for computer play. The subject read the
game instructions from the computer screen while his or her skin conductance
response stabilised. The instructions were as follows:
Tokens (coloured squares) will appear on the screen in pairs. These represent mice that you can win or lose.
When the tokens appear, there will be a brief pause in the game. During this pause, you should decide which token you want your snake to eat.
Move the snake to the token. When you hit the token, a message will appear telling you how many mice you have won or lost.
A total will appear at the top o f the screen, telling you how many mice you have won so fa r in the game. Your snake is very hungry. Try hard to win as many mice as you can!
For every 1000 points you win in the game you will win a sweet. But fo r every 1000 points that you lose in the game, a sweet will be taken away.
At the beginning of each trial, tw o sm all coloured tokens appeared on the screen
sim ultaneously, equidistant from the snake's head (figure 2.1a). T he screen then froze
for four seconds. The subject was instructed to decide w hich token they w ere going
to eat during this period. W hen the screen unfroze, the subject m oved the snake to
the token of choice using the keyboard cursor keys. A m essage then appeared on the
screen telling the subject how m any m ice had been won or lost (figure 2.1b).
a) b)
Total = 1200 Total = 1500 300 point
The screen was frozen for four seconds, with the reinforcement message, to allow
measurement of SCRs following reinforcement. The playing field then cleared for
the next trial, and the total score message at the top of the screen was updated.
Subjects received a chocolate reward for every 1000 points they won. The chocolate
rewards were placed in front of the subject, or removed, as they were won or lost.
The game lasted approximately 30 minutes.
Six different colours of token were used. The tokens were presented in pairs in five
blocks. Each block contained 21 trials, comprising the 21 possible token
combinations (i.e., six same-colour token combinations and 15 different-colour token
combinations). There were three phases to the experiment: a familiarisation phase
(block 1), an expectation acquisition phase (blocks 2-3), and a violation phase
(blocks 4-5). There were no breaks between any of the phases, nor was the subject
informed that there were different phases in the experiment. Token pair
combinations were selected randomly within each phase of the experiment. In phase
1, each token was associated with a particular value, as shown in the Phase 1 column
of Table 2.1. Discrepancy was produced in the second phase by changing the points
associated with Tokens 1-4, as shown in the Phase 2 column of table 2.1. For
example. Token 1 was worth 100 points in phase 1, and 300 points in phase 2. The
control tokens. Tokens 5 and 6, kept the same points values throughout the
experiment.
Token Phase 1
(expectation acquisition)
Phase 2 (violation)
1 (magnitude change) 100 300
2 (magnitude change) -100 -300
3 (magnitude change) 300 100
4 (magnitude change) -300 -100
5 (control) 300 300
6 (control) -300 -300
Table 2.1: Points values of tokens in phase 1 and phase 2 of Experiment 1. Italic
text indicates a magnitude change in phase 2.
2.4.4: Data Treatment
Skin conductance amplitude change was calculated for the 1-4 second window after
period, and decreases in amplitude, were scored as zero. Following a linear
transformation of the addition of 1 to subjects’ SCRs, a log to base 10 transformation
was performed on this data. All SCR data are presented in microSiemens.
Transformed SCRs greater than 3 microSiemens were presumed to be too large to
have arisen from the experimental stimuli and were excluded from the analyses.
This exclusion criterion was used in all four experiments.
Scoring of token choices in phase 1 was as follows. A trial was scored as “correct” if
the subject chose the token with the largest value. A trial was scored as “incorrect” if
the subject chose the token with the least value. If the tokens were of equal value,
the trial was not scored.
2.5: Results & Discussion
2.5.1: Data Analyses
SCRs before token choices and after reinforcement were measured using a custom-
written Matlab program, blind to experimental condition. All analyses were
performed using SPSS software.
2.5.2: Behavioural Data
The behavioural exclusion criterion of at least 60% correct token choices in phase 1
guaranteed that all subjects had developed reinforcement expectations, as indexed by
token choices. In phase 1 (expectation acquisition), the mean number of correct
token choices was 23/26 (s.d. = 3). Figure 2.2 shows subjects’ token choice
performance categorised in terms of percentage correct choices when a positive and a
negative token were presented together (mean = 93%, s.d. = 12), two positive tokens
of different values (mean = 79%, s.d. = 28), and two negative tokens of different
values (mean = 71%, s.d. = 30). One-sample t-tests showed that performance in all
categories of token combinations was greater than chance, t(29) > 3.8, p < .005.
Thus, subjects were sensitive to differences in both magnitude and valence between
I
I
I
1 0 0 -1
80
-60
-40
-2 0
-P o s i t i v e - N e g a t i v e P o s i t i v e - P o s i t i v e N e g a t i v e - N e g a t i v e
T o k e n c o m b i n a t i o n c a t e g o r y
Figure 2.2: Token choice performance (percentage correct) for token
combinations consisting of: a positive and a negative token; two positive tokens
of different values; two negative tokens of different values.
A one-way repeated measures ANOVA with three-level factor Token Combination
(Positive-Negative, Positive-Positive, Negative-Negative) revealed a significant main
effect of Token combination, F (l, 29) = 14.9. p = .001. Paired samples t-tests
revealed that subjects performed significantly better on Positive-Negative token
combinations than on Positive-Positive token combinations, or Negative-Negative
token combinations, t(29) > 3.0, p < .01. There was no significant difference
between the subjects’ performance on Positive-Positive and Negative-Negative token
combinations, t(29) = 1.1, p = ns. These findings suggest that subjects learnt whether
tokens were positive or negative more reliably or more quickly than they learnt the
2.5.3: SCRs follow ing magnitude changes
It w as predicted that changes in the m agnitude of reinforcem ent w ould result in
significantly larger SC Rs than those follow ing expected reinforcem ents o f the sam e
value. T hat is, it was hypothesised that an unexpected reinforcem ent of 300 points
w ould produce a larger SCR than an expected reinforcem ent of 300 points. To test
this hypothesis, m ean SCR follow ing unexpected reinforcem ents in phase 2
(violation) w ere com pared w ith m ean SC R s follow ing expected reinforcem ents of
the sam e value in phase 1 (expectation acquisition). T o calculate m ean SC Rs
follow ing m agnitude changes, SC R s follow ing the first choice o f each o f the four
m agnitude change tokens (Tokens 1-4) in phase 2 w ere used. To calculate m ean
SC R s follow ing expected reinforcem ents, SC R s follow ing the last choice o f each of
the four m agnitude change tokens in phase 1 w ere used. T he difference betw een
these tw o m ean SC R values was then calculated. T his is referred to as the
M agnitude C hange difference score. Thus, the M agnitude C hange difference score
represents the increase in SC R due to violation o f expectations. T o control for global
changes in arousal throughout the course o f the experim ent, a Control difference
score was calculated in the sam e w ay as the M agnitude C hange difference score.
T his was done using SC R s follow ing choices of the tw o control tokens.
0.2 1
0.05
■o 0.05
-"* Magnitude Change
■ Control
Magnitude Change and Control difference scores are shown in figure 2.3. The
Magnitude Change score (mean = 0.015, s.d. = 0.47) was not significantly different
from the Control difference score (mean = 0.026, s.d. = 0.38), t(29) = 0.11, p = ns.
In other words, there was no SCR increase due to expectations of the magnitude of
reinforcement being violated. This does not support the hypothesis that magnitude is
represented in response outcome expectations. However, one possible explanation of
the absence of support for this hypothesis is that the change in magnitude was not
large enough to produce an arousal increase.
2.5.4: Token choice behaviour following magnitude changes
The next analysis investigated whether subjects adapted their token choices
following magnitude changes. In phase 2, there were two token combinations for
which the correct token to choose changed. Tokens I and 3 changed from 100 to 300
and 300 to 100 respectively. Thus Token 3 was the correct token to choose in the
first phase, and Token 1 in the second phase, for that combination. Tokens 2 and 4
changed from -100 to -3 0 0 and -3 0 0 to -1 0 0 respectively. Thus Token 2 was the
correct token to choose in the first phase, and Token 4 in the second phase, for that
combination.
In order to investigate behavioural change, token choice behaviour for these two
token combinations in the first and second blocks of phase 2 were calculated. If
magnitude changes trigger rapid and adaptive behavioural change, then token choice
performance when Tokens 1 and 3 and Tokens 2 and 4 are presented together for the
first time in phase 2 should be better than chance. The dependent variable was
frequency of correct token choices for these two token combinations in block 1. The
mean frequency of correct token choices was 48% (s.d. = 33). A one-sample t-test
revealed that this performance was not significantly better than chance, t(29) = .27, p
= ns. In contrast, performance in the second block of phase 2 (mean = 68%, s.d. =
68) was significantly better than chance, t(29) = 2.2, p < .05. It was reasoned that the
failure to see behavioural change in block 1 may have been due to subjects not
having had the opportunity to leam the new values of the magnitude change tokens
before the trials of interest. For example, a subject may have had to make a choice
between Tokens 1 and 3 without having observed the new value of Token 1 and/or