381
Volume 66 41 Number 2, 2018
https://doi.org/10.11118/actaun201866020381
THE INFLUENCE OF USING THE TRACTION
BOOSTER OF THE SEMI‑MOUNTED
PLOUGH ON THE PERFORMANCE
PARAMETERS OF THE PLOUGHING SET
Lukáš Renčín¹, Adam Polcar¹, František Bauer¹
¹ Department of Technology and Automobile Transport, Faculty of AgriSciences, Mendel University in Brno, Zemědělská 1, 613 00 Brno, Czech Republic,
Abstract
RENČÍN LUKÁŠ, POLCAR ADAM, BAUER FRANTIŠEK. 2018. The Influence of Using the Traction Booster of the Semi‑Mounted Plough on the Performance Parameters of The Ploughing Set. Acta Universitatis Agriculturae et Silviculturae Mendelianae Brunensis, 66(2): 381 – 388.
The objective of this article is to verify the influence of the use of the traction cylinder of the semi‑mounted plough on the performance parameters of the ploughing set., Claas Axion 850 set, equipped with Hexashift mechanical stepped gearbox, fully geared under the load of Pöttinger semi‑mounted plough was used for the purposes of the measurement. Assessed parameters included force in the upper rod, slip, effective performance of the set and fuel consumption. The results of the measurement clearly indicate the positive influence of the traction booster on the performance and energetic parameters of the ploughing set. By increasing the force in the upper rod, the torque is transferred to the land‑wheel which partially relieves the furrow wheel and transfers the weight pertaining to this wheel to the land‑wheel. This has decreased the slip (between 0 – 15 MPa: 7.5 % for plant‑bed wheel and 2 % for furrow wheel) and increased the performance of the set (hectare efficiency was increased by 3.7 %) while reducing consumption and eliminating the undesirable compaction. The difference of effective consumption was between the pressure 0 and 15 MPa 0,6 l / ha which corresponds to a decrease of 2.6 % and 2.89 ml / m3, equal to a decrease of 3.9 %. Except for some exceptions, the changes of the monitored parameters were not statistically significant. This was caused especially due to the conditions of the measurement and also due to the chosen aggregation. The measured values fluctuated due to soil non‑homogeneity, which was subsequently reflected in the size of the confidence intervals and due to the fact that the tractor was under‑dimensioned for the given conditions and the plough construction, the influence of the traction booster has not been proven to such an extent.
Keywords: traction booster, effective performance, effective fuel consumption, tractor slip, wheel load
INTRODUCTION
Agriculture and the associated food production depend on the soil and its fertility. The soil fertility is affected by many factors and the method of land management is one of them (Jandák et al., 2010; Šarapatka 2014). Growing of crops is related to soil tillage which is the costliest component of commodity production in terms of energy consumption. For this reason, there is an attempt
amount of post‑harvest residues into the soil and leave the soil in optimal conditions for wintering, ploughing is a necessary part of agro‑technical operations. Ploughing has traditionally been used to prepare the soil before sowing, to control weeds, to incorporate medium‑sized crops as plants for green fertilization into the soil and, last but not least, to incorporate organic fertilizer into the soil (Peigné et al., 2018). The disadvantage of ploughing consists in its energetic performance. Ploughing sets high demands in terms of the required thrust horsepower, this is accompanied by increased slipping of the wheels of the towing means (Moitzi et al., 2013). Tensile efficiency of the tractor is a significant factor affecting the tractor aggregation and hence the efficiency of the work carried out. Research shows that 20 up to 55 % of the energy transmitted over the tractor’s wheels are impaired by the mutual interaction of wheel and soil as a result of the slip (Burt et al., 1983). In addition, soil compaction can occur due to unsuitable adjustment of the plough as a result of the tractor travelling in the furrow and an unsuitable weight distribution on the wheels of the towing means. This can subsequently lead to the formation of compacted layers and a worsened percolation of water on the plot of land (Jeřábek et al., 2017). One of the possibilities how to eliminate the negative slip is using a so‑called traction booster. It is an optional device the modern ploughs may be equipped with, the aim of which is to transfer a part of the plough weight to the rear wheels of the towing means (Bauer et al., 2017). The driving force moving the tractor forward is for the low gears limited by the limit value of the width factor and the weight of the tractor. The width factor expresses the quality of the driving mechanism contact with the surface
and in combination with a load also what size of the driving force of the engine can be transferred to the surface. The factor varies with the deducted driving force and the type of the surface upon which the tractor is moving. There is a difference, whether the tensile performance is deduced from the movement on an asphalt surface or on shallow‑ploughed stubble. The second component of the driving force is the gravity, weight respectively, pertaining to the tractor’s wheels. We are able to change this or to change the distribution of the force and thereby to increase the potential tensile performance of the towing means (Bauer et al., 2013).
The article subject is verification of the influence of traction cylinder using at semi‑mounted plough on the performance parameters of a ploughing set.
MATERIALS AND METHODS
The measurement took place in November 2017 on the plot of land of Ametyst landowner collective, having its registered seat in a municipality of Ladislav in the Třebíč district. The cambi‑soil was the soil on which the measurement was made, catch crop of phacelia, which was intended for green fertilization, was ploughed. Winter wheat was the preceding crop. Samples were taken from a depth of 5, 10 and 15 cm in order to measure the soil moisture content. The average soil mass wetness was 22 %. The measurements were performed by the staff of Institute of Engineering and Automobile Traffic at the Mendel University in Brno., Claas Axion 850 set, equipped with Hexashift mechanical stepped gearbox, fully geared under the load of a semi‑mounted plough were used for the purpose of the measurement. The basic parameters of the tractor are shown in Tab. I.
I: Selected parameters of measured tractor (manufacturer’s data)
Engine
Cylinder capacity [cm3] 6728
Performance homologation value (97 / 68 EC1)[kW / k] 186 / 253
Gearbox
Type Hexashift – mechanical gearbox
(Gears being changed under load)
Tire size
Rear axle Trelleborg 710 / 70 R42
Front axle Trelleborg 600 / 70 R30
Dimensions and weights
Axle base [mm] 2980
Tractor weight [kg] 12010
Mass on front axle [kg] 5980
The tractor was equipped with a maximum possible additional weight.
The tractor measurement was made in aggregation with a Pöttinger semi‑mounted plough whose technical parameters are stated in Tab. II. The plough was attached to the tractor through the tractor’s three point hitch, with pins equipped with tensometric gauge mounted in the lower rods of the tractor which are used to scan the force in the lower rods for the proper operation of the tractors’ regulation hydraulics. The upper rod of the three‑point hitch was replaced by a rod provided with a tensometric sensor.
Four measurements were made for each pressure setting in the traction cylinder. The pressure was chosen from 0 MPa, thus without additional loading, up to the maximal possible pressure which amounted to 15 MPa. In order to accurately assess the influence of the traction booster, 3 measuring sections with the length of 30 meters were chosen for each measurement and there was
a sufficiently long section for starting driving and stabilising the parameters of the set. The tillage depth, the plough working width as well as the track of the tractor’s rear wheels (the land‑wheel and the furrow wheel) were measured in each section. Other parameters of the ploughing set, such as fuel consumption, performance, engine load and others were determined from the CAN‑ Bus on‑ board system of the tractor and transmitted via a WIFI signal to the stationary measuring workplace at the headland. The real speed of the set was measured by means of a GPS module located on the roof of the tractor. The soil tillage depth, the ploughs’ working width and the travelling speed were chosen in order to achieve 100 % workload of the tractor engine while achieving an adequate speed of the travelling in order to achieve the required quality of work. All measurements were made at one gear; changing gears would bring inaccuracies to the gained results. In order to maintain comparability of the measurements,
II: Selected parameters of aggregated machines (manufacturer’s data)
Pöttinger SERVO 6.50 PLUS NOVA
Type 9851
Weight [kg] 5150
Year of production 2016
Number of ploughing bodies 8
Body pitch [m] 0.102
Frame height [m] 0.90
Frame profile [mm] 180 × 180 × 10
The working width of the bodies [mm] 330 – 530
Additional equipment: Traction Control
A continuous change of the engagement Hydraulic protection of ploughing bodies
all measurements were made with the set position control of the tractor EHR (electronic‑hydraulic regulation) system.
The last measurements were made with the set maximum width of the ploughing sets. Since it was a plough which was equipped with a system for a variable change of width, the width of the ploughing sets was chosen for the measurement so that the tractor is adequately loaded. In this last trial, however, the width of the ploughing sets was set to the maximum. This width was overloaded for the tractor in the given conditions and this fact was also manifested in the slip. The aim was, once again, to assess the performance parameters of the set. The maximum possible pressure, thus 15 MPa was set in the traction cylinder of the plough, showing the best results of all measured pressures due to the highest transfer of load to the tractor’s rear wheels.
The assessed parameters included the already mentioned force in the upper rod, slip, effective performance of the set and fuel consumption. Both performance and fuel consumption were related to the area in hectares and the amount of the tillaged soil in m3. The calculation of slip, performances and fuel consumption was through relations (Bauer et al., 2013):
• slip
100
n z n
L L
L
δ= − ⋅ [%] (1)
where: Ln is the path of the unloaded wheel [m] and Lz is the path of the loaded wheel [m],
• effective performance of the set
ha 1 0,36 s b W
T
⋅ ⋅
= [ha / h] (2)
where T1 is time [s], s is the length of the measuring section [m] and b is the width of the machine [m], • effective volume efficiency
o 1 s b h W
T
⋅ ⋅
= [m3 / s] (3)
where: h is the depth of ploughing [m], • effective hectare fuel consumption
p 1 ha
Q .T Q
0,36.s.b
= [l / ha] (4)
where: Qp is an average hourly fuel consumption [l / h],
• effective volume fuel consumption
1 .10 ha m Q Q h −
= [ml / m3] (5)
The single factor ANOVA with multiple comparisons using the Tukey test was used for evaluation of the mentioned parameters. All calculations were made in the Statistica 12 Cz statistical software.
RESULTS AND DISCUSSION
The measurements were performed for different pressure settings in the traction cylinder: 0, 8, 12 and 15 MPa The width of the plough was adjusted in all measurements to a value of 3.21 m (the variation coefficient of the width values was overall around 1 %). During the last series of the measurements, the maximum possible plough’s working width (4.1 m) was set up. The depth of ploughing was the same in all measurements, being in average around 30 cm (with the variation coefficient of 5 %). The speed of the ploughing was also maintained
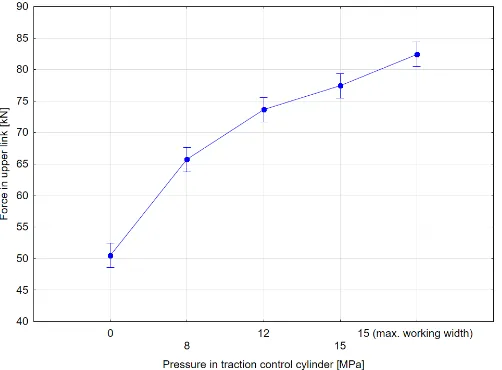
at the same value – on average 5.8 km / h (with the variation coefficient of 9 %). Among the first assessed parameters was force in the upper rod related to the pressure in the traction cylinder. The graphical results are stated in Fig. 3.
The results showed that as the pressure increases in the hydraulic cylinder, the tensile force in the upper rod increases. The biggest change occurred as the pressure was changed from MPa to a value of 8 MPa and then of 12 MPa. The change in force in these cases was found to be statistically highly significant (at a significance level of 99 %). However, the difference between the pressure of 12 and 15 MPa was not statistically significant, the increase in force was only by 3.8 kN. If we compare the forces in different width of the plough (at a pressure of 15 MPa), there was also a statistically significant (at a level of significance of 99 %) increase of force (approximately by 5 kN). This change is mainly due to the considerable increase of the ploughing resistance due to an increase of
the width almost by 0.9 m and thereby a higher load of the upper rod.
On the basis of the regression analysis it was found that the trend of the force has a linear increase as the pressure increases (statistically highly significant dependence of the regression model – p < 0.01). Fig. 4 shows the curve of the calculated regression model along with the equation and the determination coefficient. Based on the determination coefficient value it can be stated that it is a very accurate model (98.3 % of the data are explained by the model).
The higher force in the upper rod has caused an increased use of the plough weight, or increase of the plough weight transfer to the tractor’s rear wheels. The change in the load of the tractor’s wheels was subsequently reflected in the rear wheels slip (see Fig. 5).
As shown in Fig. 5, as the pressure increases, the slip of the wheel on the land decreases and the slip of the wheel in the furrow slightly
3: The dependence of the force in the upper rod on the pressure in the traction cylinder (the results of the single-factor ANOVA vertical
columns designate 95 % confidence intervals of the calculated mean values)
increases, there is a torque putting more load on the wheel on the land and slightly relieving the wheel in the furrow (Bauer et al., 2017). Nevertheless, the change of the slip cannot be classified as statistically significant due to the higher fluctuations during individual measurements (bigger distance between the confidence intervals). The large fluctuation of the measured data was caused especially by soil non‑homogeneity. A statistically significant change was determined only in the slip of the wheel in the furrow as the plough’s with was changed. The decrease slip between 0 – 15 MPa was 7.5 % (for plant‑bed wheel) and 2 % (for furrow wheel). Plant‑bed wheel were more loading by traction cylinder. This is leading to lesser compaction of furrow bed. As the width was changed, there was a more considerable increase of the slip (with the furrow‑wheel by 5.6 %, with the land‑wheel by 9 %) despite the high pressure
in the traction cylinder. The increase in the slip was related especially to the higher increase of the ploughing resistance.
The higher land‑wheel slip value (if compared with the furrow wheel) was caused especially by the catch crop intended for green fertilization which showed a higher moisture content.
Fig. 6 shows graphical results from the effective performance evaluation.
It can be seen from Fig. 6 that there are only small changes in efficiency in m3 / s as well as ha / h between the pressures 0 to 12 MPa. As the pressure was increased from 0 MPa to 15 MPa, the hectare efficiency was increased by 3.7 %. As the width has increases, the volume efficiency has increased by 6.6 % and the hectare efficiency by 14.8 %. Nevertheless all changes of efficiencies are not statistically significant. More important can be
5: The dependence of the land wheel’s and furrow wheel’s slip on the pressure in the traction cylinder (the results of the single-factor ANOVA,
vertical columns designate 95 % confidence intervals of the calculated mean values)
6: The dependence of effective performance on the pressure in the traction cylinder (results of the single-factor ANOVA, vertical columns
monitored in fuel consumption. The results of the effective fuel consumption are shown in Fig. 7.
Based on the results of the singe‑factor ANOVA it was found that the changes in fuel consumption cannot be classified as statistically significant. The biggest changes were obvious in the increase of the working width (at the same pressure in the traction cylinder). As a result of the increase, the consumption per processed hectare decreased by 3.17 l, which corresponds to a decrease of 16 % and 0.65 l per m3 which corresponds to a decrease by 9.7 % (if compared with a width of 3.22 m and a pressure at the traction cylinder 15 MPa). The difference of effective consumption was between the pressure 0 and 15 MPa 0,6 l / ha which corresponds to a decrease of 2.6 % and 2.89 ml / m3, equal to a decrease of 3.9 %.
Similar measurements have already been performed and the results achieved clearly show the influence of the correct adjustment of the upper rod of the tractor’s three‑point
coupling, respectively, the use of a traction booster on the efficiency parameters of the set. The published article from 2017 by Bauer et al., proves the significance of the correct adjustment of the upper rod of the three‑point hitch in ploughing (Bauer et al., 2017). By changing the length or suitable shortening of the upper rod while maintaining the quality of the plough work, we can transfer a part of the weight to the tractor’s rear wheels and thereby to improve the traction properties of the towing means (Čupera and Šmerda 2010). As described in the article during the measurement of the ploughing set of the John Deere 8295 tractor and the Pöttinger SERVO 6.50 plough which took place in 2014, fuel savings of 2.4 l / ha was achieved, using the maximum pressure in the traction booster. When the Claas Axion 850 tractor and Pöttinger 6.50 Plus Nova plough were measured, the average saving of 2.2 l / ha was achieved. At the same time, the wheels slip has decreased and the efficiency of the sets has increased (Bauer et al., 2016).
7: The dependence of effective fuel consumption on the pressure in the traction cylinder (the results of single-factor ANOVA, vertical columns
designate 95 % confidence intervals of the calculated mean values)
CONCLUSION
differences in terms of performance parameters may be caused, in particular, by the conditions of the measurement and also by the chosen aggregation. The measured values fluctuated due to soil non‑homogeneity, which was subsequently reflected in the size of the confidence intervals and due to the fact that the tractor was under‑dimensioned for the given conditions and the plough construction, the influence of the traction booster has not been proven to such an extent. However, as described above, in the comparable measurements performed, in different conditions and with other towing means, fuel savings up to 2.4 l / ha have been achieved. This claim can be supported also by the last measurement. The last measurements that were performed at the full width of the plough showed the best results in terms of performance and fuel consumption. As the results of the measurement performed show, the slip of the furrow wheel achieved values around 20 %, whereas the land‑wheel had a slip around 35 %. Such high slips are not desirable for the work of the ploughing sets. The tractor did not have tensile performance sufficient to work the plough at the full width of the plough, thus not achieving the required quality of work due to the fluctuation of the travelling speed and the time setting.
Acknowledgements
This contributed was created with the contribution of the IGA – Internal Grant Agency project of the Faculty of AgriSciences at the Mendel University in Brno: Spatial transformation of forces and torques in the three‑point hitch depending on the tractor’s hydraulic system setting, Nr. AF‑ IGA‑IP‑2017 / 039.
REFERENCES
BAUER, F., SEDLÁK, P., ČUPERA, J., POLCAR, A., FAJMAN, M., ŠMERDA, T. and KATRENČÍK, J. 2013. Traktory a jejich využití. 2nd edition. Praha: Profi Press.
BAUER, F., ČUPERA, J., SLIMAŘÍK, D., POLCAR, A., SEDLÁK, P., FAJMAN, M. and SLAVÍK, J. 2016. Měření pluhů Pöttinger s trakčním posilovačem. Mechanizace zemědělství, 66(3): 32–35.
BAUER, F., PORTEŠ, P., SLIMAŘÍK, D., ČUPERA, J. and FAJMAN, M. 2017. Observation of load transfer from fully mounted plough to tractor wheels by analysis of three point hitch forces during ploughing. Soil and Tillage Research, 172: 69–78.
BURT, E. C., LYNE, P. W., MEIRING, P. and KEEN, J. F. 1983. Ballast and inflation effect on tyre efficiency. Trans. ASAE, 26(5): 1352–1354.
ČUPERA, J. and ŠMERDA, T. 2010. Influence of top link length of three‑point hitch on performance parameters of ploughing set. Research in Agricultural Engineering, 56(3): 107–115.
EUROPEAN PARLIAMENT. 1997. Directive 97/68/EC on the approximation of the laws of the Member States relating to measures against the emission of gaseous and particulate pollutants from internal combustion engines to be installed in non-road mobile machinery. European Parliament.
JANDÁK, J., POKORNÝ, E. and PRAX, A. 2010. Půdoznalství. 3rd edition. Brno: Mendelova univerzita v Brně. JEŘÁBEK, J., ZUMR, D. and DOSTÁL, T. 2017. Identifying the plough pan position on cultivated soils by
measurements of electrical resistivity and penetration resistance. Soil and Tillage Research, 174: 231–240. MOITZI, G., HAAS, M., WAGENTRISTL, W., BOXBERGER, J. and GRONAUER, A. 2013. Energy
consumption in cultivating and ploughing with traction improvement system and consideration of the rear furrow wheel‑load in ploughing. Soil and Tillage Research, 134: 56–60.
MOITZI, G., WEINGARTMANN, H. and BOXBERGER, J. 2006. Effects of tillage systems and wheel slip on fuel consumption. In: Efficiency and Agricultural Engineering – International Scientific Conference, 2006; Rousse, Bulgaria PEIGNÉ, J., VIAN, J. F., PAYET, V. and SABY, N. P. A. 2017. Soil fertility after 10 years of conservation tillage in
organic farming. Soil and Tillage Research, 175: 194–204.
ŠARAPATKA, B. 2014. Pedologie a ochrana půdy. Olomouc: Univerzita Palackého v Olomouci.
Contact information Lukáš Renčín: lukas.rencin@mendelu.cz