O R I G I N A L R E S E A R C H
Clinical ef
fi
cacy of decitabine in combination with
standard-dose cytarabine, aclarubicin
hydrochloride, and granulocyte colony-stimulating
factor in the treatment of young patients with
newly diagnosed acute myeloid leukemia
This article was published in the following Dove Press journal:
OncoTargets and Therapy
Liping Dou1,2,*
Qingyu Xu1,*
Mengzhen Wang1,*
Yang Xiao1,*
Longcan Cheng2
Honghua Li1
Wenrong Huang1
Junhui Mei1
Yu Jing1
Jian Bo1,2
Daihong Liu1
Li Yu1
1Department of Hematology, Chinese
PLA General Hospital, Beijing 100853,
People’s Republic of China;2Department
of Hematology, Hainan Branch of Chinese PLA General Hospital, Sanya, Hainan
572013, People’s Republic of China
*These authors contributed equally to this work
Purpose: The chemotherapeutic regimen DCAG (decitabine with cytarabine, aclarubicin hydrochloride, and granulocyte colony-stimulating factor) is effective for elderly patients with acute myeloid leukemia, but recommendations for young patients remain controversial. This study investigated the tolerance and efficacy of DCAG for patients with newly diag-nosed acute myeloid leukemia (aged 14–60 years). The clinical features or molecular markers that may predict response to DCAG were identified.
Patients and methods:One-hundred sixty-one consecutive patients with newly diagnosed acute myelogenous leukemia received DCAG or standard (idarubicin plus cytarabine, IA) induction chemotherapy (n=64 and 97, respectively).
Results: The rates of complete remission after the first cycle, overall survival (OS), and event-free survival (EFS) were comparable. After the second cycle, the complete remission rate of the DCAG group (54.7%) was significantly lower than that of the reference (78.35%,
P=0.005). The following were associated with significantly worse OS, and EFS, in the DCAG group: Eastern Cooperative Oncology Group (ECOG) score ≥3 and no response after the second induction therapy; and FLT3-ITD. The multivariate analysis showed the DCAG group with significantly shorter OS associated with ECOG≥3 and FLT3-ITD. In the DCAG group, after thefirst cycle of induction chemotherapy the median recovery times of neutrophils and platelets were 15.8 and 13 days.
Conclusion:The DCAG and IA groups were similar with regard to complete remission rate after thefirst cycle, OS, and EFS. The complete remission rate after the second cycle of the DCAG was significantly lower than that of the IA. Grade 4 neutropenia and thrombocyto-penia were a major adverse event associated with DCAG.
Keywords: decitabine, acute myeloid leukemia, induction therapy, conventional chemotherapy
Introduction
Despite recent progress in leukemogenesis and diagnosis of acute myelogenous leukemia (AML), advances in AML induction chemotherapy treatment are limited. Over the past years, combination chemotherapy with anthracycline and standard dose cytarabine (standard 3+7 induction therapy) remains the standard induction
Correspondence: Daihong Liu; Li Yu Department of Hematology, Chinese PLA General Hospital, Fuxing Road 28th,
Haidian District, Beijing 100853, People’s
Republic of China Tel +86 139 1003 7231 Fax +86 106 815 0721 Email daihongrm@163.com; liyu301@vip.163.com
OncoTargets and Therapy
Dove
press
open access to scientific and medical research
Open Access Full Text Article
OncoTargets and Therapy downloaded from https://www.dovepress.com/ by 118.70.13.36 on 25-Aug-2020
therapy. IA induction chemotherapy (idarubicin plus cytar-abine, or, conventional chemotherapy) for AML, results in
an overall response rate of about 70%.1–7 Prognosis of
patients who are resistant to standard induction chemother-apy is dismal.
The heterogeneity of AML suggests that two-drug 3+7 induction chemotherapy is unlikely to cure all patients, and that combinations of traditional chemotherapy with novel agents will be required to achieve this goal. Recent progress in matching clinical and genomic data may assist in selecting the best-individualized induction therapy for each patient. Emerging evidence indicates that a hypomethylating agent such as decitabine may be effective in certain AML subtypes and selected patients, providing further rationale for a personalized medicine approach. However, clinical data about decitabine in combined induction chemotherapy are limited for the treatment of AML.
Randomized trials of the hypomethylating agent deci-tabine, used solely to treat patients with newly diagnosed
AML, have shown complete response rates of 18–28%,
and median overall survival (OS) from 8 to 10 months.7–13
Our research group and others14–16 have combined the
chemotherapy regime CAG (ie, low-dose cytarabine
[10 mg/m2q12 hrs for 5 days], aclarubicin hydrochloride
[10 mg/day for 5 days], and granulocyte colony-stimulating factor) with decitabine (DCAG). This regimen was designed to exploit the synergy among these agents to improve the proportion of patients achieving response. The overall rate of response (ie, hematologic improvement and partial and complete remission) for elderly AML patients to two cycles of DCAG has been 72.4%. In elderly AML patients, the 2-year disease-free survival and OS were, respectively, 36.9% and 59.6%. However, recommenda-tions regarding DCAG chemotherapy for younger patients
with AML have remained controversial.8,17–25
In this study, we evaluated the efficacy and toxicity of
DCAG, relative to the standard dose chemotherapy regimen
(IA), for patients with newly diagnosed AML, aged 14–60
years. The modifications included that the dose of
cytara-bine was increased to 100 mg/m2q12 hrs for 5 days and
aclarubicin hydrochloride was increased to 20 mg/m2for 5
days. (For elderly patients with AML, the standard dosages
of cytarabine and aclarubicin hydrochloride are 10 mg/m2
q12 hrs and 10 mg/day, respectively, each for 5 days.) The primary objective of this study was to determine whether induction therapy with DCAG resulted in similar remission rates, OS, or event-free survival (EFS) compared the IA regimen. Additionally, clinical features or molecular
markers were investigated that may predict the response of patients with AML to DCAG, and may differentiate those patients who are more likely to respond to DCAG.
Materials and methods
The review board of Chinese PLA General Hospital approved all the study procedures, and the informed con-sent forms, in accordance with the Declaration of Helsinki.
Patients
Between April 2012 and September 2017, 161 consecutive
patients with AML were enrolled in this study (Table 1).
Among these patients, 97 received IA induction che-motherapy, with idarubicin and cytarabine for 7 days. DCAG was administrated to the other 64 patients.
All these patients received diagnoses of AML (not includ-ing acute promyelocytic leukemia) based on criteria of the
French-American-British and World Health Organization,1,5
and all patients provided written informed consent.
At diagnosis, bone marrow was obtained from each patient, and chromosomal analysis and immunophenotyp-ing were conducted. The followimmunophenotyp-ing molecular markers were analyzed: AML1-ETO, PML (promyelocytic leuke-mia)/RARA (retinoic acid receptor alpha), NPM1 (nucleo-phosmin 1), CBFB (core-binding factor beta)/MYH11 (myosin heavy chain 11), and MLL PTD (partial tandem duplication). Patients with AML1-ETO, PML/RARA, CBFB/MYH11, and/or NPM1 without FLT3 (FMS-like tyrosine kinase receptor 3)-ITD (internal tandem
duplica-tion) were defined as favorable-risk in accordance with the
NCCN (National Comprehensive Cancer Network) AML risk status evaluation. Patients with the following were considered poor-risk: complex karyotypes, unfavorable cytogenetics, FLT3-ITD gene expression, or TP53
muta-tion. Other patients were classified as intermediate-risk.
Therapy
We retrospectively studied 161 patients with AML who received induction chemotherapy (DCAG or IA induction chemotherapy). The treatment choice was based on patient
wishes, as policy. Specifically, 97 patients received IA
induction chemotherapy, with idarubicin (10–12 mg/m2)
for 3 days and cytarabine (100 mg/m2, every 12 hrs) for 7
days. Another 64 patients received a DCAG regimen:
decitabine 20 mg/m2, days 1–5; aclarubicin 20 mg/m2,
days 1–5; cytarabine 100 mg/m2, every 12 hrs, days 1–5;
and granulocyte colony-stimulating factor 300μg/day
sub-cutaneously from day 0 to the time of neutrophil recovery.
OncoTargets and Therapy downloaded from https://www.dovepress.com/ by 118.70.13.36 on 25-Aug-2020
Consolidation chemotherapy was administered to 56 patients in the DCAG group and 89 patients in the IA induction chemotherapy group, consisting of the follow-ing: conventional dose of cytarabine and anthracycline, or mitoxantrone; or middle-to-high-dose cytarabine; or hema-topoietic stem cell transplantation. Among them, the patients who received >2 cycles of consolidation che-motherapy were used for the survival analysis.
Routine blood count, liver function, and electrolyte and creatinine levels were recorded twice each week. Adverse events, concomitant medications, and clinical laboratory analyses were recorded weekly. The treatment continued until any of the following occurred: disease progression, intolerable toxicity, death, loss to follow-up, abandonment of treatment, or withdrawal of consent to further treatment. All patients received supportive care in accordance with institutional practices, including blood product transfusions and prophylactic or symptomatic use of anti-infective
agents and cytokines, and other therapies appropriate for the symptomatic treatment of AML and its complications.
Targeted sequencing
The sequencing panel targets a ~250-kb genomic region, which comprises the entire coding sequences of 126 genes
that are recurrently mutated in acute leukemia8(Tables S1
andS2). Mononuclear cells were enriched from
pretreat-ment bone marrow by Ficoll density gradient centrifuga-tion. Nimble Design GenSeq Cap EZ Choice was
performed in accordance with the manufacturer’s protocol.
With an Illumina HiSeq 2500, multiplexed libraries were sequenced using 100-bp paired-end runs. Reads were aligned to human genomic reference sequences using the Burrows-Wheeler alignment tool (HG19, NCBI built 37). To identify single nucleotide polymorphisms and short insertions and deletion, MuTect2 was performed with recommended parameters. A subset of somatic mutations
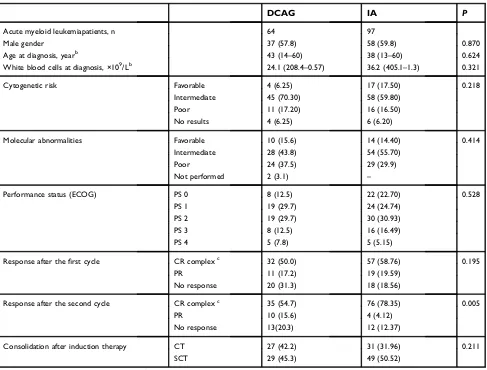
Table 1Clinical characteristics of the patientsa
DCAG IA P
Acute myeloid leukemiapatients, n 64 97
Male gender 37 (57.8) 58 (59.8) 0.870
Age at diagnosis, yearb 43 (14–60) 38 (13–60) 0.624
White blood cells at diagnosis, ×109/Lb 24.1 (208.4–0.57) 36.2 (405.1–1.3) 0.321
Cytogenetic risk Favorable 4 (6.25) 17 (17.50) 0.218
Intermediate 45 (70.30) 58 (59.80)
Poor 11 (17.20) 16 (16.50)
No results 4 (6.25) 6 (6.20)
Molecular abnormalities Favorable 10 (15.6) 14 (14.40) 0.414
Intermediate 28 (43.8) 54 (55.70)
Poor 24 (37.5) 29 (29.9)
Not performed 2 (3.1) –
Performance status (ECOG) PS 0 8 (12.5) 22 (22.70) 0.528
PS 1 19 (29.7) 24 (24.74)
PS 2 19 (29.7) 30 (30.93)
PS 3 8 (12.5) 16 (16.49)
PS 4 5 (7.8) 5 (5.15)
Response after thefirst cycle CR complexc 32 (50.0) 57 (58.76) 0.195
PR 11 (17.2) 19 (19.59)
No response 20 (31.3) 18 (18.56)
Response after the second cycle CR complexc 35 (54.7) 76 (78.35) 0.005
PR 10 (15.6) 4 (4.12)
No response 13(20.3) 12 (12.37)
Consolidation after induction therapy CT 27 (42.2) 31 (31.96) 0.211
SCT 29 (45.3) 49 (50.52)
Notes:a
Reported as n (%), unless noted otherwise;b
reported as median (range);c
CR complex, complete remission (CR) + CR with incomplete blood count recovery (CRi).
Abbreviations:PS, performance status; CT, chemotherapy; CR, complete remission; PR, partial remission; SCT, stem cell transplant.
OncoTargets and Therapy downloaded from https://www.dovepress.com/ by 118.70.13.36 on 25-Aug-2020
was selected randomly for validation using Sanger
sequen-cing (Table S3).
Ef
fi
cacy evaluation
Routine blood cell counts were performed twice each week after chemotherapy. Three to four weeks after che-motherapy, bone marrow aspiration was performed and the responses to treatment were evaluated.
OS was measured from the time of diagnosis to death from
any cause. EFS was measured from the time offirst complete
response to leukemia relapse. For secondary endpoints, bone marrow biopsies and aspirates were obtained from patients at the time of screening.
The nature of response was defined in accordance with
the criteria of the International Working Group.14
Specifically, for a complete response the patient
demon-strated <5% bone marrow myeloblasts, no myeloblasts with Auer rods, the absence of extramedullary disease, an absolute neutrophil count >1×10⁹/L, and a platelet count≥100×109/ L. A complete response with incomplete blood count recov-ery was diagnosed when the patient had <5% bone marrow myeloblasts, no myeloblasts with Auer rods, the absence of extramedullary disease, but with incomplete blood cell
recovery. A partial response was defined as a decrease of
≥50% (ie, to 5–25% total) in the myeloblasts detected in bone
marrow aspirates, and those with normalized blood counts. No response was the absence of both complete and partial response. Relapse was the reappearance of leukemia cells in the peripheral blood, or >5% myeloblasts in the bone
mar-row. Induction death was defined as death occurring before
response evaluation, unless evidence of resistant disease was provided at least 7 days after the conclusion of the chemotherapy.
Neutrophil and platelet recovery were defined,
respec-tively, as absolute neutrophil count >0.5×10⁹/L and platelet count >30×109/L, for 3 consecutive days. The time to
neutro-phil or platelet recovery was the time to thefirst day of 3
consecutive days of recovery. Toxicities were assessed in accordance with the National Cancer Institute Common
Toxicity Criterion Version 3.14
Statistical analyses
We studied associations between various gene mutations
and patient clinical characteristics, using Fisher’s exact
test or chi-squared tests for categorical endpoints (eg, response), and the Wilcoxon rank-sum test for continuous variables. Analyses of treatment outcomes were based on
commonly accepted definitions of complete remission, OS,
and EFS. P-values were calculated using the Kaplan–
Meier method for survival analyses. A Cox proportional
hazard model was used to assess the prognostic signifi
-cance of the genetic mutations and clinical variables. To investigate clinical features and genetic mutations predict-ing outcomes after DCAG or IA induction chemotherapy, logistic and Cox multivariable analyses of the entire cohort for EFS and OS were performed, including treatment arm as a covariate. All analyses were performed with GraphPad Prism 5 software. Statistical analyses were
con-ducted with SPSS 19.0. P<0.05 was considered
statisti-cally significant.
Results
Patient characteristics
This study enrolled 161 individuals with newly diagnosed AML (median age 43.8 years), among whom 64 and 97, respectively, were treated with the DCAG regimen and IA
induction chemotherapy (Table 1). The two groups were
simi-lar with respect to gender, risk status, white blood cell (WBC), and performance status.
The DCAG group received a median of 2 cycles induc-tion therapy of DCAG; 56 (87.5%) received >2 cycles of consolidation therapy, including consolidation
chemother-apy or stem cell transplantation (Figure 1). The IA
induc-tion chemotherapy group underwent a median of 2 cycles of IA induction chemotherapy; 80 (82.5%) received >2 cycles of other consolidation chemotherapy or stem cell transplantation. All patients underwent molecular testing at baseline using a next-generation sequencing 126-gene panel, comprising genes that are recurrently known to be
mutated in acute leukemia (Tables S1andS2).
Response and survival
Of the 64 subjects enrolled in the DCAG group, 43 responded to a single induction cycle. Of these, 32 (50%), 11 (17.2%), and 20 (31.3%) experienced, respec-tively, a complete (with complete or incomplete count
recovery), partial, or no response (Table 1). Forty-five
responded to 2 induction cycles; of these, 35 (54.7%), 10 (15.6%), and 13 (20.3%) experienced achieved a complete (with complete or incomplete count recovery), partial, or no response. All subjects with a partial response had a complete hematologic response with a median bone marrow myeloblast count of 13.2% at the beginning of the second induction. One patient withdrew from the DCAG group before a bone marrow biopsy could be
OncoTargets and Therapy downloaded from https://www.dovepress.com/ by 118.70.13.36 on 25-Aug-2020
performed at the end of thefirst cycle and therefore could not be clinically evaluated for a response.
Of the 97 subjects in the IA induction chemotherapy group, 76 responded to a single induction cycle. Of these, 57 (58.7%), 19 (19.6%), and 18 (18.6%) showed, respec-tively, a complete (with complete or incomplete count
recov-ery), partial, or no response (Table 1). Eighty responded to 2
induction cycles; of these, 76 (78.35%), 4 (4.12%), and 12 (12.37%) experienced, respectively, a complete (with com-plete or incomcom-plete count recovery), partial, or no response. The DCAG and IA induction chemotherapy groups were statistically similar with regard to complete remission rate
after the first cycle (P=0.195), OS (P=0.271), and EFS
(P=0.831). Kaplan–Meier estimates for OS for the DCAG
group at 1 and 2 years were 66.2% (95% CI 50.3–78.1%)
and 60.2% (95% CI 50.3–78.1%). The estimated EFSs of the
DCAG group at 1 and 2 years were 61.8% (95% CI
45.8–73.6%) and 58.4% (95% CI 41.9–71.7%). Kaplan–
Meier estimates for OS for the IA group at 1 and 2 years
were 80.9% (95% CI 7.09–87.7%) and 64.7% (95% CI
52.8–74.3%). The estimated EFSs for the IA group at 1 and
2 years were 73.1% (95% CI 62.5–81.2%) and 62.6% (95% CI
50.9–72.3%).
Among the 15 patients with FLT3-ITD mutation in the DCAG group, after 2 induction cycles, 5 (33.33%), 4 (26.67%), and 6 (40.00%) achieved, respectively, a complete (with complete or incomplete count recovery), partial, or no response. Among 11 patients with FLT3-ITD mutation in the IA induction chemotherapy group, after 2 induction cycles, 8 (72.70%), 1 (9.09%), and 2 (18.17%) achieved, respectively, a complete (with complete or incomplete count recovery), partial, or no response. When considering only the patients with FLT3-ITD mutation, the response of those receiving DCAG was similar to that of the patients who received IA
induction chemotherapy (P=0.395). In the present study, 9
ITD-positive patients in the DCAG group and 9 FLT3-ITD-positive patients in the DCAG group received allogeneic peripheral blood stem cell transplantation.
Prognostic signi
fi
cance of clinical features
and gene mutations in patients receiving
DCAG
Several disease and patient characteristics are known to
affect survival in AML. These include Eastern
Cooperative Oncology Group (ECOG) score ≥3;
N=161
Conventional chemotherapy (n=97)
Decitabine combined chemotherapy n=64
Withdrawn/discontinued n=5
Withdrawn/discontinued DCAG n=8
2 cycles of3+7 induction chemotherapy n=92 2 cycles of DCAG induction
chemotherapy n=58
Withdrawn/discontinued n=12 Withdrawn/discontinued n=2
Consolidation therapy after induction therapy n=80 Consolidation therapy after
induction therapy n=56
Trasplantation n=49 Trasplantation n=29 Chemotherapy n=31
Chemotherapy n=27
Figure 1Schematic of patient selection for analysis.
Abbreviation:DCAG, decitabine combined with chemotherapy.
OncoTargets and Therapy downloaded from https://www.dovepress.com/ by 118.70.13.36 on 25-Aug-2020
cytogenetics poor-risk status; NCCN poor-risk status; with or without hematopoietic stem cell transplantation; number of DNA methylation-related mutations; number of overall mutations; lack of response (i.e, no response,
NR) after the first induction therapy; NR after
the second induction therapy; and without extramedul-lary infiltration.
The associations of these variables with OS and EFS were investigated. For the patients who underwent DCAG, the following factors were associated with poor OS
according to the log-rank test: ECOG score ≥3
(P=0.001); NCCN high-risk status (P=0.004); NR after
the second induction therapy (P=0.040); and FLT3-ITD
(P=0.0001;Figure 2A). In addition, the following factors
Figure 2Effects of genetic risk on survival in patients receiving DCAG therapy. (A–D) Kaplan–Meier curves for patients with and without mutations are depicted for
patients who received DCAG. (A) FLT3-ITD for OS. (B) FLT3-ITD for EFS. (CandD) Volcano plots of hazard ratios (in horizontal axis) and correspondingP-values (in vertical axis) according to the univariate analysis of the effect of individual genetic and clinical features on (C) OS and (D) EFS. Size of circles corresponds to the fraction of patients carrying indicated factors. Those that are significant (P<0.05) are annotated.
Abbreviations:DCAG, decitabine combined with chemotherapy; OS, overall survival; EFS, event free survival; FLT3-ITD, FMS-like tyrosine kinase receptor 3 internal
tandem duplication; HR, hazard ratios; NR, no response; NCCN, National Comprehensive Cancer Network; ECOG, Eastern Cooperative Oncology Group.
OncoTargets and Therapy downloaded from https://www.dovepress.com/ by 118.70.13.36 on 25-Aug-2020
were associated with poor EFS for patients who underwent
DCAG: ECOG score ≥3 (P=0.0004); NCCN poor-risk
status (P=0.008); cytogenetics poor-risk status (P=0.025);
NR after the second induction therapy (P=0.046); or
FLT3-ITD (P=0.002;Figure 2B).
Next examined was the HR for death associated with mutations in the 10 genes mutated in >5% of patients in
this DCAG cohort (Table 2, Figure 2C and D). In the
univariable analysis, FLT3-ITD mutations were also
asso-ciated with shorter OS (HR 4.69, 95% CI 1.89–11.69,
P<0.05) and shorter EFS (HR 3.80, 95% CI 1.49–9.73,
P<0.05). No genetic mutations were associated with
longer EFS or OS.
In the DCAG group, the univariate analysis determined that the following were associated with OS and EFS (Table 2, Figure 2C and D): ECOG score ≥3 (OS, HR
7.66, 95% CI 1.39–42.16,P=0.019; EFS, HR 6.04, 95%
CI 1.08–33.89, P=0.041); NR after the second induction
therapy (OS, HR 4.12, 95% CI 1.10–15.40,P=0.035; EFS,
HR 4.34, 95% CI 1.14–16.45, P=0.031); and FLT3-ITD
(OS, HR 4.69, 95% CI 1.89–11.69, P=0.001; EFS, HR
3.80, 95% CI 1.49–9.73, P=0.005). Also in the DCAG
group, the multivariate analysis (Table 2) showed that the
following were significantly associated with shorter OS:
ECOG score ≥3 (HR 66.75, 95% CI 1.49–298.53,
P=0.030), and FLT3-ITD (HR 20.08, 95% CI 1.18–
-342.10, P=0.038).
Prognostic signi
fi
cance of clinical features
and gene mutations in patients receiving
IA induction chemotherapy
In patients receiving IA induction chemotherapy, the log-rank
test indicated that NR after the first (OS, P=0.0004; EFS,
P=0.001) or second induction therapy (OS,P=0.0003; EFS,
P=0.005) defined a set of subgroups with poor OS and EFS
(Figure S1). The univariate analysis showed that the
follow-ing were significantly associated with OS and EFS (Table 3,
Figure 3AandB): NR after thefirst induction therapy (OS,
HR 4.53, 95% CI 2.03–10.10,P=0.0004; EFS, HR 3.97, 95%
CI 1.79–8.80,P=0.012) or second induction therapy (OS, HR
11.33, 95% CI 5.13–25.03,P=0.0003; EFS, HR 13.02, 95%
CI 5.87–28.86, P=0.001); NCCN poor-risk status (OS, HR
3.37, 95% CI 1.35–8.41,P=0.009; EFS, HR 3.53, 95% CI
1.41–8.82,P=0.007); and no extramedullary infiltration (OS,
HR 0.35, 95% CI 0.17–0.71,P=0.004; EFS, HR 0.32, 95% CI
0.16–0.65,P=0.002). In these patients, the univariate analysis
also showed that a ECOG score ≥3 (HR 3.99, 95% CI
1.00–15.84,P=0.050) was significantly associated with OS.
The multivariate analysis showed that no extramedullary
infiltration (HR 0.07, 95% CI 0.02–0.32, P=0.001) and an
ECOG score≥3 (HR 14.49, 95% CI 2.59–83.33,P=0.009)
were significantly associated with shorter OS. Significantly
associated with EFS were no extramedullary infiltration (HR
0.15, 95% CI 0.05–0.05,P=0.009).
Table 2Univariate and multivariate analyses for the risk factors of OS and EFS in 64 AML patients receiving DCAG therapy (with statistical significance)*
Univariate Multivariate
OS (HR 95% CI) P EFS (HR 95% CI) P OS (HR 95% CI) P
NR post-first induction 1.82 (0.67–4.89) 0.239 0.50 (0.11–2.331) 0.377 – –
NR post-second induction 4.12 (1.10–15.40) 0.035 4.34 (1.14–16.45) 0.031 – –
No extramedullary infiltration 3.73 (0.50–28.15) 0.201 3.16 (0.42–3.81) 0.265 – –
NCCN poor-risk status 5.25 (0.69–40.16) 0.110 5.07 (0.66–38.84) 0.119 – –
Cytogenetic poor-risk status 69.16 (0–94.15) 0.998 72.24 (0–98.56) 0.998 – –
Stem cell transplant 0.60 (0.17–2.09) 0.421 0.66 (0.19–2.34) 0.523 – –
ECOG score≥3 7.66 (1.39–42.16) 0.019 6.04 (1.08–33.89) 0.041 66.75 (1.49–298.53) 0.030
ASXL1 1.00 (0.13–7.56) 0.998 1.00 (0.13–7.59) 0.999 – –
U2AF1 8.45(1.74–40.92) 0.005 5.31 (1.08–26.08) 0.040 – –
FLT3-ITD 4.69 (1.89–11.69) 0.001 3.80 (1.49–9.73) 0.005 20.08 (1.18–342.10) 0.038
IDH2 1.17 (0.27–5.11) 0.833 – – – –
Note:*reported as OS or EFS (HR 95% CI).
Abbreviations:OS, overall survival; EFS, event free survival; AML, acute myeloid leukemia; DCAG, decitabine combined with chemotherapy; HR, hazard ratios; CI,
cumulative incidence; NR, no response; NCCN, National Comprehensive Cancer Network; ECOG, Eastern Cooperative Oncology Group; ASXL1, additional sex combs like transcriptional regulator 1; U2AF1, U2 small nuclear RNA auxiliary factor 1; FLT3-ITD, FMS-like tyrosine kinase receptor 3 internal tandem duplication; IDH2, isocitrate dehydrogenase 2.
OncoTargets and Therapy downloaded from https://www.dovepress.com/ by 118.70.13.36 on 25-Aug-2020
Clinical features of patients with
mutations in DNA methylation
In this study, the highest rate of mutations were class I (62/161, 38.5%), such as FLT3-ITD, KIT, NRAS, KRAS, and PTPN11 (protein tyrosine phosphatase, non-receptor type 11). The next
most frequent were epigenetic modification mutations (60/
161, 37.3%) including DNMT3A, TET2, IDH1/2, ASXL1, DOT1L. The third and fourth most frequent mutations were class II (42/161, 26.1%; NPM1, CEBPA, RUNX1, GATA2, and ETV6) and tumor suppressor mutations (26/161, 16.1%; WT1, PHF6, and TP53). Also, spliceosome genes, cohesion
complex genes, and NOTCH family mutations were identified
in 12 (7.5%), 17 (10.6%) and 1 (0.6%) patient, respectively (Figure S2). Spliceosome genes included U2AF1, SRSF2, and SF3B1/2, and cohesion complex genes were STAG2, RAD21, SMC1A, and SMC3.
Gene mutations related to DNA methylation (TET2, DNMT3A, and IDH1/IDH2) are among the most frequently
identified in AML, and demethylating agents are effectively
used in treating AML (6–8). Therefore, we analyzed the
clinical features of the patients harboring these mutations. Of the 161 patients with follow-up data, 37 carried altogether 43 mutations in TET2 or DNMT3A/DNMT3B, with or without IDH1/IDH2. DNMT3A/IDH1 co-mutations were found in 4 patients, DNMT3A/TET2 co-mutations in one patient, and DNMT3A/IDH2 co-mutation in one patient. Thirty-one patients carried only one DNA methylation-related mutation. Compared with the 124 patients without DNA methylation-related mutations (age 40.9 years, favorable risk status
19.83%, ≥2 mutations 59.7%), the 37 patients with these
mutations were significantly older with progressive diseases
(53.5 years;P=0.01), with lower favorable risk status (2.86%;
P=0.027), and were more likely to have≥2 mutations (91.9%;
P=0.0004). However, the 2 groups were similar in EFS and
OS (P=0.36 andP=0.47, respectively).
In the DCAG group specifically, there were no significant
differences in OS or EFS (P=0.57 andP=0.48, respectively)
between patients without DNA methylation-related muta-tions and those with such mutamuta-tions (TET2, DNMT3A, and IDH1/IDH2).
Hematopoietic toxicity and
treatment-related death
Grade 4 neutropenia and thrombocytopenia were universal
in the study population (Table S4).
In the DCAG group specifically, after the first cycle of
induction chemotherapy the median recovery times of
T able 3 Univariate and multivariate analyses for the risk factors of OS and EFS in 97 AML patients receiving IA chemotherap y (with statistical signi fi cance)* Univariate Multivariate OS (HR 95% CI) P EFS (HR 95% CI) P OS (HR 95% CI) P EFS (HR 95% CI) P NR post-fi rst induction 4.53 (2.03 – 10.10) 0.0004 3.97 (1.79 – 8.80) 0.012 –– – – NR post-second induction 11.33 (5.13 – 25.03) 0.0003 13.02 (5.87 – 28.86) 0.001 –– – – No Extramedullar y in fi ltration 0.35 (0.17 – 0.71) 0.004 0.32 (0.16 – 0.65) 0.002 0.07 (0.02 – 0.32) 0.001 0.15 (0.05 – 0.05) 0.009 NCCN poor -risk status 3.37 (1.35 – 8.41) 0.009 3.53 (1.41 – 8.82) 0.007 –– – – Cytogenetic poor -risk status 2.09 (0.38 – 11.45) 0.394 2.33 (0.43 – 12.75) 0.328 –– – – Stem cell transplant 0.13 (0.06 – 0.28) 0.0004 0.14 (0.07 – 0.29) 0.0005 0.08 (0.02 – 0.33) 0.0003 0.12 (0.03 – 0.39) 0.0004 ECOG scor e ≥ 3 3.99 (1.00 – 15.84) 0.050 3.54 (0.91 – 13.81) 0.069 14.49 (2.59 – 83.33) 0.009 –– U2AF1 1.64 (0.22 – 12.03) 0.628 1.65 (0.23 – 12.07) 0.624 –– – – FL T3-ITD 0.48 (0.12 – 2.03) 0.320 0.75 (0.23 – 2.45) 0.632 –– – – ASXL1 2.63 (1.13 – 6.11) 0.025 3.08 (1.33 – 7.11) 0.009 –– – – IDH2 2.71 (0.95 – 7.75) 0.064 3.03 (1.05 – 8.68) 0.040 –– – – Note: *r epor ted as OS or EFS (HR 95% CI). Abbre viations: OS, ov erall sur vival; EFS, e vent fr ee sur vival; AML, acute m yeloid leuk emia; DC A G, decitabine combined with chemotherap y; HR, hazard ratios; CI, cu mulative incidence; NR, no re sponse; NCCN, National Compr ehensiv e Cancer Netw ork; ECOG, Eastern Cooperativ e Oncology Gr oup; ASXL1, additional sex combs lik e transcriptional regulator 1; U2AF1, U2 small nuclear RNA auxiliar y factor 1; FL T3-ITD , FMS-lik e tyr osine kinase re ceptor 3 internal tandem duplication; IDH2, isocitrate deh ydr ogenase 2.
OncoTargets and Therapy downloaded from https://www.dovepress.com/ by 118.70.13.36 on 25-Aug-2020
neutrophils and platelets were 15.8 and 13 days, respectively.
Platelet recovery (≥20×109/L) typically preceded WBC count
recovery after induction chemotherapy for AML. The pace of platelet recovery was generally brisk, with a median of 13 days
for the platelet level to rise higher than 20×109/L. The most
common grade-3 or grade-4 adverse events were related to myelosuppression. No patients in the DCAG group died dur-ing the induction therapy and no subject required to transfer to intensive care.
Discussion
This study evaluated the efficacy and toxicities of DCAG
(standard dose cytarabine [100 mg/m2q12 hrs for 5 days] and
increased dose of aclarubicin hydrochloride [20 mg/d for 5 days]) relative to standard dose chemotherapy regimens (control) for non-elderly patients with newly diagnosed
AML (aged 14–60 years). Pretreatment genetic testing was
also conducted. The DCAG and IA induction chemotherapy groups were statistically similar with regard to complete
remission rate after thefirst cycle, OS, and EFS.
Previous reports6,26 showed that AML patients treated
with decitabine only responded poorly. Most patients required at least two monthly cycles to achieve a clinical response, and many needed three or more cycles. The present study showed
that induction therapy combining decitabine with a modified
CAG regimen was safe, but with a complete remission rate of 54.7% after two cycles of induction chemotherapy. The DCAG regimen was well tolerated, with a low early-death rate and short duration of pancytopenia. The clinical response toward DCAG motivated us to investigate further for biomar-kers of response and prognosis.
The spectrum of frequent mutations in the AML patients of our study is similar to that reported for other
large AML populations.27 Of the 72 identified genes, 10
genes in our study were mutated in >5% of the patients.
The two most commonly identified mutations in the
pre-sent study were in CEBPA (19.9%) and FLT3-ITD (16.1%), and then mutations in NRAS (13.0%), NPM1 (12.4%), DNMT3A (11.2%), ASXL1 (8.7%), and IDH2 (8.1%). The genes with a mutation frequency of >10% (CEBPA, FLT3-ITD, NPM1, and DNMT3A) were
simi-larly reported in studies by Lin et al27 and Mccurdy and
Levis.28Despite the prevalence of dozens of these
recur-rent mutations in AML, only NPM1, CEBPA, FLT3-ITD, and TP53 have been used in widely accepted
risk-stratification schemas, such as the NCCN guidelines.
The Fms-like tyrosine kinase 3 (FLT3) gene has been an important marker in acute myeloid leukemia, where FLT3
Figure 3Effects of genetic risk on survival in patients receiving IA chemotherapy. (AandB) Volcano plots of hazard ratios (in horizontal axis) and correspondingP-values (in
vertical axis) according to univariate analysis of the effect of individual genetic and clinical features on (A) OS and (B) EFS. Size of circles corresponds to the fraction of patients carrying indicated factors. Those that are significant (P<0.05) are annotated.
Abbreviations:IA: idarubicin plus cytarabine; HR; hazard ratios; NR: No response; NCCN: National Comprehensive Cancer Network; ECOG: Eastern Cooperative
Oncology Group. OS: overall survival; EFS: event free survival.
OncoTargets and Therapy downloaded from https://www.dovepress.com/ by 118.70.13.36 on 25-Aug-2020
mutations have been associated with clinical prognosis and
treatment.29–31Studies have found that survival for FLT3-ITD
AML is improved by allogeneic stem cell transplantation in
CR1.29–32In the present study, 9 FLT3-ITD-positive patients
in the DCAG group, and 9 FLT3-ITD-positive patients in the IA group, received allogeneic peripheral blood stem cell trans-plantation. In the DCAG group, mutations of FLT3-ITD were
identified as significantly associated with poor OS and poor
EFS. The outcomes associated with FLT3-ITD mutations in the DCAG group contrast with those of patients who received IA chemotherapy, in whom the presence of FLT3-ITD muta-tions had no effect on OS or EFS. As there are 15 patients with a FLT3-ITD mutation in the DCAG group and 11 in the IA group, more studies are warranted to verify our results.
In conclusion, the DCAG and IA induction chemotherapy groups were statistically similar with regard to complete
remis-sion rate after the first cycle, OS, and EFS. However, after
the second cycle, the complete remission rate of the DCAG group was significantly lower than that of the IA reference. The DCAG regimen was well tolerated, with a low early-death rate and short duration of pancytopenia. Clinical sequencing pro-vides important information for accurate prognostication in patients. Recommendations for chemotherapy should be based on both molecular mutations and clinical features.
Acknowledgments
This work was partially supported by grants from the Beijing Nova Program (2011114), the National Natural Science Foundation of China (Nos. 81770203, 30971297, 81102242, 81000221, 81270610, 81470010, 81170518, 81370666, and 90919044), the Beijing Natural Science Foundation of China
(No. 7102147, 7172200, and 7132217), the Capital’s Funds
for Health Improvement and Research (No. 2016-1-4082), and Hainan Provincial Natural Science Foundation of China (818MS157).
Disclosure
The authors report no conflicts of interest in this work.
References
1. Dou L, Zheng D, Li J, et al. Methylation-mediated repression of microRNA-143 enhances MLL-AF4 oncogene expression.Oncogene. 2012;31:507–517. doi:10.1038/onc.2011.248
2. Dou L, Li J, Zheng D, et al. MicroRNA-142-3p inhibits cell proliferation in human acute lymphoblastic leukemia by targeting the MLL-AF4 oncogene.
Mol Biol Rep.2013;40:6811–6819. doi:10.1007/s11033-013-2798-6 3. Dou L, Li J, Zheng D, et al. MicroRNA-205 downregulates
mixed-lineage-AF4 oncogene expression in acute lymphoblastic leukemia.Onco Targets Ther.2013;2013:1153–1160.
4. Attar EC, Johnson JL, Amrein PC, et al. Bortezomib added to daunor-ubicin and cytarabine during induction therapy and to intermediate-dose cytarabine for consolidation in patients with previously untreated acute myeloid leukemia age 60 to 75 years: CALGB (Alliance) study 10502.
J Clin Oncol.2013;31:923. doi:10.1200/JCO.2013.49.0219
5. Bowen DT. Etiology of acute myeloid leukemia in the elderly.Semin Hematol.2006;43:82–88. doi:10.1053/j.seminhematol.2006.01.005 6. Cashen AF, Schiller GJ, O’Donnell MR, Dipersio JF. Multicenter,
phase II study of decitabine for the first-line treatment of older patients with acute myeloid leukemia. J Clin Oncol. 2010;28:556–561. doi:10.1200/JCO.2009.23.9178
7. Fenaux P, Mufti GJ, Hellstrom-Lindberg E, et al. Azacitidine prolongs overall survival compared with conventional care regimens in elderly patients with low bone marrow blast count acute myeloid leukemia.
J Clin Oncol.2010;28:562–569. doi:10.1200/JCO.2009.23.8329 8. Welch JS, Petti AA, Miller CA, et al. TP53 and decitabine in acute
myeloid leukemia and myelodysplastic syndromes.N Engl J Med. 2016;375:2023–2036. doi:10.1056/NEJMoa1605949
9. Estey EH. Epigenetics in clinical practice: the examples of azaciti-dine and decitabine in myelodysplasia and acute myeloid leukemia.
Leukemia.2013;27:1803–1812. doi:10.1038/leu.2013.173
10. Ferrara F, Musto P. Hypomethylating agents for the treatment of acute myeloid leukemia in the elderly. Cancer. 2011;117:3879–3881. doi:10.1002/cncr.25934
11. Goodyear O, Agathanggelou A, Novitzkybasso I, et al. Induction of a CD8+ T-cell response to the MAGE cancer testis antigen by combined treatment with azacitidine and sodium valproate in patients with acute myeloid leukemia and myelodysplasia. Blood. 2010;116:1908. doi:10.1182/blood-2009-11-249474
12. Kantarjian HM, Thomas XG, Dmoszynska A, et al. Multicenter, randomized, open-label, phase III trial of decitabine versus patient choice, with physician advice, of either supportive care or low-dose cytarabine for the treatment of older patients with newly diagnosed acute myeloid leukemia. J Clin Oncol. 2012;30:2670–2677. doi:10.1200/JCO.2011.38.9429
13. Craddock C, Houlton AE, Quek LS, et al. Outcome of azacitidine therapy in acute myeloid leukemia is not improved by concurrent vorinostat therapy but is predicted by a diagnostic molecular signature.Clin Cancer Res.2017;23:6430–6440. doi:10.1158/1078-0432.CCR-17-1423
14. Yu J, Jin X, Wang L, et al. Decitabine-based chemotherapy followed by haploidentical lymphocyte infusion improves the effectiveness in elderly patients with acute myeloid leukemia.Oncotarget.2017;8:53654. 15. Zheng R, Xie B, Wang C, Yu B, Xu J, Tan H. D-CAG (decitabine
followed by cytarabine, aclarubicin, and G-CSF) for relapsed acute myeloid leukemia after hematopoietic cell transplantation. Ann Hematol.2016;95:157–159. doi:10.1007/s00277-015-2505-x 16. Song LX, Xu L, Li X, et al. Clinical outcome of treatment with
a combined regimen of decitabine and aclacinomycin/cytarabine for patients with refractory acute myeloid leukemia. Ann Hematol. 2012;91:1879. doi:10.1007/s00277-012-1550-y
17. Chang CK, Zhao YS, Xu F, et al. TP53 mutations predict decitabine-induced complete responses in patients with myelodysplastic syn-dromes.Br J Haematol.2017;176:600. doi:10.1111/bjh.14455 18. Takahashi K, Patel K, Buesoramos C, et al. Clinical implications of
TP53 mutations in myelodysplastic syndromes treated with hypomethy-lating agents.Oncotarget.2016;7:14172. doi:10.18632/oncotarget.7290 19. Metzeler KH, Walker A, Geyer S, et al. DNMT3A mutations and response to the hypomethylating agent decitabine in acute mye-loid leukemia. Leukemia. 2012;26:1106. doi:10.1038/leu.201 1.342
20. Bejar R, Lord A, Stevenson K, et al. TET2 mutations predict response to hypomethylating agents in myelodysplastic syndrome patients.
Blood.2014;124:2705–2712. doi:10.1182/blood-2014-06-582809 21. Jung SH, Kim YJ, Yim SH, et al. Somatic mutations predict outcomes of
hypomethylating therapy in patients with myelodysplastic syndrome.
Oncotarget.2016;7:55264–55275. doi:10.18632/oncotarget.10526
OncoTargets and Therapy downloaded from https://www.dovepress.com/ by 118.70.13.36 on 25-Aug-2020
22. Lh VDH, Berger G, Diepstra A, Huls G, Vellenga E. Overexpression of TP53 is associated with poor survival, but not with reduced response to hypomethylating agents in older patients with acute myeloid leukaemia.Br J Haematol.2017;178:810–812.
23. Dinardo CD, Patel KP, Garciamanero G, et al. Lack of association of IDH1, IDH2, and DNMT3A mutations with outcome in older patients with AML treated with hypomethylating agents. Leuk Lymphoma. 2014;55:1925–1929. doi:10.3109/10428194.2013.855309
24. Yan P, Frankhouser D, Murphy M, et al. Genome-wide methylation profiling in decitabine-treated patients with acute myeloid leukemia.
Blood.2012;120:2466–2474. doi:10.1182/blood-2012-05-429175 25. Hiller JK, Schmoor C, Gaidzik VI, et al. Evaluating the impact of
genetic and epigenetic aberrations on survival and response in acute myeloid leukemia patients receiving epigenetic therapy. Ann Hematol.2017;96:559. doi:10.1007/s00277-017-3116-5
26. Ritchie EK, Feldman EJ, Christos PJ, et al. Decitabine in patients with newly diagnosed and relapsed acute myeloid leukemia. Leuk Lymphoma.2013;54:2003–2007. doi:10.3109/10428194.2012.762093 27. Lin PH, Li HY, Fan SC, et al. A targeted next-generation sequencing in
the molecular risk stratification of adult acute myeloid leukemia: implica-tions for clinical practice.Cancer Med.2017;6. doi:10.1002/cam4.969
28. Mccurdy SR, Levis MJ. Emerging molecular predictive and prognos-tic factors in acute myeloid leukemia. Leuk Lymphoma. 2017;59:1–19.
29. Kar SA, Jankowska A, Makishima H, et al. Spliceosomal gene mutations are frequent events in the diverse mutational spectrum of chronic myelomonocytic leukemia but largely absent in juvenile myelomonocytic leukemia. Haematologica. 2013;98:107–113. doi:10.3324/haematol.2012.064048
30. Makishima H, Visconte V, Sakaguchi H, et al. Mutations in the spliceo-some machinery, a novel and ubiquitous pathway in leukemogenesis.
Blood.2012;119:3203. doi:10.1182/blood-2011-10-388512
31. Kihara R, Nagata Y, Kiyoi H, et al. Comprehensive analysis of genetic alterations and their prognostic impacts in adult acute mye-loid leukemia patients.Leukemia.2014;28:1586–1595. doi:10.1038/ leu.2014.55
32. Ohgami RS, Ma L, Merker JD, et al. Next-generation sequencing of acute myeloid leukemia identifies the significance of TP53, U2AF1, ASXL1, and TET2 mutations. Mod Pathol. 2015;28:706–714. doi:10.1038/modpathol.2014.160
OncoTargets and Therapy
Dove
press
Publish your work in this journal
OncoTargets and Therapy is an international, peer-reviewed, open access journal focusing on the pathological basis of all cancers, potential targets for therapy and treatment protocols employed to improve the management of cancer patients. The journal also focuses on the impact of management programs and new therapeutic
agents and protocols on patient perspectives such as quality of life, adherence and satisfaction. The manuscript management system is completely online and includes a very quick and fair peer-review system, which is all easy to use. Visit http://www.dovepress.com/ testimonials.php to read real quotes from published authors.
Submit your manuscript here:https://www.dovepress.com/oncotargets-and-therapy-journal
OncoTargets and Therapy downloaded from https://www.dovepress.com/ by 118.70.13.36 on 25-Aug-2020