141
Volume LX 15 Number 4, 2012
IMPLEMENTATION OF EVA INDICATOR IN
VALUE BASED REMUNERATION SYSTEM IN
SMALL AND MEDIUM-SIZED ENTERPRISES
M. Jakubcová, A. Fedorová
Received: February 20, 2012
Abstract
JAKUBCOVÁ, M., FEDOROVÁ, A.: Implementation of EVA indicator in value based remuneration system in small and medium-sized enterprises. Acta univ. agric. et silvic. Mendel. Brun., 2012, LX, No. 4, pp. 141–154 A value based remuneration system can be ranked among the modern remuneration systems. The value based remuneration systems focus their attention on the interconnection of the personal objectives of employees with the objectives of owners. Such an aim can be accomplished by meticulously selected evaluation quantities. A presented article concentrates on the economic value added quantity. This topic was a subject of an undertaken research within the framework of the Internal Grant Agency of the Faculty of Business and Management, the partial objective of which was to acquire the information on the value based remuneration systems applied in the small and medium-sized enterprises situated in the South-Moravia region. Selected research results are presented in the submitted article. The investigation research outputs enriched and completed a literary background research and together with the secondary research results facilitated the formulation of pre-requisites appropriate for the value based remuneration system application in the remuneration schemes of the small and medium-sized enterprises. On the basis of the formulation of these pre-requisites the article describes the EVA indicator implementation progress steps in the value based remuneration system and, subsequently, an employee value based remuneration model with the indicator of the economic value added is introduced.
Economic Value Added, remuneration, value based systems of remuneration, bonus, company goal
Riegler (2002) considers the value based remuneration systems as the modern remuneration systems, the aim of which is to guarantee the company employees more money funds by setting of higher and higher value for the owners. The value formation for the owners can be achieved in case of the concordance between the objectives of owners and company employees. According to the experts Kaplan and Norton (2000), Remeš (2004), Young (2001), Wagner (2003) etc., a crucial pre-requisite for the achieving of such consensus is the profi t sharing in harmony with the share of owners and employees in the reaching of the strategic objectives. As a metric for the meeting of the company strategic objectives and creation of the values can be considered the indicator of the economic value added (“EVA”). Nevertheless, according to Remeš (2008), the EVA indicator reported its low application in the fi eld
remuneration system application (compared to the other remuneration system approaches) corresponds with 4.79 % (Staňková, 2007). As Remeš (2008) quotes, the value based systems are being frequently rejected especially because of the fear of radical modifi cations of the classical accounting to the economic model, which becomes the base for the calculation of the value indicators.
The value indicators play an important role also in the fi eld of an employee motivation. They represent an eff ective stimulation tool, the task of which is to harmonize personal measures, controlling the activities of employees, with the value measures in such a way to encourage the motivation of employees with the aim to improve their effi ciency and achieve the objectives as specifi ed by the company (Riegler 2002, Staňková 2009, Tomšík 2005). Riegler (2002) and Staňková (2007) consider paid premiums, bonuses or shares and share options as the most frequently applied remuneration methods in the value based remuneration systems. Mentioned remuneration methods are oriented to the interests of the owner with a long-term eff ect.
Nevertheless, the authors point out that not every metric is advisable for the value based remuneration system. Should the value based remuneration system become an appropriate motivation tool, a considerable attention should be devoted to the value indicator selection. The indicator must be necessarily derived from the company value. An important condition for the company value increasing is the necessity to connect the indicator with the strategy applied to the whole company and other partial company strategies, namely the motivation strategy. Mutual links and interconnection of the value indicator and all strategies both in the horizontal and vertical company level should result in the accomplishment of goals, defi ned by the company. E.g., a pointed connection of the value indicator with the motivation strategy should result in the improvement of the motivation eff ect on employees, thus the behavior of employees will be deliberately infl uenced, mainly by the achieved level of the evaluating quantity. Out of a.m. results that the employees will endeavor to reach the highest possible value. As evident, the link between the work evaluation system and the remuneration system is very strong.
As mentioned above, this article directs its attention to the value based remuneration as an important and eff ective tool of the value management, a tool, that is rather new and not explored comprehensively in the conditions of the Czech Republic, especially with the impact on the fi eld of employee motivation in the company practice in foreground with EVA indicator. The objective of this article is to describe the process of the EVA indicator introduction into the value based remuneration system and to design the employee remuneration model on the basis of the EVA indicator in the environment of a small and medium-sized enterprises.
METHODS
In order to fulfi ll the objective, which is defi ned in the text above, the methods based on the logical thinking, i.e. the analysis and synthesis, induction and deduction, and so-called empirical methods are applied in the submitted article.
A major attention is focused on the value based remuneration systems used in the small and medium-sized enterprises situated in the South-Moravia region. The EVA indicator application in the companies, using the value based remuneration systems, is studied.
The empirical methods, described in the article, are supported by the mathematical statistics, endorsed by the probability theory. The task of the mathematical statistics is to analyze the data gathered by the statistical fi le investigation, and, subsequently, to apply the analysis conclusions to the whole basic fi le, i.e. so-called statistical induction (Hendel, 2004).
The tests of mutual dependency of selected variables by means of a chi-squared test are completed in the article. The testing works with the factually measured frequencies of the combinations of the values of the individual variables, observed in each unit of the statistical fi le, and with theoretical frequencies. The test applies the Pearson’s probability distribution. The signifi cance level 5 % was used for the testing. A test null hypothesis then anticipates no statistically important dependency among monitored variables. The results of the implemented tests were generated with the use of the so ware XLStatistics.
Furthermore, the hypotheses on parameter p of binomial distribution are examined in the article based on the factually measured frequencies. The testing of an unknown proportion p anticipates its equality to a certain factual value p0. The null hypothesis expresses the equality between the parameter p and parameter p0 and the alternative hypothesis then p = p0 and the alternative hypothesis then rejects the null hypothesis, i.e. can be expressed as p ≠ p0, or can be formulated as a sharp inequality, either p > p0 or p < p0. The test of hypothesis on parameter p of binomial distribution anticipates a suffi ciently large sampling. The test criterion value is considered for the large universe n > 30. The null hypothesis acceptance interval is identifi ed as I0 = <−u1−/2; u1−/2>, where u1−/2 is (1 − /2)- a quantile of normal distribution, with
Presentation of results of performed own research in the fi eld of employee remuneration in small and medium-sized
enterprises of the south-moravia region
The remuneration belongs to an important activity of the human resource management, supporting the labor force forming, employee development, social relations, corporate culture development and infl uencing the communication among employers, employees and trade unions. An applied remuneration value plays an important role in the communication, aff ecting a desirable behavior of the employees. Therefore, the remuneration systems should be transparent, fair and simple and should take into consideration executed work and should support both short-term and long-term performance (Armstrong, 2002; Remeš, 2008).
An eff ective and effi cient remuneration system should be motivating and should maintain a permanent interest of the existing valuable employees in their job position and less eff ective employees should be motivated to show better work outcomes. The system should be simple, communicative in all work levels, fair and objective (Vávrová, 2004).
Based on this reason variously oriented value based remuneration systems were established during the course of the time. The selection and development of the remuneration system is, however, a very complicated process, which must be harmonized with the company strategic objective. Its creation is infl uenced by a broad spectrum of factors, which must be identifi ed, monitored and their impact must be taken into account (Čadil, 2006).
In order to acquire information on the factors of the income aff ecting the company remuneration systems, on applied remuneration systems, provided employee benefi ts, frequencies of salary changes and their percentage amount, developmental trends and their infl uence over the remuneration system, taking into account the needs of employees, mutual interconnection between the remuneration systems and complete corporate strategy and the importance of performance indicators in the formation of remuneration systems a research study1 was carried out (in the period from June to November 2007) by means of a questionnaire investigation in the
segment of the small and medium-sized enterprises operating in the South-Moravia region (hereina er also in the text referred to as “Research 2007”). The questionnaire addressed totally 475 companies and the plan was to address people responsible for the company human resource management. A questionnaire rate of return amounted to 12.63 %.
The results of research indicated that in the questionnaire research participated according to the:
• legal form 46 companies with limited liability, 4 joint stock companies and 6 private entrepreneurs doing business in compliance with the trade law, • size of the company 10 micro, 43 small and 7
medium-sized enterprises (see Tab. I),
• classifi cation of economical activities with the highest rate of 36.67 % of companies involved in the business activity. Tab. II shows the representation of other companies according to the fi eld of activity.
Collected data identifying the companies became the cornerstone of the statistical hypothesis testing of the mutual dependence among the company size and the value based remuneration system application (Staňková, 2007). The null hypothesis claims the mutual independence among the company size and value based remuneration system application. From the chi-square test summarized results, presented in the Tab. III, we can say that the company size does not mutually depend on the value based remuneration systems.
The null hypothesis validity was confi rmed by the follow-up testing – i.e. the industry, in which the company is active, does not correlate with the value based remuneration system application, with 95 % probability. The null hypothesis verifi cation is proved by the testing criterion value, being lower than a critical value, displayed in the Tab. IV (Staňková, 2010).
The results of Research 2007 further indicated that a main criterion, infl uencing the salary settlement, was the acquired knowledge and skills of the individual employees, in 85 % companies.
A program of company effi ciency management, applied by 75 % respondents, can be considered as the most frequently applied remuneration system. Moreover, ca. 50.85 % of companies focused on the
I: Classifi cation of companies according to their size
Company size Number of companies Share of companies
Micro-company – 1 to 9 employees 10 16.66 %
Small company – 10 to 49 employees 43 71.67 %
Medium-sized company – 50 to 249 employees 7 11.67 %
Source: Staňková, 2010, p. 475
so-called internal audits. 11.86 % of the respondents applied the value based remuneration system.
On the basis of randomly conducted personal interview in these 7 companies the fact was confi rmed that the value based remuneration system, constituted on the economic value added indicator, was applied in 1 company. In compliance with these collected frequencies the test of the null hypothesis H was carried-out: p = p0 and anticipated, with the signifi cance level 0.05, the establishment of the conditions for the value based remuneration system application in 14 % of companies. The null hypothesis was formulated as H: p = 0.14, alternative hypothesis: p ≠ 0.14 and acceptance interval: I0 = I0 = <−u0.975; u0.975>, i.e. I0 = <−1.96; 1.96>. The value of test criterion was calculated in the sum of −0.52. This value belongs into the interval of the null hypothesis I0 acceptance; therefore, the null hypothesis is not rejected. The assumption of 14 %
companies with the established conditions for the value based remuneration system was confi rmed. Identically, the testing proved (signifi cance level 0.05) that the conditions for the value based remuneration system, based on the economic value added indicator, can be established in 50 % of the small and medium-sized enterprises. The value of test statistics in the level −1.89, belonging into the fi eld of the null hypothesis acceptance expressed by the interval I0 = <−2.447; 2.447>, proves it. The null hypothesis H: p = p0 anticipated (signifi cance level 0.05) the possibility of the establishment of the conditions for the value based remuneration system based on the economic value added indicator for 50 % of the small and medium-sized enterprises. The null hypothesis expressed p = 0.50 and alternative hypothesis p ≠ 0.50. The acceptance interval was expressed as I0 = <−u0.975; u0.975>, i.e. I0 = <−2.447; 2.447>. The Student’s t-distribution quantile was II: Classifi cation of companies according to the fi eld of activity according to the classifi cation of economic activities
Prevailing fi eld of activity according to the classifi cation of economic activities companiesShare of
Agriculture, forestry and fi shing 1.67 %
Processing industry 18.33 %
Construction 10.00 %
Trade; repair of motor vehicles and products for personal need and prevailingly for household 20.00 %
Accommodation and food service activities 6.67 %
Transportation, storage and post, courier activities, telecommunications and other communications 8.33 %
Financial activities 1.67 %
Activities in real estates and rental; business activities 36.67 % Public administration and defense; compulsory social security 1.67 %
Education 3.33 %
Human health and social work activities; veterinary activity 5.00 %
Other public, social and personal services 8.33 %
Source: Staňková, 2007
III: Summary results of the hypothesis chi-square test – mutual dependence among company size and value based remuneration system application
Analysis of r x c tables; (Pearson) Chi-square Test; (For independence of V and H) H0: Variables are independent (no interaction between variables)
H1: Variables are dependent (interaction between variables)
Chi-square 3.261903269
DF 2
p-value = 5.99
Source: Staňková, 2010, p. 479
IV: Summary results of the chi-square hypothesis on mutual correlation between the industry and value based remuneration system application Analysis of r x c tables; (Pearson) Chi-square Test; (For independence of V and H)
H0: Variables are independent (no interaction between variables) H1: Variables are dependent (interaction between variables)
Chi-square 13.81452140
DF 11
p-value = 19.7
applied as it represented a small universe. The null hypothesis is accepted.
Besides above mentioned facts the Research 2007 further reported that approximately 76.67 % companies most usually contributed to the catering together with the employer-paid development and education programs, and 73.33 % of companies professional background. Only 13.79 % of companies confi rmed to take into account the interests and needs of their employees in their remuneration systems. 52.73 % of companies change the salaries of their employees once a year, 45.61 % of companies without any plan, 33.33 % of companies biannually and 22.64 % of companies quarterly. In the moment of the salary change 28.33 % of companies increase the salaries of their employees approximately for 4 to 6 % and 15 % of companies in average from 7 to 9 %. The remuneration system establishment is infl uenced (as reported 89.83 % of companies) by the developing knowledge and skills of employees and according to72.88 % of companies by the increasing level of the performance bonuses paid especially to the managers. As negative result can be considered the fact that only 44.83 % of companies link their remuneration system to the company strategy. 17.89 % of companies answered a questionnaire open ended question, focusing on the most frequently used metrics for the remuneration of their employees, as applying the indicators derived from the achieved knowledge, experience, skill, abilities for the remuneration and 14.74 % of companies the indicators based on the performance and effi ciency as well as the results of quality of work and conscientious work.
Preconditions of EVA indicator implementation into value based
remuneration system
Riegler (2002), Staňková (2009), Remeš (2008) and Vacík (2004a, 2004b) assert that the training of managers as well as employees is essential prior to the introduction of the motivation system based on the EVA indicator. Primarily, the managers must master the value management principles, later also employees, whom the remuneration on the base of the EVA relates to.
A new system, using the EVA, must shape the identical thinking of all groups interested in the EVA indicator, coming out from the feeling of the consigned assets ownership. Such a transfer to the system of thinking of managers and other company employees and owners focuses on the company value improvement as its primary objective. The tasks of managers and other company employees are known from the company strategic management from the past. These tasks must concentrate on a newly outlined company objective, i.e. the introduction of the EVA indicator value into the company fi nancial management, and the unifi cation of the relevant diff erences of views of managers and other company employees and partners on the EVA indicator and from it derived partial indicators.
An adequate communication of defi ned company objective and specifi ed strategy is essential for the EVA indicator implementation into the system of management and remuneration. This can be guaranteed e.g. by means of the information systems, within the framework of which both company employees and owners could track the results of monitored indicators hand in hand with the topicality of necessary information in decision-making processes.
As the company will pass to the system of management and remuneration based on the EVA indicator, i.e. will convert to the value management and the interest of employees, the thinking over the organizational changes, guaranteeing the formation of such conditions resulting in the factual infl uencing of selected indicator of its components, will be necessary. The organizational changes will concentrate on the transition from the company geographical structure to the technological and product units as well as on the transfer to well-arranged cost structure with the possibility of the evaluation of results of both groups and individual employees (Remeš, 2008).
Such changes will highlight the necessity of the company managerial process modifi cations. According to the experience of companies introducing the value based motivation program (e.g. GiTy, a.s.), certain principles must be adhered to, such as not to complicate too much the modifi cations of values of current accounting, to pay more attention rather to the selection of decisive factors infl uencing the EVA and which, at the same time, the employees can infl uence, and, last but not least, the company information system in its program equipment must be adopted to the new system.
Basic progress steps of EVA indicator implementation into value based
remuneration system
EVA = NOPAT −(C × WACC). (1) The quantity NOPAT represents Net Operating Profi t A er Taxes, the quantity C represents Capital, which is an overall capital volume bound in the assets, utilized for the main business activity, and the quantity WACC represents Weighted Average Cost of Capital.
Provided that the value of indicator is EVA > 0, it means that the capital return is higher than its price; the company forms the value for its owners. Provided that the indicator value amounts to zero, the revenue covered only the costs linked with its formation; provided that EVA < 0, the company generated the revenue lower than costs, thus “destroys” the value for its owner.
Damodaran (2006), Pantea (2008), Zalai (2007), Dluhošová (2006), and others are involved in the EVA indicator calculation. It is an internally defi ned company performance indicator, according to the microeconomic theory based on the category of economic profi t. The concept EVA dates back to the early 1990s in the USA, and was developed by the advisory company Stern Stewart & Co (Pettit, 2000).
In order to be able to apply the EVA indicator into the value based remuneration systems, the indicator must be used, as stated above, in the company management system. An essential prerequisite for the value based remuneration system establishment on the grounds of EVA is, primarily, to take into account vision, mission and company strategy in its defi nition. The EVA indicator must link the measurement and company performance management with the remuneration system of employees and support the increasing of the company performance with its development. The remuneration system, with the EVA indicator at the head, should strengthen the faith in its application. It means to overcome the fears of modern approaches and radical modifi cations prior to the indicator value calculation itself, should connect the interests of the company owners with the interests of company employees and, last but not least, should come out from net accounting data, which must be transformed into the managerial informational system (Staňková, 2009 and Vacík, 2004b).
The EVA indicator application into the value based remuneration system is implemented in the following two progress steps.
• Progress step No. 1 – introduction of the EVA indicator to the management system means:
1. Amendment of standard accounting data to managerial data
– according to Maříková and Mařík (2001) more than 160 corrections of the income from operations, forming the base for the quantity NOPAT calculation, can be made. To modify its standard accounting data to the managerial data each company must follow its business activity and data reported in the fi nancial reporting. The objective of such modifi cations – according to the authors and the couple of Mařík (2001) – is not only
to support the decision resulting in the company value increase, but also to eliminate distortion caused by the legal accounting procedures, to depict factual structure of fi nancing by the modifi cation of the item “not identifi ed” in the balance sheet and, last but not least, to identify operating assets and with them linked costs and revenues. Stern and Deimler (2006) say that the modifi cations, which the companies implement in the accounting data, can be classifi ed by the operative, fi nancing, tax and ownership fi elds.
The company income from operations must be modifi ed with all non-operating costs and revenues in the operative fi eld, i.e. those which in reality do not serve for the guaranteeing of the main economic activity. Identically, the company property, shown in the balance sheet but not used for the business activity, must be adjusted.
In the fi eld of fi nancing the precise defi nition of sources used for the business activity fi nancing must be formulated. It means that the value of sources reported in the balance sheet must be completed with all sources used for the fi nancing.
The tax fi eld refl ects the changes in the elimination of the external fi nancing tax eff ects based on the fact that the external fi nancing should be taken into consideration only in the capital costs. These are mainly the tax distortion elimination from the leasing installments and other tax favorable forms of fi nancing.
The accounting data modifi cations in the items of the equity capital are infl uenced by the changes of assets in the balance sheet. These are mainly modifi cations in the company intangible assets, such as research and development expenses, marketing research, gained goodwill, etc., which are not considered as costs, but investment, gradually amortized in the form of depreciation. Such modifi cations will relatively stabilize NOPAT as the indicator will not be burdened by the nonrecurring costs. The modifi cations will infl uence the sum of reported assets in the balance sheet. Such assets must be valued with regard to the market prices, and the equity capital value will be modifi ed identically.
Maříková and Mařík (2001) recommend 5 to 10 key modifi cations to be carried-out in the practice. As the most frequent modifi cations we can consider: • improvement of the operating results of the activity with the interested paid, including the implicit interests included in the leasing installments, • increasing of the net operating assets with the asset
value fi nanced by the fi nancial leasing,
• decreasing of the net operating assets with the fi nancial investments, not linked with the main business activity,
• decreasing of the net operative assets with the unfi nished investments, not used for the formation of current results at the moment, • elimination of random items of non-recurring
or e.g. extraordinary depreciation of the property from the income from operations,
• adjustment of the income from operations with any increase or decrease of adjusting items for stocks and claims,
• decreasing of the income from operations with the yields from assets not used for the operation.
2. Identifi cation of costs for capital
– specifi ed by an accumulated value of the individual costs for the capital provision. Under the term “individual costs for the capital” are considered costs for foreign funds (rd) and equity capital (re). The costs for foreign funds represent an interest paid to the creditors for its providing. A tax rate identifi es the factual sum of the costs for the foreign funds. This is based on the fact that the paid interest represents a tax recognized item, decreasing the tax base. Based on this reason the cost of foreign interested funds is the interest decreased with the interest tax shield.
The equity capital costs are specifi ed by the costs of preference shares, costs of ordinary shares and costs of retained profi t. To specify the preference share costs we can follow the model of the dividend capitalization of the preference share market price. The ordinary share costs can be deduced from the dividend model of the ordinary share market price, or the capital asset pricing model (CAPM) can be used for their identifi cation and the costs of the retained profi t can represent (on the basis of an alternative theory of costs) the price of the equity capital adjusted with the emission costs (Head, 2008 and Mařík et al., 2007).
Based on the fact that the company accumulates the capital from various sources and maintains the capital in various forms, the company total capital costs are defi ned by the weight arithmetic average of costs of the individual costs upon the capital acquisition and their share to the total capital (C) according to the formula (2) (Kislingerová, 2001): WACC = [rd * (D/C)] + [re * (E/C)]. (2)
The quantity D expresses the foreign fund volume and the quantity E the volume of equity capital. Rehman (2010) is involved in the WACC calculation in his article.
3. Periods for the EVA indicator monitoring
– for the purposes of the value based remuneration systems the authors recommend calculating of the EVA indicator once in three months. The recommendation comes out from the results of Research 2007 and from the conclusions of Janda (2004). An annual calculation and evaluation of the metrics for the specifi cation of the employee bonus represent too long period of time to apply necessary measures resulting in the better development of the employees. This negatively infl uences the development of motivation of the employees to reach the objectives specifi ed by the company (Staňková, 2007; Janda, 2004).
Provided that the EVA is calculated in time intervals shorter than 1 year, according to Remeš (2008) the following steps can be taken:
• quantity NOPAT is quantifi ed similarly to the calculation of the annual indicator with the diff erence that it will be calculated from yields and costs related only to the particular period with taking the taxes in account,
• quantity WACC can be considered – for a simplifi cation – in the sum of costs for the capital specifi ed in the beginning of the accounting period multiplied by the share of the number of days of monitored period with the number of days of the accounting period,
• from simplifi ed point of view the quantity C can be expressed again as the asset value expressed in the beginning of the accounting period.
4. Defi nition of the fi elds of the EVA indicator calculation
– the concept EVA can be also applied to the levels of the partial parts of the company. The EVA calculation derives from the number of the organizational units, company organizational structure, character of company activity or individual work posts in the company, or any other views. An important starting point for the identifi cation of the individual points of view is that the sum of the individual input quantities of the EVA must equal to the EVA value for the whole company. This principle applies also to other input quantities of the EVA calculation, when the sum of the individual quantities must equal to the particular quantity for the whole company (Remeš, 2008).
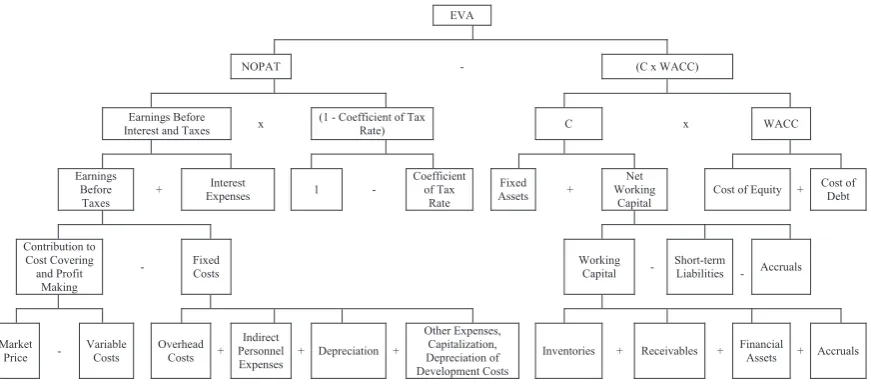
5. Identifi cation of the key factors infl uencing the EVA indicator level
– a continuous monitoring of selected partial factors, infl uencing the individual factors aff ecting the EVA indicator, should be the part of the eff ective process of management. These factors can be identifi ed by the decomposition of the EVA indicator presented in the Fig. 1. Various decompositions of the EVA indicator can be found e.g. in the sources Kislingerová (2001) and Zalai (2007).
The EVA indicator calculation comes out from the formula (1). The EVA indicator decomposition enables to monitor not only the extent of the activity of the individual elements upon the company performance growth, but also facilitates to identify the key factors infl uencing the individual elements more easily, thus the whole EVA, and, last but not least, the indicator EVA decomposition becomes the starting point for the establishment of the value based remuneration systems.
• Progress step No. 2 – establishment of the value based remuneration system
behavior of employee, his/her evaluation and the sum of remuneration variable component, to which such an employee is entitled to. From the above mentioned results the need of the identifi cation of the appropriate performance measures, which will signifi cantly connect the activities of such employee with the company value. Unless such measures are identifi ed, the cost increase could occur without the improvement of the motivation eff ect on the employees.
The establishment of value based remuneration system based on the EVA must clearly come out from the EVA decomposition and must defi ne not only the salary structure, but also functions and salary tariff s, or possibly any other employee levels, according to the organizational structure and calculation and bonus payment. On the basis of the results of Research 2007 and Janda (2004) the authors recommend linking of the remuneration
system not only to annual, but also quarterly reported value of the EVA indicator in the form of a bonus.
Construction of value based remuneration system based on the EVA in small and medium-sized
enterprises
The proposal of the value based remuneration system model is designed for small and medium-sized enterprises. Fig. 2 depicts a model example of the organizational structure to support the proposal of the value based remuneration system, in the basic arrangement of the individual work posts and in the classifi cation according to the employment level2.
The developed value based remuneration system model is based on the EVA indicator and comes out from the EVA decomposition as presented in the Fig. 1. The model must defi ne not only the salary
EVA
NOPAT - (C x WACC)
Earnings Before
Interest and Taxes x (1 - Coefficient of Tax Rate) C x WACC
Earnings Before
Taxes +
Interest
Expenses 1 -
Coefficient of Tax
Rate
Fixed
Assets +
Net Working
Capital Cost of Equity +
Cost of Debt
Contribution to Cost Covering and Profit
Making
- Fixed Costs Working Capital - Short-term Liabilities - Accruals
Market
Price - Variable Costs Overhead Costs + Indirect Personnel
Expenses + Depreciation +
Other Expenses, Capitalization, Depreciation of Development Costs
Inventories + Receivables + Financial Assets + Accruals
1: Decomposition of the EVA indicator according to the individual factors Source: own
1. employment level
2. employment level
Staff of section B
Staff of
section C Staff of economic section
Company director
Product A - production section
Product B- production section
Product C -
production Economic section manager
Admini strator
Staff of partial section A
Staff of partial section A
Staff of partial section A
2: A model example of organizational structure in the classification according the employment level Source: own
structure, i.e. remuneration on the basis of the EVA indicator, but also roles and salary tariff levels according to the organizational structure (who is remunerated on the basis of the EVA) and must identify the bonus (calculation and payment).
Roles and salary tariff s levels according to the organizational structure
The details of the remuneration system on the basis of the EVA indicator will be specifi ed in the internal directive of the company, or labor, collective or any other contract following the identifi cation of the category of employees involved in such remuneration. The proposed model suggests the payment of bonus to all categories of the company employees on the basis of the company organizational arrangement and in harmony with the individual functional jobs.
Bonus
The principle of the remuneration system, focusing on the EVA, is in the fact that people are interested in the EVA maximization by means of the paid bonus, which is not paid unless the value for the company owners is enhanced. The core of this system consists of the payment of bonus only with the positive EVA generation. It means that the owners receive more than would be the profi t from the similar investment, and part of such surplus is distributed among the people as their bonus.
The main stimulus for the EVA increase is the high level of its regulation extent. The higher value of the EVA, the higher bonuses for the employees and more satisfi ed owners. In the proposed model the bonus represents the reward. The total volume of the bonus is derived from the reached total value of the EVA indicator for the company.
The computation of the total volume of bonus might follow the formula (3):
Total bonus = CEVA × EVAt + PEVA ×(EVAt− EVAt−1)+ + ZEVA × ((EVAt− EVA t−1) − ΔEVA) + CB. (3)
The quantity CEVA represents an optional percentage parameter for the total indicator EVA, PEVA expresses an optional percentage parameter for the EVA indicator increase and ZEVA an optional percentage parameter for the diff erence between the factual EVA increase and planned EVA increase. As EVAt is considered the EVA value in the monitored period for the company, as EVAt−1 the EVA value in the last period for the company and ΔEVA is the planned value of the EVA improvement in the monitored period for the company. The last quantity, identifi ed as CB, is so-called target bonus.
The computation indicates that proposed remuneration system, based on the EVA, remunerates the employees by the percentage from the reached EVA value, increased by the percentage of the EVA improvement, by the target bonus for the achieving of the EVA target value and by the percentage of the increase of the EVA
change, decreased with the planned improvement of this indicator. It is up to every company which quantities, identifi ed in the mentioned formula, will be applied for the bonus calculation in the remuneration system. The selection must be paid a proper attention based on the above mentioned reasons.
A quarterly interval of the bonus payment is recommended, provided that the EVA indicator is positive. Such recommendation is outlined based on the fact that the payment once a year, as it is a usual practice in the companies, does not actively involve employees in the every day process of the stimulation activity for the improvement of the company performance. To eliminate such defi ciency it is important to link the remuneration system with shorter periods. The bonus calculation is specifi ed in compliance with the research results of Staňková (2007) and recommendation of Janda (2004) for the period of three months with the aim to establish the optimal conditions for the eff ective stimulation of staff to reach the required results.
The deposit of the earned bonus – prior to its payment – to the so-called bonus bank is advantageous. Remeš (2008) explains that it is a bank serving exclusively for the purposes of the monitored fi nancial means for the remuneration payment on the basis of the value based EVA indicator. The funds, deposited in the bank, are partially allocated to the company employees under the conditions stipulated in advance. Their remaining part does not have to be deposited in the bank; the company can use them further for the fi nancing of its operations. Thus, it represents a cheap source of the company property fi nancing. Another advantage is that the employees will be paid higher part of the bonus despite the deterioration of the positive EVA indicator. In the situation with the negative EVA value – and its improvement in the meantime – a sort of the motivational reserve for the employees will be deposited in the bonus bank to refl ect the changes of the improved EVA indicator. All these provisions result in the long-term interest of the employees in the loyalty to the company. The bonus must be paid only with reached positive value of the EVA indicator so as to satisfy the motivational eff ect of this remuneration system.
Only a proportional part, identifi ed by the company in harmony with its needs, is paid from the bonus bank. The proposed model suggests the payment of 1/3 total (cumulated residual) value of the earned bonus registered in the bonus bank (BBB). Such one third forms the bonus for all company employees. Such proportional part will be then paid to the company employees with respect to their work posts (employment level).
were specifi ed according to the organizational structure as presented in the Fig. 2. A value 1 was assigned to the fi rst employment level, a value 2 to the second employment level.
The weight of function of the particular tariff level (employment level) (VFi) enables to identify the sum of bonus falling on one average employee (BP1zam) according to the formula (4):
BP1zam= BBB / ∑(VFi× PZi). (4) The indicator PZi represents the quantity of employees working in the tariff level of the monitored weight. The value of defi ned bonus sum per one average employee (BP1zam) facilitates – a er its multiplication by the relevant weight of the function, in which the employee is classifi ed (VFkzam) - the identifi cation of factually paid bonus (formula (5) to the particular employee (VBkzam).
VBkzam = BP1zam × VFkzam. (5) Above mentioned remuneration system can be considered as advantageous based on the fact that the EVA indicator unifi es not only the interests of owners and employees, but also the concerns among the employees themselves. It means that the main principle of the motivation, based on the above mentioned computation, is the interest of employees in the EVA value maximization. Out of it results that such a system should enhance the co-operation among the individual functions of the employees with the aim to provide the highest contribution. The individuals will build a co-operating team, as the bonus of the indicator EVA comes out from the EVA value for the whole company.
To encourage the motivation of people in the EVA increase the mentioned computation can be linked with the complementary parameters, e.g. volume indicators, or subjective assessment from manager (hereina er referred to as “plan fulfi llment indicator”). Each such indicator should be selected in relation to the employee, his/her ability to directly infl uence the monitored indicator. The bonus sum would then depend on the percentage of fulfi llment of such indicator.
The computation of factually paid bonus should be then adjusted with the indicator fulfi llment coeffi cient (fi le of indicators), which an employee can directly infl uence (U) into the following form (6): VBkzam=(BP1zam * VFkzam) × U. (6) The selection of the plan fulfi llment indicator must comply with the identifi ed defi ciencies of the key factors aff ecting the indicator EVA sum. As the key parameter of the plan fulfi llment for the employees in the fi rst level can be specifi ed a maximal possible value of the variable costs derived from planned receipts.
An indicator EBIT can be specifi ed for the employees in the second level. The selection of this
indicator is given by the fact that the employees in the second level are employees of the administration and management. The responsibility of these people is not only to co-ordinate the activities of the lower employment level to reach the measures for them defi ned, but they themselves must be involved in the fulfi llment of the partial results leading to the corporate objective. In such a case it is an indicator of the economic result from the operations prior to the cost interests and taxes. From the indicator EVA decomposition (see Fig. 1) it is a quantity hierarchically set to the higher branch of the whole tree. It is essential to acknowledge that these people must participate in the improvement of (not only) the contribution to the fi x cost fi nancing and profi t generation, but also in the decreasing of the fi x cost value and search for the appropriate forms of the external credited fi nancing.
DISCUSSION
The questionnaire research in the category of small and medium-sized enterprises of the South-Moravia region (Staňková, 2007) showed that most frequently the companies (75 %) apply the effi ciency management control in the remuneration systems. Only seven companies apply the value based remuneration system, out of them one based on the EVA indicator. Furthermore, the questionnaire investigation results were used for the testing of hypotheses on the mutual dependence between the value based remuneration system and size of company or its industry. A mutual independence of monitored features was confi rmed with 95 % probability in both cases. Real frequencies were also used for the testing of hypotheses on parameter p binomial distribution. It was proved that in 14 % of companies were established conditions for the application of the value based remuneration systems, and that in 50 % of small and medium-sized enterprises the conditions for the utilization of the value based remuneration systems based on the EVA indicator can be established. Pavelková (2005) and Remeš (2008) testify the possibilities of the EVA indicator applicability in the remuneration system.
Consequently, Janda (2004) recommends the period of three months as the most appropriate duration for the specifi cation of motivation bonuses.
As regards the salary raise, the salaries can be increased both by an absolute sum and a percentage from the base pay. More advantageous is the percentage relation as it supports the maintaining of the company salary system stability (Urban, 2007). According to the authors, the salary increase sum should be derived from the specifi c features of each company, and should take into account disposable fi nancial funds defi ned for the salary payment. While specifying the frequency and salary increase rate an added value of every employee should be taken into account, i.e. the salary increase rate should minimally correspond with the rate of the increase of added value generated by the particular employee. The companies must monitor whether their labor costs – in the eff ort to motivate their employees – do not start to rise without any control.
The results of Research 2007 also point at the insuffi cient linking of the company strategy with the remuneration system. According to Vávrová (2004), such a defi ciency must be eliminated to be able to defi ne the individual partial strategies. Another defi ciency was noted in the fi eld of taking of the needs of employees into the consideration. Only 13.79 % of companies stated to refl ect the needs of employees in their remuneration systems. According to Čadil (2006), Staňková (2009) and Urban (2007), many companies think to have an appropriate motivation environment for their employees. Generally, the employers tend to determine the need of their employees. Many times they do not respect the needs of their employees, which – in the worst cases – can result in the loss of their best staff , thus the infl uencing of the future development of their company. Therefore, the establishment of the remuneration systems refl ecting mainly needs and wishes of the employees with respect to their work behavior and results is crucial. The measures for the employee motivation improvement could lie in the categorization of employees and selection of an appropriate stimulation tool. The remuneration based on the EVA indicator can represent such stimulation tool. A precondition for the EVA implementation into the remuneration system is the introduction of the EVA indicator into the company management. The understanding of the EVA indicator concept in the company by its users is essential, thus facilitating the transfer to the system of thinking of company employees as well as its owners focusing on the company value improvement. Other indicators – besides the EVA indicator – can be used in the value based remuneration systems as well. According to Ruthner (2003), both internally identifi ed indicators and capital market oriented indicators can be used in the value based remuneration systems. The capital market oriented indicators are consistently derived from the company objectives. They refl ect the expectations of investors as regards the company
value and are clearly measurable. They express the company stock exchange value, i.e. externally quantifi ed indicator. In the fi eld of remuneration it can be applied as a long-term remuneration component. Its principal disadvantage is that its application into the value based remuneration systems must take into account a strong correlation with the capital market. This fact causes a random oscillation of the indicator, having no link with the behavior of the employees. Based on this reason in the application of the capital market oriented indicators into the remuneration system the employees demand high bonuses corresponding with the high level of uncertainty and risk, especially in a short-term assessment for a certain period.
Internally specifi ed indicators can be applied in the remuneration systems as well. They come out from the company calculations. They are quantifi ed on the basis of the company calculations. They are advisable for a short-term assessment for a certain period. Usually they are closely linked with the company value. They facilitate a derivation of the short-term measures from this long-term target indicator. The internally specifi ed indicators facilitate the congruence of all company objectives (Ruther, 2003). As the company value is calculated by the discounting in the future expected and by the risk burdened indicators, which can never be forecasted with certainty, the selection of company target indicator must be paid a special attention (Riegler, 2002; Ruther, 2003). As mentioned above, the internally specifi ed EVA indicator is selected for the remuneration model proposed in the submitted article.
The application of the EVA indicator in the value based remuneration system will be facilitated by an appropriately selected company informational system, which will be able to process – without any major impacts – the input data for the EVA indicator computation, thus eliminating, as states Remeš (2008), its low application level in the corporate practice. The EVA indicator application into the company practice can be facilitated by the guideline of the individual progress steps of the conversion of the accounting data to managerial data. Staňková, Režňáková and Beranová (2010) are involved in this particular issue in their publication.
In spite of the fact that e.g. Remeš (2008) indicates the advisability of the value based remuneration system implementation for the highest employee level, i.e. the level of management, prevailingly because of the decreasing causal link of the working activities with the company value, the submitted article proposes the involvement of all company staff in the EVA indicator improvement.
fulfi llment indicator. On the basis of the procedures, defi ned in advance, the calculated bonus can be tied to the fulfi llment of e.g. extensive indicator. The suggested model presents the possibility to pay the employee, assigned to the fi rst employee level, the calculated bonus in compliance with the plan fulfi llment indicator, defi ned in advance, presented in the decomposition of the indicator EVA, on the variable cost base. In case of the bonus calculation for the particular employment posts an indicator, which the employees in the particular employment level can infl uence directly, can be applied; therefore, it does not have to be the indicator directly refl ected in the EVA indicator decomposition, but it can be its partial quantity. As also the agriculture companies participated in the Research 2007, we can mention the examples of such partial quantity in this specifi c group of companies, e.g. for the workshop staff the indicator of costs spent to the spare part consumption, fuel storage staff the indicator of the sum of savings of fuel consumption, mechanization means staff the volume of services rendered to the external subjects. In the vegetable production sector the employees might be involved in the volume indicator of mowed hectares or mowed tons of harvested crop, sowed or ploughed up hectares of soil, also with respect to the services provided by them externally. The employees in the livestock production could be rewarded on the basis of the livestock growth volume. The livestock growth volume means e.g. the sum of produced kilograms of animals in the monitored period.
As regards the technical-administrative staff and other management, the accumulation of savings can be monitored (e.g. telephone costs, internet, property insurance, business subject etc.), as well as the proposals for the innovations (e.g. in the fi eld of the compliance with the technical – economic standards, quality performance provision, extension of operations, administrative agenda management etc.).
As previously mentioned, the involvement of the management staff in the indicators, presented in the indicator EVA decomposition, is advantageous. The employees should become aware of the fact that they themselves are responsible for the communication and creation of the correct ways of the achievement of defi ned objectives.
Finally, the authors of the article can refer to the existing possibility of the EVA indicator application in the remuneration systems. By means of the EVA indicator, applied in the remuneration system, the employees can be motivated in the quest of the connection of the behavior of employees in accordance with the objectives, defi ned by the company owners, through the variable remuneration depending on the value based indicators. It is rather new and unexplored fi eld in the Czech conditions. For that reason an undivided attention should be paid to this fi eld and should be subject to various research studies in order to support the establishment of the methods contributing to the company value maximization.
SUMMARY
The article focuses on the remuneration of the employees with the accent on the value based remuneration systems with the EVA indicator at the head.
The objective of the article was to describe the process of the EVA indicator implementation into the value based remuneration system and to introduce the model of the employee remuneration applying the EVA indicator in the environment of small and medium-sized enterprises. In order to accomplish this particular objective the submitted article came out not only from the knowledge, acquired by the secondary research, but also from the primary research data. The primary research was pursued by way of the investigation questionnaire. The results, yielded by the investigation questionnaire, were further assessed both by the application of Microso Offi ce Excel and so ware XLStatistics – to verify the existence of mutual dependences of selected variables – but also by means of the test statistic calculation for the testing of hypotheses on the parameter p binomial distribution. So-called paired methods based on the logical thinking, i.e. analysis and synthesis, induction and deduction, and so-called empirical methods were applied for the article writing.
Acknowledgement
The article is the part of the project Knowledge Development for Information Support Improvement of Company Economic Management fi nanced by the Internal Grant Agency of the Brno University of Education with the registration No. FP-S-11-1.
REFERENCES
ARMSTRONG, M., 2002: Human Resource Management. Prague: Grada Publishing, a. s., 856 p. ISBN 80-247-0469-2, (in Czech).
ČADIL, H., 2006: Formulation of Motivating and Stimulating. Prague: Controller-Institut, 130 slides, (in Czech).
DAMODARAN, A., 2006: Damodaran on Valuation. Security Analysis for Investment and Corporate Finance. 2nd ed. USA: John Wiley & Sons, 685 p. ISBN 0-471-75121-9, (in English).
DLUHOŠOVÁ, D., 2006: Financial Management and Company Decision-Making. 1st ed. Prague: Ekopress, s. r. o., 191 p. ISBN 80-86119-58-0, (in Czech). HEAD, T., 2008: CAPM: theory, advantages and
disadvantages. Student Accountant, F9, pp. 50–52. Available: <http://www2.accaglobal.com/pubs/ students/publications/student_accountant/ archive/sa_jj08_head.pdf> (October 2011), (in English).
HENDEL, J., 2004: Overview of Statistical Methods of Data Processing. Prague: Portál, 584 p. ISBN 80-7178-820-1, (in Czech).
KAPLAN, R. S., NORTON, D. P., 2000: Balanced Scorecard. A Strategic System of Company Performance Effi ciency Measurement. Prague: Management Press, 267 p. ISBN 80-7261-032-5, (in Czech).
KISLINGEROVÁ, E., 2001: Company Valuation. 2nd ed. Prague: C.H.Beck, 367 p. ISBN 80-7179-526-1, (in Czech).
MAŘÍK, M. et al., 2007: Company Valuation Methods. Valuation Process – Basic Methods and Procedures. 2nd ed. Prague: Ekopress, s.r.o., 492 p. ISBN 978-80-86929-32-3, (in Czech).
MAŘÍKOVÁ, P., MAŘÍK, M., 2001: Modern Methods of Company Performance Evaluation and Company Valuation. 1st ed. Prague: Ekopress, s.r.o., 70 p. ISBN 80-86119-36-X, (in Czech).
PANTEA, M. I., 2008: The Managerial Performances Evaluation through the Economic Value Added. European Research Studies, 4, No. 11, pp. 83–100. Available: <http://search.proquest.com/docview /89157562/13249B7A42D4BEDAEDC/3?accoun tid=17115> (October 2011), (in English).
PAVELKOVÁ, D., 2005: Concepts of Measurement and Company Effi ciency Management and Application in Practice. (A specialized seminar to the project GA ČR 402/03/0555). Zlín: Tomáš Baťa University in Zlín, Faculty of Management and Economics, Institute of Financing and Accounting. 28 slides. Available: <web.fame.utb.cz/cs/docs/2_Koncepty_ rizeni_vykonnosti.ppt> (August 2011), (in Czech). PETTIT, J., 2000: EVA & Strategy. New York:
STERN STEWART & Co. Available: <http://
www.sternstewart.com/research/studies.aspx> (October 2007), (in Czech).
REHMAN, R., 2010: Weighted Average Cost of Capital (WACC) Traditional Vs New Approach for Calculating the Value of Firm. International Research Journal of Finance and Economics, 45, pp. 7–9. ISSN 1450-2887. Available: <http://www. eurojournals.com/IRJFE%20issue%2045.htm> (September 2011), (in English).
REMEŠ, D., 2008: Improvement of Company Performance with Application of Interconnection of Concepts of Balanced Scorecard and Economic Value Added. [PhD Thesis] Zlín: Tomáš Baťa University in Zlín, Faculty of Management and Economics, (in Czech). RIEGLER, CH., 2002: Value Based Remuneration
Systems. Controller News – Czech, 8, pp. 5–7. ISSN 1214-5149, (in Czech).
RUTHNER, R., 2003: Criteria of Establishment of Value Based Remuneration Systems. Controller News – Czech, 9, pp. 16–17. ISSN 1214-5149, (in Czech).
STAŇKOVÁ, M., 2007: Application of Company Value Management in Human Resource Management. A fi nal report to the project of the Internal Grant Agency of the Faculty of Business and Management. 42 p. Available in the Science and Research Department of the Faculty of Business and Management, Brno University of Technology, (in Czech).
STAŇKOVÁ, M., 2009: Possibilities of Value Management Principles for Remuneration System Establishment. [PhD Thesis] Brno: Brno University of Technology, Faculty of Business and Management, (in Czech). STAŇKOVÁ, M., 2010: An Analysis of Remuneration
Systems in Small and Medium-Sized Enterprises. Acta univ. agric. et silvic. Mendelianae Brunensis, 58, No. 6, 473–482. ISSN 1211-8516, (in Czech). STAŇKOVÁ, M., REŽŇÁKOVÁ, M., BERANOVÁ,
M., 2010: Selected Modifi cations of Accounting Data for the EVA Indicator Calculation and Their Impact to the Individual Items of Financial Statements. Trends of Economics and Management, 7, No. 4, pp. 57–66. ISSN 1802-8527, (in Czech). STERN, C. W., DEIMLER, M. S., 2006: The Boston
Consulting Group on Strategy. New York: John Wiley and Sons, (in English).
TOMŠÍK, P., 2005: Theory of Motivation and Remuneration for Human Resource Management. Brno: PEF Mendel University in Brno, 105 p. ISBN 80-7157-845-2, (in Czech).
URBAN, J., 2007: Remuneration and Motivation of Individual Categories of Employees. Prague: VOX, a. s., 32 p., (in Czech).
Activities. Economics and Management, 3, pp. 81–89. ISSN 1212-3609, (in Czech).
VACÍK, E., 2004b: Measurement of Effi ciency of Business Projects and Companies, Methods and Approaches for Company Management Based on Monitoring of Value Increase (Value Based Management). Pilsen: University of West Bohemia, Faculty of Economics, 53 p. Available: <http://www.kip.zcu.cz/kursy/SM/ index2002.htm> (December 2007), (in Czech). VÁVROVÁ, V., 2004: A Strategic Management
Practice. Trends for Management, 47, No. 6, p. 373. Available: <http://www.automatizace.cz/article. php?a=139> (August 2011), (in Czech).
WAGNER, J., 2003: Strategic Measurement of Effi ciency and Information Support. CEFIUS:
Occasional periodical of the Financial and Accounting Studies Centre of the Faculty of Financing and Accounting. Prague: The University of Economics. Available: <http://nb.vse.cz/fak1/cefius/Obcasnik4/ obcasnik4.htm> (January 2008), (in Czech). YOUNG, S. D., O’BYRNE, S. F., 2001: EVA and value
based management: a practical guide to implementation. New York: McGraw Hill, 493 p. ISBN 0-07-136439-0, (in English).
ZALAI, K. et al., 2007: A Company Financial-Economic Analysis. Bratislava: SPRINT vfra, 358 p. ISBN 978-80-89085-74-1, (in Slovak).
Adress