United Kingdom Vol. VI, Issue 4, April 2018
Licensed under Creative Common Page 585
http://ijecm.co.uk/
ISSN 2348 0386
THE ECONOMICS OF SEARCH ENGINE VISIBILITY AND ITS RELATION TO
BRAND PERCEPTION: IMPLICATIONS FOR LEBANESE CONSUMERS
Bassam Hamdar
Faculty of Business and Economics, Department of Economics,
American University of Science and Technology, Lebanon
bhamdar@aust.edu.lb
Ehab Aridi
Faculty of Business and Economics, MBA program,
American University of Science and Technology, Beirut, Lebanon
Rawad Mroueh
Faculty of Business and Economics, MBA program,
American University of Science and Technology, Beirut, Lebanon
Abstract
In the digital era brands are competing to gain as much visibility as possible across digital channels. One of the main digital channels is organic search. It’s the go-to place for consumers who are searching for information on goods or services prior to making a purchase decision. In this paper a sample of 132 consumers living in Lebanon was conducted on their perception of search engine results, and how such results relate to brand perception, and economic demand of the products or services appearing in search engine result pages. Based on the survey responses a positive relation between search engine visibility and brand perception on one hand, and search engine visibility and economic demand on the other hand could be established. Moreover, a correlation between brand perception and economic demand was detected, which means that searchers who correlate search engine visibility with brand perception also correlate it with economic demand.
Licensed under Creative Common Page 586 INTRODUCTION
The relationship between people and the internet has gone through many phases. In its early
days, the internet was mostly used by researchers, education departments, and government
entities. The development of technology regarding easy and efficient browsing, and the release
of computer user friendly operating systems, i.e. windows 98 led to a period of enormous growth
that attracted businesses into the internet arena. Eventually, many free services such as free
webpages and chat rooms started being available on the net, and which were led by advertising
revenue. This made the internet more accessible and attractive to general users or consumers.
As more attention was given to security matters by leading computer and internet vendors, more
people felt comfortable using the internet and more content was poured into the World Wide
Web (WWW) (Leiner et al. 1997).
The huge amount of information available on the web gave the internet the potential of
being a source of information and knowledge, not only a means for communication. In order to
fulfill this potential, a new approach for browsing the internet had to come into place. This new
approach was based on an engine that crawls the content of the World Wide Web using bots
programmed for that specific purpose. As search engines gained popularity they were able to
generate revenue from advertisers. This eventually led to further growth and investment in the
algorithms and search capabilities of search engines (Benkler, 2006).
The first web robot was created soon after the launch of the internet in 1993, while the
first commercial search engine was launched in 1995 (Excite). Meanwhile, Yahoo became
popular as a paid website directory before introducing its search features at the end of the
millennium. Not long after, Google emerged as a game changer when its founders Sergey Penn
and Larry Page patented an algorithm called PageRank. The PageRank algorithm, created at
Stanford University, was based on a voting-like system where web links were classified and
weighted based on popularity and relevance. The algorithm quickly attracted the attention of leading sites including Yahoo!, which allowed Google to power the site‟s search results.
Eventually, Google became the most popular search engine worldwide and had developed
algorithm to fight web spam and manipulation of search engine results (Lee, 2012).
The exponential growth of content on the net and the advancement in the capability of
search engines to provide users with information relevant to their needs, coupled with the
emergence of the mobile era were people no more need a desktop or a laptop to use the web,
made search engines the go-to place for users to look for information and products, and where
Licensed under Creative Common Page 587
As per the Internet World Stats, in 2016 internet usage in Lebanon has reached 75.9% of the
population. This high usage rate makes it viable to study how Lebanese consumers perceive
search engine results and how this perception can potentially affect brands (MOT, 2016).
LITERATURE REVIEW
The relationship between brand position and search engine visibility has been the subject of
many studies. Some researchers studied this relation from a perspective of search engine
marketing (Dou, Zhou, Lim, Cui and Su, 2010).The aim of the search engine marketing study
was to validate whether brands using search engine marketing, and allocating an advertisement
budget in order to gain more visibility on search engine result pages; are able to differentiate
themselves from other brands, and gain competitive advantage over them. A series of carefully
prepared experiments were conducted on select students, by which students were classified
according to their internet skill level. A conclusion was reached supported by statistical
evidence, that the order of search engine results did influence brand perception, moreover, it
was also concluded that when internet users were asked to search for brands along a particular
brand attribute, they were more likely to recognize an unknown brand, if it were displayed before
well-known brands in search engine result pages.
A study by Microsoft examined how people recognize, recall, and reuse search engine
results, in relation to the position of search engine results. The study concluded that highly
ranked results, and clicked results are more likely to be remembered than other type of results.
These results are related to the higher attention paid to higher results, which are the ones to be
clicked in most of the cases. This conclusion is in accordance with the “primacy effect‟ which is
a cognitive phenomenon, where the first items in a list are more memorable than others.
MOZ (MOZ is a service company based in Seattle that sells inbound marketing and
marketing analytics software subscriptions).the famous and well-known SEO(Search Engine
optimization) authority conducted an experiment across a brand, which has ranked consistently
for a number of keywords for no less than 12 months within a somehow obscure niche. They
directed would-be consumers to Google and requested that they search for the brand name and
subsequently click on the target brands homepage. The users were asked to navigate around
the site for at least two minutes, replicating how a user would interact; meanwhile, MOZ team
monitored the rankings of keywords that are related to the brand. The result showed that the
ranking of those keywords improved during the experiment period and dropped later on.
Although, this study looks at the relation from the perspective of search engines rather than
consumers, however, it shows that the relation between consumer behavior and search engine
Licensed under Creative Common Page 588
Unfortunately, it was difficult to find such studies conducted in Lebanon or the Mid-East area.
Thus, this paper is based on a sample of Lebanese residents which could be one of a few that
has been conducted on this particular topic.
RESEARCH METHODOLOGY
The data source for this analysis was solicited from a survey that was conducted based on 132
total responses. The survey is based on a five-point Likert scale for all opinion questions. The
questionnaire starts with a brief introduction which explains the purpose of the survey, the time
required completing it, the respect of confidentiality .Almost all possible options were given to
respondents in the questionnaire to make it more effective and effortless to complete.
Close-ended questions were used in the questionnaire in addition to scale and Likert scale.
Furthermore, the survey was made of four sections as follows. The first section solely focused
on the use of the internet and search engines in specific to search for products, and the way the
search engines are used. The second section‟s purpose was to overview how consumers
perceive the brands that appear on results of search engines. Section three showed whether or
not consumers are more likely to buy or contact the brands that appear on search engines. The
final section included the demographic questions of the respondents.
The sample used is based on Convenience Sampling; where members of the population
that are chosen are easily accessible. To sample friends, colleagues, or shoppers at a mall, are
all examples of convenience sampling.
The survey was converted into an Excel file that transformed every question into a
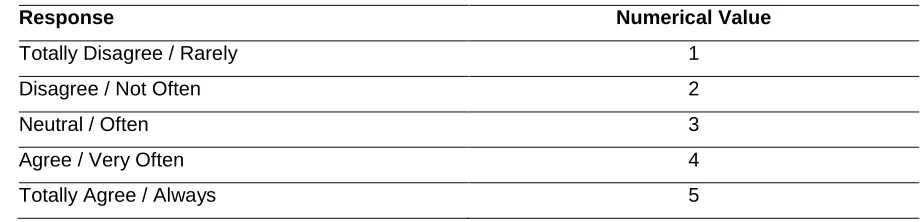
numerical value, which represents the Likert scale value selected by the respondents. The
questions of the survey were represented by numerical values as per the below tables:
Table 1 Scale Values
Response Numerical Value
Totally Disagree / Rarely 1
Disagree / Not Often 2
Neutral / Often 3
Agree / Very Often 4
Totally Agree / Always 5
The demographic questions had a different representation than the five-point scaled questions.
Licensed under Creative Common Page 589
Table 2 Gender Values
Gender Numerical Value
Male 1
Female 2
Table 3 Age Values
Age (Years) Numerical Value
Below 20 1
20-29 2
30-39 3
40-49 4
50 and above 5
Table 4 Area of Residence Values
Area of residence Numerical Value
Beirut 1
Mount Lebanon 2
Bekaa 3
North Lebanon 4
South Lebanon 5
Table 5 Education Level Values
Education Level Numerical Value
Some Schooling 1
High School 2
Bachelor‟s Degree 3
Higher Education 4
Table 6 Income Level Values
Income Level Numerical Value
Below 1,000$ 1
1001$ - 2000$ 2
2001$ - 4000$ 3
Licensed under Creative Common Page 590
The product type question was represented as follows:
Table 7 Product Type Values
Category Numerical Value
Selected 1
Not Selected 2
The final result is an excel file that represents all the questions numerically in such a way that
statistical analysis can be applied to the data obtained.
Demographic Data Characteristics
The demographic parameters of the used data have a great effect on the results; so it is vital to
generally describe these demographic characteristics in this section of the paper.
Gender Distribution
Figure1.Gender Distribution
Out of a total of 132 surveys filled out, 4 respondents didn‟t disclose their gender. 75% of the
respondents were males, and 25% were females. GENDER
Female Male
25%
Gender Distribution
Licensed under Creative Common Page 591 Age Distribution
Figure 2. Age Distribution
Out of a total of 132 surveys filled out, 6 respondents didn‟t disclose their Age. Therefore, the
majority of the respondents belong to the group of ages between twenty and twenty- nine years.
Area of Residence Distribution
Figure 3. Area of Residence Distribution
32%
4% 2%
0%
40-49 Above50
30-39
AGE
Below20 20-29
1% 1%
1% 25%
Age Distribution
72%
Residence Area
Distribution
62%
Beirut Mount Bekaa North South
Lebanon Lebanon Lebanon
Licensed under Creative Common Page 592
Out of a total of 132 surveys filled out, 7 respondents didn‟t disclose their residence area. Thus,
the majority of respondents (around 94%) reside is in Beirut and Mount Lebanon.
Education Distribution
Figure 4. Education Distribution
Out of a total of 132 surveys filled out, 8 respondents didn‟t disclose their education level. As a conclusion, the majority of respondents (around 71%) hold a Bachelor‟s degree.
Income Distribution
Figure 5. Income Distribution
18%
5% 5%
Education Distribution
71%
Some Schooling High School Bachelor's
Degree
Higher Education
EDUCATION
17%
9% 3%
Income Distribution
72%
LessThan1000 1001-2000 2001-4000 MoreThan
USD USD USD 4000USD
Licensed under Creative Common Page 593
Internet Searching Products Frequencies
41, 31%
35, 27%
33, 25%
15, 11%
8, 6%
Rarely Not often Often Very often Always
HOWOFTENDOYOUSEARCHFORPRODUCTSONTHEINTERNET?
Out of a total of 132 surveys filled out, 15 respondents didn‟t disclose their income level.
Therefore, the majority of respondents (around 72%) generate an income that is less than
$1000(USD) per month.
Descriptive Statistics
Figure 6.Internet And Search Engine Responses
The figure above shows the frequency distributions for the respondents i.e., whether they use
the internet to search for products or not. Moreover, the results show that 31% of the
respondents always use the internet to search. i.e., respondents on one side (form a total of
56% or 74 respondents) use the internet to find their specific products, on the other side, 17% of
Licensed under Creative Common Page 594 Search Engine Usage
Figure 7. Search Engine Usage
The frequencies for using search engines to search for products are shown above in the
histogram. 57% of the respondents use search engines to search for products, but 21% use
search engines (or not use them at all) for finding their products.
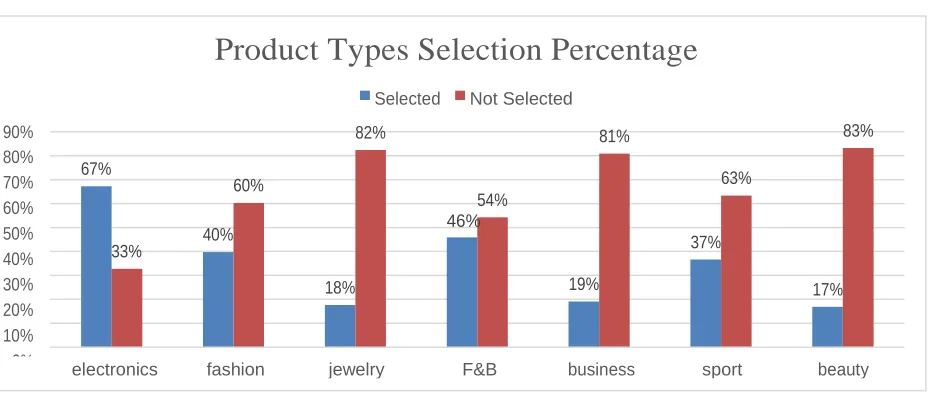
Product Type Distributions
Figure 8. Product Type Distributions HOWOFTENDOYOUUSESE'STOSEARCHFORPRODUCTSONTHEWEB?
Always Very often
Often Not often
Rarely
8 , 6%
20 , 15%
28 , 21%
32 , 24%
Using Search Engines Frequencies
44 ,33%
Product Types Selection Percentage
Selected Not Selected
90% 80% 70% 60% 50% 40% 30% 20% 10% 0%
82% 81% 83%
67%
60% 63%
54% 46% 40%
33% 37%
18% 19% 17%
Licensed under Creative Common Page 595
Taking into consideration that respondents had the choice to choose more than one product
type, it could be determined from the figure above that Electronics are the most searched
products on the search engines (67% of the sample size). Food and Beverage products comes
second by acquiring 46%, followed by Fashion and Sports products forming almost the same
percentage of being searched on the internet. The least searched product types are business
services, jewelry, and beauty products.
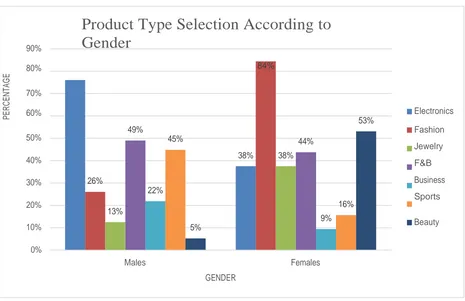
Searched Products Across Gender
Figure 9.Searched Products Across Gender
The product types being searched based on gender of the respondents are shown above i.e.,
that 76% of males search for Electronics compared to 38% of females. The significant category
that females search for is the Fashion products category, where 84% of females would search
for fashion products compared to 26% of males. Beauty products as well have a noticeable
difference between males and females. Only 5% of males would search for beauty products,
while 53% of females would do so. 90%
80%
Product Type Selection According to
Gender
84% 76% 70% 60% Electronics 53% 49%50% 45% 44%
40% 38% 38%
30% 26% 22% 20% 13% 16% Fashion Jewelry F&B Business Sports 9%
10% 5% Beauty
Licensed under Creative Common Page 596 Search Engine Results Trustworthiness
Figure 10.Search Engine Results Trustworthiness
The trustworthiness responses for search engines don‟t enforce the users to trust these
engines, where 50% of the sample size is neutral. The total of negative responses along with
the neutral would form 66% of the respondents, whereas only 34% would tend to trust search
engine results.
Statistical Analysis
The main hypothesis of whether a relation does exist between the following entities will be
tested:
A.
Search engine visibility and brand perceptionB.
Search engine visibility and economic demandC.
Brand perception and economic demandA correlation matrix using a statistical tool called MegaStat will be utilized.
The variables that represent brand perception are stated in the below table along with their
corresponding survey question:
Search Engine Results Trustworthiness Responses
6% 4% 12%
28%
50%
Licensed under Creative Common Page 597
Table 8. Brand Perception Variables Description
Survey Question Variable
Brands that appear on SERs are more trustworthy than those that don't appear on SERs?
Brand Trustworthiness
Brands that appear on SERs care more about their customers than those that don't appear on SERs? Brands that appear on SERs care more about their
customers than those that don't appear on SERs?
Care for Clients
Brands that appear on SERs are more prestigious than those that don't appear on SERs?
Brand Prestige
Brands that appear on SERs have a higher quality than those that don't appear on SERs?
Perceived Quality
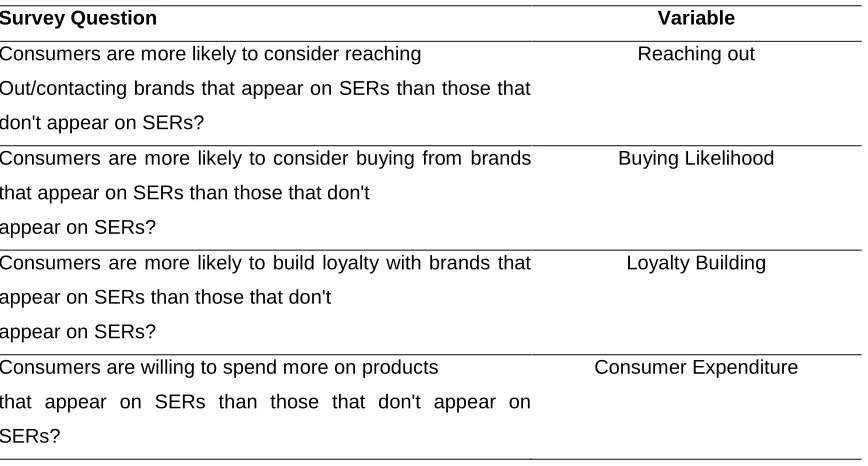
The below table highlights the variables that represent Economic demand along with their
corresponding survey question:
Table 9. Economic Demand Variables Description
Survey Question Variable
Consumers are more likely to consider reaching
Out/contacting brands that appear on SERs than those that don't appear on SERs?
Reaching out
Consumers are more likely to consider buying from brands that appear on SERs than those that don't
appear on SERs?
Buying Likelihood
Consumers are more likely to build loyalty with brands that appear on SERs than those that don't
appear on SERs?
Loyalty Building
Consumers are willing to spend more on products
that appear on SERs than those that don't appear on SERs?
Consumer Expenditure
As for the search engine visibility, it is considered in relation to all the above mentioned
variables, since the surveyed users were asked to give their opinion on each variable in relation
Licensed under Creative Common Page 598 Relation between Search Engine Visibility and Brand Perception
In order to test the notion of whether there is a correlation between search engine visibility and
brand perception, a score has been created for brand perception, which is the average of the
responses of the four variables related to brand perception as follows: Trustworthiness; care for
clients, brand prestige, and perceived quality. Based on the brand perception score the
following frequency table using MegaStat was created:
Table 10. Brand Perception Score Frequency Distribution
Brand Perception
Average Score cumulative
Lower upper midpoint width frequency percent frequency percent
1.50 < 2.00 1.75 0.50 4 3.0 4 3.0
2.00 < 2.50 2.25 0.50 17 12.9 21 15.9
2.50 < 3.00 2.75 0.50 17 12.9 38 28.8
3.00 < 3.50 3.25 0.50 42 31.8 80 60.6
3.50 < 4.00 3.75 0.50 39 29.5 119 90.2
4.00 < 4.50 4.25 0.50 9 6.8 128 97.0
4.50 < 5.00 4.75 0.50 0 0.0 128 97.0
5.00 < 5.50 5.25 0.50 4 3.0 132 100.0
132 100.0
Brand Perception Average Score
Figure 11.Brand Perception Average Score
35
Histogram
32
30
30
25
20
15 13 13
10 7
5 3 3
0
0
BRAND PERCEPTION AVERAGE SCORE
P
E
R
C
E
N
Licensed under Creative Common Page 599
The above frequency table indicates that the average score of brand perception variable is
above the average which is 3. Accordingly, the hypothesis that Average Brand Perception score
is greater than 3 i.e., Ha: Brand Perception Score >3 was tested. A t-test to validate the
hypothesis was used. Below is the obtained result.
Table 11. T-test Result for Average Brand Perception Score
Hypothesis Test: Mean vs. Hypothesized Value
3.00000 hypothesized value
3.14015 mean Brand Perception Average Score
0.66844 std. dev.
0.05818 std. error
132 n
131 df
2.41 t
.0087 p-value (one-tailed, upper)
From the t-test result, t-value is more than 2, which means that the assumption that average
score value is more than 3 is statistically significant. Accordingly, one can say that a positive
relation exists between search engine visibility and brand perception.
Relation between Search Engine Visibility and Economic Demand
A similar average score was created for economic demand variables which are: reaching out,
loyalty building, considering buying and expenditure. Based on the economic demand score the
following frequency table and histogram using were created.
Table 12. Economic Demand Score Frequency
Economic Demand Average Score cumulative
lower upper midpoint width frequency percent frequency percent
2.00 < 2.50 2.25 0.50 5 3.8 5 3.8
2.50 < 3.00 2.75 0.50 16 12.1 21 15.9
3.00 < 3.50 3.25 0.50 32 24.2 53 40.2
3.50 < 4.00 3.75 0.50 38 28.8 91 68.9
4.00 < 4.50 4.25 0.50 28 21.2 119 90.2
4.50 < 5.00 4.75 0.50 10 7.6 129 97.7
5.00 < 5.50 5.25 0.50 3 2.3 132 100.0
Licensed under Creative Common Page 600 Economic Demand Average Score
Figure 12. Economic Demand Average Score
A positive skewness regarding the average economic demand score was observed.
Accordingly, a similar t-test to validate the alternative hypothesis that average economic
demand is higher than 3, was conducted. The below table highlights the result of the t-test
performed.
Table 13. Hypothesis Test: Mean vs. Hypothesized Value
3.00000 hypothesized value
3.51515 mean Economic Demand Average Score
0.65364 std. dev.
0.05689 std. error
132 n
131 df
9.05 t
8.27E-16 p-value (one-tailed, upper)
Based on the utilized t-test, a statistically significant evidence that validates the alternative
hypothesis (Average Economic Demand Score is great than 3, Where t = 9.05). This means
that there is a relation between search engine visibility and economic demand.
Relation between Brand Perception and Economic Demand
Using MegaStat, a statistical tool based on Excel software, the below Correlation Matrix across
all variables considered in the study is obtained.
ECONOMICDEMANDAVERAGESCORE
2 8
4
12
21
20
10
0
Histogram
29 24
40
30
P
E
R
C
E
N
Licensed under Creative Common Page 601
Figure 13.Correlation Matrix Across All variables
.
MegaStat output is built in such a way that statistically significant results are highlighted in a
fancy color. In the case of the correlation matrix above, some values were highlighted in light
yellow, and others were highlighted in dark yellow. The ones highlighted in light yellow are
statistically significant at p = 0.05, where the critical value +/- 0.172, while the ones highlighted
in dark yellow are significant at p =0.01, where the critical value is +/-0.224.
Statistical Significance Values
Figure 14. Statistical Significance Values
Looking at the correlation matrix, it is found that a certain statistically significant relation exists
between variables related to brand perception, and variables related to economic demand or
consumer reaction. A correlation table is utilized for each brand perception across all other
Licensed under Creative Common Page 602
Table 14. Correlation Values Between “Prestige”, Brand Perception,
and Economic Demand Variables
Prestige
Prestige 1.000
Trustworthiness .214
Care .269
Quality .450
Reaching out .271
Consider Buying .279
Loyalty Building .207
Expenditure .254
Table 15. Correlation Values Between “Care”, Brand Perception,
and Economic Demand Variables
Care
Care 1.000
Prestige .269
Trustworthiness .152
Quality .272
Reaching out .273
Consider Buying .064
Loyalty Building .231
Expenditure .280
Table 16. Correlation Values Between “Quality”, Brand Perception,
and Economic Demand Variables
Quality
Quality 1.000
Care .272
Prestige .450
Trustworthiness .146
Reaching out .054
Consider Buying .378
Loyalty Building .281
Licensed under Creative Common Page 603
Table 17. Correlation Values Between “Quality”, Other Brand Perception,
and Economic Demand Variables
Trustworthiness
Trustworthiness 1.000
Care .152
Prestige .214
Quality .146
Reaching out .054
Consider Buying .159
Loyalty Building .111
Expenditure .048
Table 17 indicates that a statistically significant correlation exists between „prestige‟ and all
variables related to economic demand. In other words, those who believe that there is a relation
between search engine visibility and prestige are more likely to reach out to the brand building
loyalty, and more willing to buy and spend money on brand products.
A similar trend could be observed when examining „Customer care‟ variable in table15, except that no significant relation was observed between „Customer Care‟ and considering to
buy from the brand.
Regarding to quality (which is highlighted in table16),a correlation with all the variables
of economic demand, expect reaching out could be observed.
On the other hand, trustworthiness is the only brand perception variable that had no
significant statistical correlation with any of the variables related to economic demand as
highlighted in table17.
Finally, the correlation between average brand perception score, and average economic
demand score was tested, and a statistically significant relation which is given by R=0.486 as
Licensed under Creative Common Page 604
Table 18. Correlation Between Average Brand Perception Score,
and Average Economic Demand Score
Economic Demand Average Score
Brand Perception Average Score
Economic Demand Average
Score 1.000
Brand Perception Average Score .486 1.000
132 Sample size
± .171 Critical value .05 (two-tail)
± .223 Critical Value .01(two tail)
In order to further confirm the result, a t-test on the null hypothesis was performed (R=0), and
where score results were considered as two independent groups. The null hypothesis was
rejected as the below t-test result table shows. Thus, a relation exists.
Table 19. Hypothesis Test: Independent Groups (t-test, pooled variance)
Economic Demand Average Score
Brand Perception Average Score
3.5152 3.1402 mean
0.6536 0.6684 std. dev.
132 132 n
262 df
0.37500
difference (Economic Demand Average Score - Brand Perception Average Score)
0.43703 pooled variance
0.66108 pooled std. dev.
0.08137 standard error of difference
0 hypothesized difference
4.61 t
6.34E-06 p-value (two-tailed)
0.21477 confidence interval 95.% lower 0.53523 confidence interval 95.% upper
Licensed under Creative Common Page 605 CONCLUSION
The findings of this paper indicate a statistically significant relationship between search engine
visibility and brand perception on one hand, and search engine visibility and economic demand
on the other hand. Moreover, the statistical relation is stronger when it comes to economic
demand than brand perception. The paper also tested the relation between brand perception
variables and economic perception variables, and it was found that there is a positive relation
between all brand perception variables and economic demand variables, except for brand
trustworthiness which was not correlated with any of the economic demand variables. Finally, a
positive correlation between brand perception and economic demand was detected based on an
average score that was formulated for each.
RECOMMENDATIONS
Based on the findings of this paper the following recommendations are set to improve the
marketing and the profitability of Lebanese and non-Lebanese firms:
1- Business firms should optimize the internal and external aspects of their websites to
better position their products and services.
2- Business firms should consider search engine visibility as a tool to boost sales and
create positive brand perception.
3- Business firms should utilize search engine visibility and search engine optimization to
improve website ranking and market share expansion.
REFERENCES
Barry M. Leiner et al. (1997), A Brief History of the internet. (n.d.).Retrieved January 11, 2018,from http://www.walthowe.com/navnet/history.html
Benkler, Y. (2006). The Wealth of Networks: How Social Production Transforms Markets and Freedom. New Haven and London: Yale University Press. 528 pp.
Boulos,M. & Wheeler,S.(2007).The emerging Web 2.0 social software: an enabling suite of sociable technologies in health and health care education.Faculty of Health and Social Work, University of Plymouth, Drake Circus, Plymouth PL4 8AA, UK.
Dou, Lim, Su, Zhou, & Cui.(2010). Brand Positioning Strategy Using Search Engine Marketing. MIS Quarterly, 34(2), 261.Doi: 10.2307/20721427
Lebanon Internet Stats and Telecommunications Report. (2017). Retrieved December 13, 2018,from http://www.internetworldstats.com/me/lb.htm
Lee, T. (2012).History of the web. Retrieved November 29, 2108, from https://webfoundation.org/about/vision/History-of-the-web/
Ministry of telecommunications-MOT (2016).Lebanon Internet usage, broadband and telecommunications reports.Retrieved November 22,2108, from https://www.internetworldstats.com/me/lb.htm
Licensed under Creative Common Page 606 Teevan, J. (2008). How people recall, recognize, and reuse search results. ACM Transactions on Information Systems, 26(4), 1-27.doi:10.1145/1402256.1402258
The Rise of Search Engines (2016). A Brief History of the Web‟s Most Essential Tool. Retrieved October 27, 2018from http://www.copypress.com/blog/t