221
Classification Of Medical Image Data Using K
Nearest Neighbor And Finding The Optimal K
Value
Preeti Nair, Indu Kashyap
Abstract: Rapid developments made in data mining technologies has explored the growth of real time applications. In general, clustering and classification are the two important tasks used for understanding the hidden patterns of the data. One of the most widely employed algorithm is, k Nearest Neighbor (k NN) which serves better for any classification purpose. This paper proposes a finding of optimal k value using k NN on medical data. Initially, a set of medical images are collected from a public repository. The collected images composed of irrelevant noises, low contrast with degraded quality. Gaussian filtering is employed to reduce the noise with enhanced image quality. The contrast enhanced image is processed under morphological operations in segmentation process. Feature extraction process play a vital role for selecting the optimal k values. Using Gray Level Co-Occurrence Matrix (GLCM), the relevant features are estimated and selected. These selected features are given as input to k NN algorithm and obtains the optimal k value based on accuracy. For a possible set of data folds, the achieved optimal k value dictates the effectiveness of the research objectives.
Index Terms: Data mining, k NN, Image classification, optimal k value and Feature extraction.
—————————— ——————————
1.
INTRODUCTION
DUE to rapid development of internet technology, a voluminous amount of data has been generated and preserved at the databases. The prediction of data expansion by researchers is also been gained for period of time. The art of dealing with uncategorized (or) semi-categorized data is a challenging task due to its legitimate value. Deriving knowledge from these sorts of data often leads to poor decision making. Conventional decision making systems utilize human skills to analyze and interpret the data which consumes higher computational time and complexities. Thus, the intervention of computing technology has attracted several researchers in data mining field. Data mining is the field of collecting, extracting and deriving useful knowledge from variant pools of researchers. Several useful information (or) knowledge can be assessed from data mining technologies. Similarly, different researchers suggested number of mining tools and techniques to explore the hidden data patterns. Most of the techniques falls into the category of classification and clustering. One of the emerging technologies is, classification, which resolves all sorts of data mining issues concerned with prediction. Generally, the classification systems develop a model for prediction by class of an object on attributes basis. Here, the object defines customer, patient or any sole character whereas attributes defines details of an object like heart rate, pressure rate etc. The class refers to positive/ negative for specified objectives. It learns from training set and then develops a model. The k nearest neighbors (k NN) is an eminent data classification algorithm that requires number of instances in a dataset has to be mentioned earlier. Discovery of finding relevant classes for any dataset is always trial and error process. The performance of this classification algorithm may be degraded due to chosen value of k. Hence, a optimum set of k instances are required for accurate classification results. Likewise, the selected k value should be minimized than the number of objects in datasets.
The main contributions of this paper are as follows:
a) We observe the significance of medical images because of differentiating normal and abnormal cases. b) Feature extraction is an important step which determines the efficiency of the selected input images. Hence, GLCM features with efficient values are observed. c) The selected features are modelled to k NN
algorithm for selecting optimal k values.
The rest of the paper is organized as follows: Section II presents the related work; Section III presents the research methodology; Section IV presents the experimental analysis and finally, concludes in Section V.
2.
RELATED WORK
222
complexity. In [7] authors presented a non-negative multi-resolution model for image classification systems. Initially, wavelets coefficients of images are analyzed for textural classification. Lower dimensional basis of each texture degrades the convergence rate of the high-dimensional subspace. In [8] developed a non-negative correlation of the image classification. A non-negative correlation coding was framed from two representative models, namely, locality and similarity of the codes. Numerical solver was used for distinguishing the effectiveness of the method. The estimation of weights degrades the efficiency of the neighboring visual words. In [9] developed a hierarchical learning classifiers for plant species identification. Multi-task structural learning model that differentiates the inter and intra related classifiers to all nodes in a tree. By tree classifiers model, the effectiveness of large-scale models are identified. Loss function of tree classifiers slows down coarse grained data access control. In [10] presented a k NN algorithm for missing data imputation. Distance based classification model is introduced for missing data models. The authors proved that k closest values resolved the missing data issue. Accuracy estimation on unlabelled pattern downed by referring its neighbors. In [11], authors presented a k NN regression using tolerance intervals which resolved the data significance of the distributions. Confidence level of the data significance distributions poses security constraints. In [12], authors presented A- optimal projection for representing the images. It’s a linear regression model that resolved the low-sparse representations with higher parameter maximization. Neighboring algorithm for local probability centers [13] for each class which reduced the impact of negative contributing points. Query joining phase incurs higher computational costs for selecting optimal k values. The researchers in [14] studied about spatio temporal statistics for video quality assessment. With the help of Discrete Cosine Transform (DCT), the spatiotemporal features of the video input are gathered. The statistical prediction of video quality created different sorts of data distortions that exposes higher spatial and temporal frequencies. In [15] the authors presented a scene parsing model using MAP perspective in terms of posterior category based probability density functions and prior contextual PDF for every parsing result. Though, the results narrow down the super pixels analysis, the contextual information explored low discriminatory capability. Similar authors in [16] extended the analysis over deterministic column-based matrix decomposition for singular value model. Incremental learning of the reconstruction data demands irregularized data matrix. The analysis on video synopsis has regularized the data matrix in order to reduce collisions. But, the study on visual error has not focussed [17]. In [18] the authors discussed the k NN approach in detecting the poisoning level of rats during blood routine test. Glyphosate is one of the most eminent herbicides in variant commercial formulations. Feature extraction level stated correlated indices for all cells. Differentiation of white blood cells and red blood cells using k value collided the indices of the feature sets which makes higher system complexity. Significance of feature selection using fisher criterion and genetic optimization was studied by [19] stated that the
feature subsets reduced the complex candidate features. It helped to resolve the recognition performance but failed to reduce the false positive rate. The author [20] presented the effects of stemming strategies on Arabic documents. Most relevant features are selected from chi-square analysis and then fed into k NN classifiers. Findings presented that the k NN degraded performance due to its inability of handling high dimensional data. Decision support system was explored for scoliosis prognosis by [21]. Data based decision making using k NN is a tedious task due to higher mean squared error. The system explores inefficient data interpretation using k NN. Authors in [22] explored the ensemble of subset using variants of k NN classifiers. Ensembling classifiers on non-informative features of different datasets are collected and assessed for better performance. In [23] an exponential model to enhance the accuracy using different classifiers suggested combinational model for improving the applicability of the variant classifiers were studied. Metrics such as area under curve, f-measure, and specificity were measured with lowest predicted performance. Lower sensitivity and higher specificity degraded the k NN performance to real-time problems. The authors in [24] discussed how training data complexity affects the nearest-neighbors classifiers. It aimed to resolve the class overlapping, feature space dimensionality and the class density. Depends on boundary of class and feature space, the data complexity has interpreted. Anyhow, the class imbalance issue is not resolved using k NN systems. Automatic classification of the brain images using ANN, k NN and SVM classifiers were discussed in [25]. Principal Component Analysis (PCA) is widely used for selecting the relevant coefficients for better feature extraction process. Since the selection of k value is tedious, the symmetry and asymmetry points deviated the performance of the classes. In [26] the authors presented a differentially private nearest-neighbor classification for privacy protection in sensitive data. Sensitivity analysis done on different datasets and analyzed the importance of private attributes in order to reduce the marginal errors, conversion errors and instance queries. The authors in [27] studied the distance function effects on k nearest-neighbor classification for medical datasets. Variant distance function like Euclidean, cosine, Chi-square, and Minkowsky were studied. Chi-square is the best distance measure and proved by authors. Prediction error of k NN classifiers were not resolved class imbalance and sparsity.
3.
RESEARCH METHODOLOGY
This section presents the research methodology used in this study. The literature survey states that the k NN algorithm holds affectability issues like measuring the area and voting model for decision making degrades the sensitivity of the data. Variable selection is the critical point because it has predictive power of neighborhood selection k. This issues severely affects the performance of the system. The proposed model composes of five phases, namely
3.1 Data Collection
223
of the research objectives. A set of medical images related to brain tumor and breast cancer are been collected from a public dataset repository.
3.2 Data Preprocessing
This process assist to remove the irrelevant details of an image. Here, resizing sampling and Gaussian filtering are used for achieving better preprocessed image. Gaussian filters are the type of smoothing filters that operates on estimated weights with respect to Gaussian function. The Gaussian function in one dimension and the formula is given as
( ) ( ) (1)
The above equation (1), presents the smoothened images with significant noise reduction. The noiseless image is further enhanced by increasing the contrast level. By estimating the histogram of images, the possible gray levels is given as
( ) (2)
where is the aggregate pixel value to its gray level L to its total pixel value. Finally, an enhanced image with better noise reduction is further used for analysis purposes.
3.3 Data Segmentation
The contrast-enhanced image is then examined using morphological operations which is a kind of processing the images based on their shapes. Dilation and Erosion are the two fundamental morphological operations which operates in similar basis. Dilation inserts pixels to boundaries of an object whereas erosion eliminates the pixels on object boundaries.
a) Dilation: It helps to improve the visibility rate of an image. The maximum value of all pixels is the output pixels which is derived from pixels of neighborhood.
b) Erosion: It helps to remove the small objects. The minimum value of all pixels is the output pixels derived from neighboring pixels.
The analysis from dilation and erosion operations are then converted into binary image. From the binary image, the closer regions are detected using boundary box model. The boundary box of a binary image is given in eqn. 3.3.
( ) ∑ ∑* + * + (3)
where,
B = Pixels related to bounding box,
= Adjacent pixels related to bounding box, p and q are the indices of pixels.
Xp = label 0 for foreground and 1 for background.
Up= Encode preference for unary potentials.
Vpq= Pairwise analysis for smoothened image.
3.4 Feature Extraction
Rom the region detected image, Gray Level Co-occurrence Matrix (GLCM) is a matrix that depicts spatial distribution of gray levels in binary image. Each element (i,j) of the matrix is the number of occurrences of the pair of pixel with value i and a pixel with value j which are at a distance d relative to each other. The spatial relationship between two neighboring pixels can be specified in many ways with different offsets and angles, the default one being between a pixel and its immediate neighbor to its right. Here, the region detected segmented image is applied with GLCM. The selected features are explained as follows:
1) Contrast: It estimates the local variations i.e. sum of square variance. It is estimated from the below formula
∑
( ) (4) The pixel value i, j increases when contrast increases.
2) Correlation: The mentioned pixel pairs are then estimated using joint probabilities. It gives linear dependency of the gray levels of neighboring pixels. In general, it ranges from [-1,1] and the formula is given as
∑
(( )( )
√( )( )
)
(5)
3) Energy: It estimates the sum of squared elements using GLCM. The estimation of Angular Second Moment (ASM) denotes the energy.
√∑ ( )
(6)
4) Homogeneity: It estimates the closeness of distributed pixels. It operates similar to contrast and given as
∑ ( )
(7)
5) Entropy: It defines the loss of information processed by its local pixels which is given as
∑ ( ) ( ( )) (8)
Root Mean Square: It defines the root of the mean square from continuous distribution P(x) which is given as
√∫, ( )- ∫ ( )
(9)
3.5 Finding of Optimal k value
In order to find an optimum k value using k NN algorithm, a set of testing images are analyzed. The proposed k NN model is given as follows:
a) Input: No. Of samples; No.of training data; No. Of labels and No.of neighboring nodes.
224
●
Initializing the set of samples.D●
Every train_features with train_label counted until the maximum value of length metric is found.●
Finally, length based optimal k value is selected from the set of possible values. Fig. 1. shows the workflow of the proposed work.Fig 1. Proposed Workflow.
4.
EXPERIMENTAL
ANALYSIS
AND
RESULTS
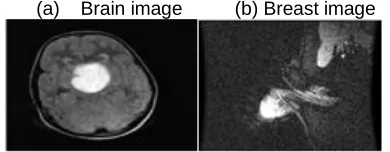
This section presents experimental analysis of the proposed workflow. Initially, a possible set of medical images, related to, brain tumor and breast cancer are collected from a public dataset repository. The acquired images of 256*256 are subjected to irrelevant noises which is improved by using Gaussian Filtering. Here, noise level of 0.01 is applied over the images. The Fig. 2. (a) and (b) represent the input image of brain tumor and breast cancer. Likewise different images were taken for analysis purpose.
(a) Brain image (b) Breast image
Fig. 2. (a) and (b). Input images of brain tumor and breast cancer
From Fig. 3, it is inferred that the preprocessed image is more visible than the input image. This process will blur the images and reduce contrast. The low-level contrast image degrades the edges of images for segmentation process.
(a) Brain image (b) Breast image
Fig. 3. (a) and (b). Preprocessed image of brain tumor and breast cancer
Fig.4. (a) and (b). represent the contrast-enhanced image which is used for morphological segmentation model. By doing so, the small objects are easily recognized for segmentation process which is shown in Fig. 5.
(a) Brain image (b) Breast image
Fig. 4. (a) and (b). Contrast-enhanced image for segmentation process
(a) Brain image (b)Breast image
Fig. 5. (a) and (b). Segmented images
With help of segmented image, the relevant features are extracted using GLCM model. The obtained features are contrast, correlation, energy, homogeneity, mean, standard deviation, entropy, Root mean square, variance, smoothness, kurtosis, skewness, inverse difference moment are all estimated. The Table 1. presents the sample values of all GLCM features.
TABLE 1. GLCM FEATURES
Samp le data
Contrast Correlat
ion Energy
homog eneity Mean
Std Dev
1 0.937 0.898 0.162 0.858 85.64 73.1
2 0.952 0.831 0.242 0.868 56.01 55.47
3 0.213 0.952 0.449 0.929 35.09 54.08
4 0.349 0.865 0.391 0.919 28.70 41.00
225
Entropy RMS Variance Smoothn ess
Kurtosi s
Skewnes s
7.172 13.69 3.590 1.00 2.538 0.572
6.401 13.33 2.283 1.00 3.640 1.102
3.863 7.600 1.772 1.00 3.453 1.308
4.446 8.740 1.200 1.00 7.567 1.920
4.334 8.755 1.155 1.00 8.334 2.012
The features from Table 1 has given as input to k NN systems for acquiring better k values. The results show that optimal k value is 7 for 100 no. Of training samples. The performance metrics analyzed are explained as follows:
Normal- Negative for tumor; Abnormal- Positive for tumor True positive (TP) - No. Of samples correctly identified as abnormal
False positive (FP) - No. Of samples incorrectly identified as abnormal
True Negative (TN) - No. Of samples correctly identified as normal
False Negative (FN) - No. Of samples incorrectly identified as normal.
a) Accuracy: It defines the ability of distinguishing normal and abnormal cases. It is given as:
( )
b) Sensitivity: It defines the ability of distinguishing abnormal samples correctly. It is given as:
( ) ( )
c) Specificity: It defines the ability of estimating normal samples correctly. It is given as:
( ) ( )
TABLE 2.
SELECTION OF OPTIMUM k VALUE DEPENDS ON ACHIEVED ACCURACY
Datasets No. of
samples Selecti on of k value
Accuracy (%)
Sensitivity (%)
Specificity (%)
Brain tumor 100
3 83 97 25
5 81 75 62
7 84 57 93
9 81 69 68
Breast cancer 100
3 84 71 68
5 81 55 75
7 89 69 56
9 86 63 81
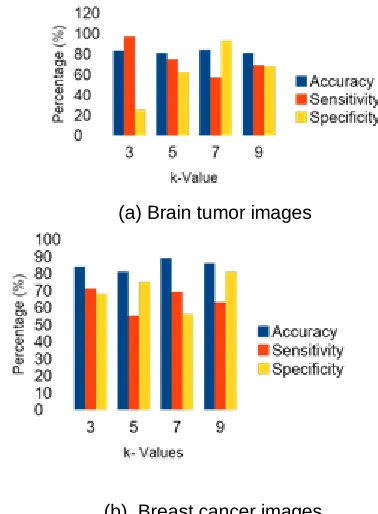
(a) Brain tumor images
(b) Breast cancer images
Fig. 6 (a) and (b). Performance analysis of each data set for different k values
Since, the objectives of the study is to find optimum k value for k NN process, the optimal k is estimated from the accuracy of different images like brain tumor and breast cancer medical data. The Table 2 and Fig. 6 (a) and (b) dictates the selection of optimum k value from achieved accuracy. The results states that k=7 gives the maximal accuracy values and thus its optimum for both datasets.
5.
CONCLUSION
This paper concludes the efficiency of the research study by selecting optimal k values. Depends on chosen k value, the performance of the study will be determined. It is important for the number of values considered to be reasonably large, to reflect the specific characteristics of the data sets. At the same time, the selected values have to be significantly smaller than the number of objects in the datasets, which is the main motivation for analytic purposes. The medical data of 200 samples collected from public repository has been observed by dividing into training and testing data. The training data are modelled using preprocessing, segmentation and feature extraction process. Finally, the trained given for each sample and thus obtain accuracy, sensitivity and specificity. The results state that when k is 7, the data emits maximal accuracy.
REFERENCES
[1]. Ghosh, A. K. (2006). On optimum choice of k in nearest-neighbor classification. Computational Statistics & Data Analysis, 50(11), 3113-3123. [2]. Zhang, S., Li, X., Zong, M., Zhu, X., & Cheng, D.
(2017). Learning k for kNN classification. ACM Transactions on Intelligent Systems and Technology (TIST), 8(3), 43.
226 variance estimation for nearest-neighbor
imputation. J. Am. Statist. Assoc. 96, 453 (2001), 260–269.
[4]. Xiai Chen, Zhi Han, Yao Wang, Yandong Tang, and Haibin Yu. 2016. Nonconvex plus quadratic penalized low-rank and sparse decomposition for noisy image alignment. Sci. Chin. Infor. Sci. 5 (2016), 1–13.
[5]. Debo Cheng, Shichao Zhang, Xingyi Liu, Ke Sun, and Ming Zong. 2015. Feature selection by combining subspace learning with sparse representation. Multimedia Syst. (2015), 1–7. [6]. Ingrid Daubechies, Ronald DeVore, Massimo
Fornasier, and C. Sinan Gunt ¨ urk. 2010. Iteratively reweighted ¨ least squares minimization for sparse recovery. Commun. Pure Appl. Math. 63, 1 (2010), 1–38.
[7]. Yongsheng Dong, Dacheng Tao, and Xuelong Li. 2015b. Nonnegative multiresolution representation-based texture image classification. ACM Trans. Intell. Syst. Technol. 7, 1 (2015), 4.
[8]. Zhen Dong, Wei Liang, Yuwei Wu, Mingtao Pei, and Yunde Jia. 2015a. Nonnegative correlation coding for image classification. Sci. Chin. Infor. Sci. 59, 1 (2015), 1–14.
[9]. Jianping Fan, Jinye Peng, Ling Gao, and Ning Zhou. 2015. Hierarchical learning of tree classifiers for large-scale plant species identification. IEEE Trans. Image Process. 24, 11 (2015), 4172–84. [10]. Pedro J. Garcıa-Laencina, Jose-Luis
Sancho-Gomez, Anibal R. Figueiras-Vidal, and Michel Verleysen. 2009. K-nearest neighbours with mutual information for simultaneous classification and missing data imputation. Neurocomputing 72, 7 (2009), 1483–1493.
[11]. Mohammad Ghasemi Hamed, Mathieu Serrurier, and Nicolas Durand. 2012. Possibilistic kNN regression using tolerance intervals. In Advances in Computational Intelligence. 410–419.
[12]. Xiaofei He, Chiyuan Zhang, Lijun Zhang, and Xuelong Li. 2016. A-optimal projection for image representation. IEEE Trans. Pattern Anal. Mach. Intell. 38, 5 (2016), 1009–1015.
[13]. Boyu Li, Yun Wen Chen, and Yan Qiu Chen. 2008. The nearest-neighbor algorithm of local probability centers. IEEE Trans. Syst. Man Cybernet. B 38, 1 (2008), 141–154.
[14]. Xuelong Li, Qun Guo, and Xiaoqiang Lu. (2016). Spatiotemporal statistics for video quality assessment. IEEE Trans. Image Process. 25, 7 (2016), 3329–3342.
[15]. Xuelong Li, Lichao Mou, and Xiaoqiang Lu. (2015). Scene parsing from an MAP perspective. IEEE Trans. Cybernet. 45, 9 (2015), 1876–1886.
[16]. Xuelong Li and Yanwei Pang. (2009). Deterministic column-based matrix decomposition. IEEE Trans. Knowl. Data Eng. 22, 1 (2009), 145–149.
[17]. Xuelong Li, Zhigang Wang, and Xiaoqiang Lu. (2016). Surveillance video synopsis via scaling down objects. IEEE Trans. Image Process. 25, 2 , 740–755.
[18]. Jiayin Zhu., Xuehua Zhao., Huaizhong Li., Huiling Chen., & Gang wu (2018). An effective machine
learning approach for identifying the glyphosate poisoning status in rats using blood routine test. IEEE access, 6, 15653-15662.
[19]. Xiabi Liu., Ling Ma., Li song., Yanfeng zhao., Xinming Zhao & chunwu Zhou (2015). Recognizing Common CT Imaging Signs of Lung Diseases Through a New Feature Selection Method Based on Fisher Criterion and Genetic Optimization. IEEE journal of biomedical and health informatics. 19(2). 635-647.
[20]. Yousif A. Alhaj., JianWen Xiang., Dongdong Zhao., Mohammed A., & Al. Qanes (2019). A Study of the Effects of Stemming Strategies on Arabic Document Classification. IEEE access. 7. 32664- 32671.
[21]. Liming Deng., Yong Hu., Jason Pui Yin Cheung., & Keith Dip Kei Luk (2017).A Data-Driven Decision Support System for Scoliosis Prognosis. IEEE access. 5. 7874-7884.
[22]. Asma Gul., Aris Per peroglou., Zardad Khan., Osama Mahmoud ., Miftahuddin Miftahuddin ., Werner Adler & Berthold Lausen (2018). Springer Advances in Data analysis and classification. 12(4). 827-840.
[23]. Ritu Chauhan., Harleen Kaur & Victor Chang (2017). Advancement and applicability of classifiers for variant exponential model to optimize the accuracy for deep learning. 12(5). 1-10.
[24]. J.S Sanchez., R.A Mollineda., & J. M. Sotoca (2007). An analysis of how training data complexity affects the nearest-neighbor classifiers. Springer Pattern analysis and Applications. 10(3). 189-201. [25]. N. Hema Rajini & R. Bhavani (2014). Automatic
classification of Computed Tomography brain images using ANN, k-NN and SVM. Springer AI &Society. 29(1). 97-102.
[26]. Gursoy, M.E., Inan, A., Nergiz, M.E. and Saygin, Y., 2017. Differentially private nearest neighbor classification. Data Mining and Knowledge Discovery, 31(5), pp.1544-1575.