278 IJSTR©2016
www.ijstr.org
Household Food Security Policy Analysis: A
System Dynamics Perspective
Isdore Paterson Guma, Agnes Semwanga Rwashana, Benedict Oyo
Abstract: Household food security (FS) is complex and requires multiple stakeholder intervention. Systemic approach aids stakeholders to understand the mechanisms and feedback between complexities in food security providing effective decision making as global resource consumption continues to grow. The study investigated food security challenges and a system dynamics model was developed for evaluating policies and intervention strategies for better livelihood at household level. Dynamic synthesis methodology, questionnaires and interview guide were used to unearth food security challenges faced by households. A causal loop diagram was drawn. The model demonstrates a balance between food stock, seeds preserved, seeds for sale and consumption from crop harvest throughout the food cycles. This research makes contribution to the literature by evaluating dynamic synthesis methodology and FS policy discussions from a feedback point of view.
Index Terms: Food Security, Policy Analysis, Subsistence Farmers, System Dynamics Model ————————————————————
1 INTRODUCTION
THE use of information and communications technologies (ICTs) in the agricultural sector has been underscored by academics, private sector, development partners and governments. The holistic potential of ICTs in transforming the agricultural sector is yet to be experienced, despite penetration in the poor households through knowledge and information as vital factors to ensure food security [9]. At household level, food security refers to the availability of food in one‘s home which one has access to. In this case, a household is regarded as food secure when the members of the family do not live in hunger or fear of starvation [3]. A number of researchers and institutions have built models for projecting and predicting global food security, focusing on future demand for food, supply and variables related to food system at different levels [13], [17], [6], [14]. Much conventional agricultural science and policy does not explain complexity, diversity, uncertainty, and non-equilibrium states, yet poor people who are dependent on agriculture for their livelihoods often live in complex situations [19]. These problems are non-linear and dynamic in character where critical minority of policy-makers and citizens are demanding holistic solutions that address such complex problems. Hence, attaining food security is complex and requires multiple stakeholders‘ intervention. Moreover, the process of decision-making is complex due to multiple dimensions related to food security [6]. The competition for food and bio-energy places pressure on the supply and price on the market for these goods (increase in food production has counter effect on bio-energy production). The interconnectivity between bio-energy and food markets creates pressure between land uses and competition for crops representing moral and national food dilemma as food riots continue to demonstrate interconnectedness [7]. On the other hand, increase in resource allocation results in greater demand for such resources, and this kind of problem behaviour is endogenously created and highly counterintuitive. Such counterintuitive behaviour is an example of policy resistance and such policies fail due to unanticipated feedback from the environment [5],
[18], [4]. Emphasizing feedback and endogenous systems help policymakers understand how policy resistance can arise. The high complexity in FS is as a result of lack of tools or methodologies suitable for assessing the effects of long-term policies, actors‘ failures to play proper roles, the lack of a holistic system model to facilitate intervention and understanding of the system [6]. This research answered the questions: What food security challenges are faced at household levels? What factors are associated with FS as well as their relationships in the FS domain? What are the requirements for building the model for analyzing FS strategies at household level? What policies and intervention strategies can be derived from the model to improve livelihood at household level?
Problem Statement
In Uganda particularly in the north, food insecurity is spiked at 59 percent compared to 48 percent at national level, prompting government, policy makers and development agencies to seek effective and sustainable solutions [20]. Usually, policy design and change in policy is complex, often characterized by non-linearity, tradeoffs and feedbacks that result in delays in decision making involving diverse stakeholders. Several methods have been used to address FS problems but all seemed to have failed due to lack of holistic system model to facilitate interventions and understanding of the food system at the subsistence farmers‘ level [6]. The complexity and tight connectivity of actors and systems creates synergies, mitigating effects and countervailing influences [8]. The tight connectivity therefore highlights need for an approach by engaging stakeholders describing uncertainty, complexity and ambiguity [1].
2
RELATED
SYSTEM
DYNAMICS
FOOD
SECURITY
M
ODELSFood, Bio-Energy Model
[14] underscore that the developed countries are faced with a new FS problem involving competition for crops for food versus crops for energy/ bio-fuels. In this model, proponents of bio-energy argue that development of energy is a solution for expanding energy sources, enhancing security of energy supply for meeting environmental and rural development objectives [14]. However, opponents dispute that increase in bio-fuel production contributes thirty percent (30%) rise in food ———————————
Isdore Paterson Guma is currently pursuing masters degree program in Information Systems in Makerere University, Uganda, Phone-+256-774566175. E-mail: [email protected]
Agnes Semwanga Rwashana is a senior Lecture at Makere University Uganda, Phone-+256-772412438. E-mail: [email protected]
Benedict Oyo is a senior Lecture at Gulu University, Uganda, Phone-+256-787067441. E-mail: [email protected]
prices, hence, threatening food security by diverting land from food production to energy production [14]. This model explains the simultaneous need for food and energy which would otherwise lead to food security crisis and vice-versa. The model was designed to determine appropriate policies and decision making in order to reconcile present and future food and energy security from economic, social and environmental dimensions. However, the model was exploratory from which validated foresights and forecasts cannot be generated and hence, needs to be refined, extended and validated.
Oil, Bio-Fuels and Food Model
In oil, bio-fuel and food model, [17] modeled the dynamic interaction between oil, bio-fuel and food. The model is used to test the hypothesis that food shortages are due to increased bio-fuel production. Consequently, the model is used to explain that shortage of oil makes bio-fuels highly profitable leading to takeoff of bio-fuel industry which in turn leads to shortages of food. The model further suggests that food prices will rise due to population and income growth on the demand side and dwindling idle resources for food production on the supply side. The model attempts to evaluate alternative policies that do not require agricultural land and also considering a ban on bio-fuel production requiring such agricultural land. The model is an aggregation of the markets for food and liquid oils and links between these markets.
Seed Banking Model
Seed banking is a holistic approach for empowerment of smallholder farmers through preserving seeds for future planting, diversifying into higher value crops and saving money from sale of surplus crops concurrently [13]. Seed banking intervention transcends this problem as it empowers farmers to produce more through sustainable provision of improved seeds during planting seasons while offering competitive prices for harvested crops. From the SD model, [13] draws four (4) important lessons:
That the relationship between production and profitability is not linear.
That smallholder farmers living below the poverty line are difficult to liberate as the acute need for money leaves them with no option but to sell their harvest as soon as it leaves the field without realistic consideration of future food/seeds.
That crop production at the grassroots may decline because farmers are planting less as seeds are either scarcely available or unaffordable.
That the poverty levels at the grassroots will continue to increase as smallholder farmers resort to selling livestock and charcoal to buy food when their food reserves are empty.
However, the SD model does not consider the effect of food inflation on agricultural profitability at the grassroots.
Giraldo et al., (2008) Model
[6] model presents the dynamics of stock of food and non-food products, land intended for food and non-food, population dynamics related to access to food, food production and food price. The model adds knowledge on the dynamics present on food availability, leverage points and potential evaluation of policies that generate stability and sustainability within the system. The study mainly focuses on interaction between food
availability, access to it and its stability. Several lessons can be drawn from this study:
That public policies on FS can be derived if FS is approached from micro-nutrition (single), family and national levels (regular supply of food) and macro perspectives.
That SD can be employed to allow the user analyse and manipulate internal structures and study relationships between the structures and bahaviour of the models.
However, the model was under construction for policy analysis and aimed to observe presentation for direct interaction with related scientific community and this model may not apply to the Ugandan situation because the research was done in a developed country with different environmental conditions.
Gap Analysis
The models developed around food security use correlations and algorithms to explain relationships by focusing on isolated parts and yet the problem of FS is complex in nature. An examination and analysis of the approaches indicate that: The studies do not look at diverse stakeholder viewpoints,
counterintuitive behaviour and policy resistance;
The studies concentrate on exogenous factors rather than endogenous factors;
The models are suggestive on policies hence no clear position on policies and consequently, forecast at short and medium term policies and are dependent on qualitative data.
Hence, SD is seen as a new lens of conducting multi-disciplinary research involving both ‗hard‘ (quantitative) and ‗soft‘ (qualitative) systems in complex environments. Thus, SD is selected as the preferred method in the formulation of this model due to the following:
It is a methodology that helps to understand why things are happening now;
Its great interest is on the causation of variables;
Its main purpose is the evaluation of policies and their long term influence [6].
Such a wide scope is possible because system dynamics, though mainly quantitative, traverses the qualitative approach.
THE MODEL
In developing the FS model, Dynamic Synthesis Methodology (DSM) was employed [22]. DSM is one of the SD methodologies with special emphasis on simulation modeling and case study whose added advantages can complement each other in terms of theory building, testing and extension. The methodology has the ability to incorporate differing views of reality, improving both building and testing of theories/policies. Its usefulness further aids researchers to improve building and testing of theories, understanding of process building, strategic modeling and analysis.
MAIN SECTORS
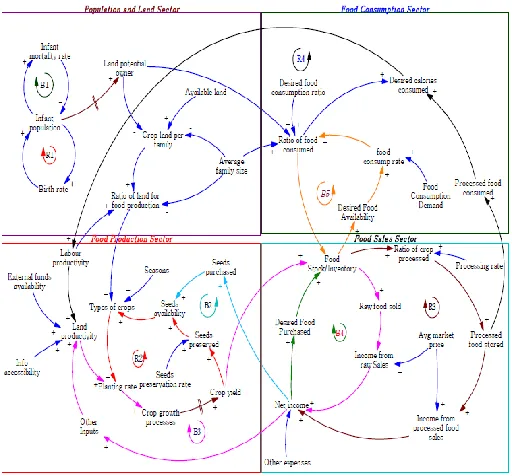
The model is conceptualised in four (4) main sectors which represent real life situation at household level. Details of these sectors are given in CLD in figure 1.
CAUSAL LOOP DIAGRAM
280 system by mapping its elements and the relationships among
them [21]. [21] further explains that CLD is an important tool for evidencing the hypothesis assumed in the model, it draws mental patterns and relevant feedbacks to problem solution which contains system elements or variables relevant to the system. From the FS CLD, loops R1 and B1 (Infant population) show that increase in birth rate increases infants population and vice versa while increase in infant population causes increase in infant mortality rate and thus reduction in infant population. The infant population will eventually become land potential owners after a transition period. The reinforcing loop R2, demonstrates that planting a variety of crops increases the rate of crop growth processes resulting in higher crop yields. The increase in crop yield increases the chances of the preservation of seeds for the subsequent planting seasons. The balancing loops B2 and B3 explain that increase in crop yield increases food stock/inventory and this also increases quantity of the sale of raw food. Increase in net income increases farmers‘ opportunity to purchase seeds for the next planting season and for purchasing other inputs like fertilizers, hoes, pesticides and herbicides. The net income is further constrained by other expenses such as payment of school fees and hospital bills. The food sales sector consists of two loops B4 (Balancing loop) and R3 (Reinforcing loop). Loop B4 explains that increase in net income of the farmer increases farmers‘ desire to purchase more food from the market. This also adds on to the food stock level while Loop R3 explains the sale of the processed food (value addition). Increasing food stock level increases the proportion of processed food which increases the stored processed food. The processed food is stored and then sold. This therefore, increases the net income of the farmer. Loop B5 demonstrates that increase in food stock increases availability of desired food for consumption. This also increases food consumption rate and ratio of food consumed. The food consumed (both raw and processed) provides the desired calories (energy) to the labour force which is again fed into the next production cycle.
Figure 1: Causal Loop Diagram of the Food Security Model
STOCKS AND FLOWS
The food security simulation model was constructed so that it could be used to investigate deeper dynamic issues that are of concern to management and provide varying scenarios with different structures and policies. The model was divided into four sectors (Land and Potential owners, food production sector, food sales and consumption sector) and simulated over a period of 15 years to evaluate potential policy development and debate in food security sector.
Land and Potential Owner Sector
The land and potential owner sector shows the dynamic transition from infant to potential land owners and available land versus actual land per person. This sector has a population sub-model with two stocks which represent the two different age groups namely; children (1 - 13 years), and teenage (14 – 17 years). Other stocks include transition land owners and potential land owners. The transition land owner is represented by a conveyor showing transition from childhood (conveyor allows some minimum duration for infants to fully become adults) until the age of 18 years which is the minimum age they start to own land. Potential land owner shows the number of individuals who own land for cultivation. The available land is shared between potential land owners and family members which determine how much land is reserved per person for producing food for better livelihood.
Figure 2: Land and Potential Owners
Food Production Sector
Figure 3: Food Production Sector
Sales and Income Sector
This sector demonstrates the sales, net income and how much a farmer consumes. The food stock has one inflow: crops planted and four outflows: future seeds, crop sales rate, consumption rate and processing rate. This explains the fact that from the available food stock, part of it is sold to earn money, some processed to add value, some preserved for future seeds and the largest part is consumed as food. The net income is mostly derived from sale of raw crops and little from processed crops. Net income is dependent on average market price and how much a farmer has sold.
Figure 4: Sales and Income Sector
Food Consumption Sector
This sector shows the trend of food consumed as a fraction of the available food stock. The sector comprises of two stocks namely expected food stock and food consumed. The food consumption is a function of the average family size, food demand and consumption rate. The food stock is largely dependent on crop harvest which is derived from the available crop land (cultivated land).
Figure 5: Food Stock and Food Consumed Sector
MODEL SIMULATION RESULTS
According to [10], policy experiments refer to how a manager uses information about the system in the formulation and design of policies. The model was developed into a tool that could easily be used by policy makers of the FS system. Consequently, this section provides a snapshot of the output of the model simulations.
Simulation Behaviour for Land and Potential Owners The simulation result demonstrates that despite increase in number of potential land owners the available land remains constant. Meanwhile the actual land per family remains constant for some period and then exponentially decreases to minimum value over the years. This explains the fact that the expected amount of crop land owned by family members keeps on reducing with increasing number of potential land owners and family size. This therefore, has direct negative implication on food production in that increase in number of family size reduces the capacity to grow more food due to reduced land for farming (crop land). Hence, land will eventually become inaccessible for farming with the increasing number of potential land owners coupled with other economic activities such as construction of houses and so on.
282 Simulation Behaviour of Food Production Sector
The simulation result shows how much yield can be obtained from a given crop land. The planting rate depends on land productivity, types of crops grown and land ratio (a ratio of actual land to available land). If the ratio is less than 1, the crop land becomes smaller in size and ultimately less crop yield realized. Crop yield is also directly dependent on seasons. The more the planting seasons, the higher the crop yields. The crop yield remains constant as crop growth process increases. The increase in crop yield implies harvesting season. Similarly, a rise in crop growth processes indicates crops growth until maturity. The model demonstrates that under normal circumstances, food production majorly depends on crop seasons and land ratio. The more seasons of planting crops and higher land ratio implies the higher crop yield.
Figure 7: Variation of crop yield and crop growth processes
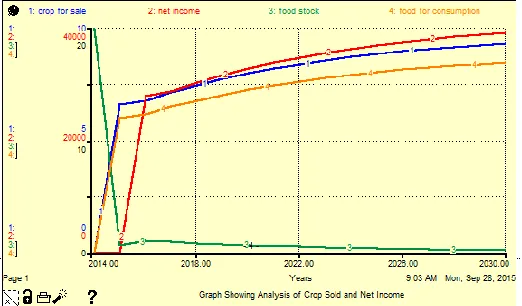
Simulation Bahaviour of Sales and Income Sector The result of simulating sales and income sector shows that the net income (summation of sale of raw and processed crops) increases with crop sales. The sales profit is obtained by the percentage of crops sold which is dependent on average market price (arrayed as raw and processed prices). The higher the average market price, the higher the profit obtained from the sale of crops. Adjusting the sliders to their maximum values demonstrate the ideal situation where stock value remains high (20 sacks) and 50 kgs earning 300,000=.
Figure 8: Simulation Bahaviour of Sales and Income Sector
Simulation Behaviour for Food Stock and Food Consumption
The initial food stock decreases as consumption increases. When the food stock level drops to minimum value, food consumption remains almost constant until stock value reaches a maximum value while consumption begins to
increase and the same trend is repeated several times. This means that the family members must try to maintain their consumption and use other sources of food when stock levels have run to a minimum value. The amount of food consumed is largely dependent on consumption rate of the average family members and food demand. The expected food consumed is ten (10) times the expected food stock. This implies that more food crops need to be grown to achieve food security at household level.
Figure 9: Simulation Behaviour for Food Stock and Food Consumption
Adjusting the Conditions of Sales and Income Sector This scenario enables users to adjust the conditions of some variables to determine the quantity of crops sold, food stock, food consumption and net income. The behavior of the key variables under normal rates, low rates and high rates are shown in figures 10, 11, and 12 respectively.
Assumption in the model
There is high average market price expected when there is one (1) season of planting and low market price when planting seasons have been increased to three (3). The simulation results indicate that food consumption and crops sold have direct effect on food stock but net income is only dependent on how much crop yield is sold and average market price. As the quantity of crop yield sold increases, income also increases. Increase in quantity of crops sold and food consumption causes a sharp decrease in food stock level which continues to decrease further as shown in figure 10 and figure 11.
Figure 11: Simulation Runs Showing Behaviour Under Low Conditions
The simulation result in figure 12 demonstrates the ideal situation where the food stock should stay higher despite increasing crop sales and food consumption. There is need for decision making to balance between how much yields to sell in order to earn reasonable income and how much is to be reserved to feed the family members.
Figure 12: Simulation Runs Showing Behaviour Under High Conditions
The results of simulation presented in table 1 demonstrates that there is a general decrease in output variables when crops are planted once in a year and an increase when planting seasons have been increased to three (3). However, there is an increase in net income when planting is done in only one season and a decrease in net income due to low crop prices when there is plenty of food (planting is done in three (3) seasons).
Table 1 Variation Under Different Conditions
From table 1 above, farmers tend to sell more during three seasons of harvest (8.38), less during one season of harvest (6.80) and about 7.39 during normal seasons of harvesting.
The food stock stays high in three seasons of harvest (9.99), average in two seasons of harvest (4.44) and very low in one season of harvest (1.11). The net income is dependent on food stock level, average market price and quantity of crops sold. The higher the stock level, the lower the market price and hence, low income from sale of crops. On the other hand, the lower the stock level, the higher the market price and therefore, the higher the income from sale of crops. The food consumption figures also indicate the scenarios explained in figures 10, 11 and 12.
PROPOSED INTERVENTION STRATEGIES
System dynamics model has the ability to conduct policy experimentation to contribute to public policy making. The model is used in an exploratory way in order to generate interesting insights and offer more understanding. The model cannot be used numerically to generate precise predictions/forecasts and/or exact measures of sensitivity to changes in parameters. This research originates from the observation that existing policies on food security issues were found to be linked to the nature of its complexity, dynamic and non-linearity. The inadequacy of most existing methods likewise provides equal means of addressing the qualitative and quantitative facets of food security. Therefore, the problem addressed in this research had a dual character which is practical (dealing with complex, dynamic, non-linear issues) and theoretical (lack of effective and sustainable guidelines for solving food security problems without compromising problem scope). Hence, need for immediate actions to improve FS at household levels. The following are the policy guidelines to improve FS at household level:
1. There is need to effectively utilize the scarce land resource to have optimum food productivity and production. If not properly utilized, there will be a direct negative implication on food production as increase in number of family size reduces the capacity to grow more food due to reduced crop land (Land and Potential Owner Sector).
2. There is need to advocate for food production oriented activities to increase food production or production of crops for sale or both. This would prevent farmers from running out of food stock so as to maintain their consumption level (Food stock and consumption sector), and to prevent them from resorting to selling their assets. Similarly, there should be advocacy for self-sufficiency policies in food production or adoption of ―food first‖ policy that emphasizes food crops and inclusion of cash crops which is crucial for alleviating hunger. Hence, joint promotion of food crops and cash crops in support of FS enhancement. Furthermore, farmers should be supported and strengthened to set up community food banks in order to increase access to food as well as information.
3. There should be additional support to farmers through provision of agricultural inputs such as hoes, fertilizers, pesticides, herbicides and improved seeds; and be given sufficient training to best apply these inputs.
4. In order to empower farmers economically, farmer associations should be instituted and strengthened including the revival of farmer cooperative societies to support community self-help projects that address both hunger/starvation and malnutrition.
284 oriented programs which will enable households to
increase their ability to save and build up food productive asset bases.
6. There ought to be provision of credits for consumption stabilization which will enhance FS in the growing and diversifying of rural economies for low income farmers. This can be achieved through group loans for poor households without collaterals as long as group size remains small which will operate on.
C
ONCLUSION ANDF
UTURER
ESEARCHThe FS model developed in this study provides the feasibility of system dynamics modeling in addressing FS challenges at household levels. The research aimed to unearth and understand the FS challenges at subsistence level through formulating strategies and policies. A model of FS was developed as a measure of relevance of this strategy. The model was then used to generate insight into the strategies and policies to help improve resilience to FS challenges at subsistence farmers‘ level. The research also employed the knowledge of CAS theory to understand the interconnectedness of the system and their emergent behavior. Therefore, there is need to agitate for a stronger research focus that identifies these practices and builds on them to incorporate policy that makes the food system more resilient rather than efficient. It would be useful to incorporate modeling of crops and animals as alternative means of ensuring FS because these could generate some sources of income to increase accessibility of food from the market. It would also make it possible to avoid using a negative or zero food stock values to represent the transition to alternative means of attaining food security. Nevertheless, the tool is by no means a solution in addressing the entire FS problems. The tool in its current form places more emphasis on availability and accessibility of FS component without considering the other factors involved especially change in weather. Hence, extending the scope to accommodate all the factors which would serve the same purpose is possible. Most important would be to explore the crop and animal enterprise modeling. In light of the outcomes of this investigation, future research is required in two areas: Modeling of cash crops and animals as a means of empowering subsistence farmers to ensure that they are food secure at all times and; further testing and refinement of FS model.
REFERENCES
[1]. Adger, W. N. (2006). Vulnerability. Global Environmental Change, 16(3): 268- 281.
[2]. Faridi, R., & Wadood, S. N. (2010). An econometric assessment of household food security in Bangladesh. Bangladesh Development Studies, 33(3), 97.
[3]. FAO. (2011). Save and Grow. A Policymakers‘ Guide to the Sustainable Intensification of Smallholder Crop Production. Rome: Food and Agriculture Organization of the United Nations.
[4]. Forrester, J. W. (1971b). Counterintuitive Behavior of Social Systems. Technology Review 73 (3):52-68.
[5]. Ghaffarzadegan, N., Lyneis, J. & Richardson, G. P. (2009). Why and How Small System Dynamics Models
Can Help Policymakers: A Review of Two Public Policy Models.
[6]. Giraldo, D. P., Betancur, M. J., & Arango, S. (2008). Food Security in Development Countries: A systemic perspective. Technology, 1, 15.
[7]. Hu, O. (2012). System Dynamics Modeling of the Brazilian Sugarcane Ethanol Industry. Computational modeling and analytics in Social Science.
[8]. Ingram, J., Ericksen, P. and Liverman, D. (2010). Food Security and Global Environmental Change. Earthscan, London, UK.
[9]. Lashgarara, F., Mirdamadi, S. M., & Hosseini, S. J. F. (2010). Determining the Causal Model Role of ICT in Improving Food Availability of Iranian Rural Households. International Journal of Advanced Science and Technology Vol. 24.
[10]. Maani, K. E. & Cavana, R. Y. (2000). Systems Thinking and Modeling: Understanding Change and Complexity, Prentice Hall, Auckland.
[11]. Mehta, P. (1992). Optimizing Techniques in Agriculture. Satosh Kumar Jain for CBS Publishers and Distributor Delhi, India.
[12]. Oyo, B. (2013). A system dynamics analysis of seed banking effectiveness for empowerment of smallholder farmers. In IST-Africa Conference and Exhibition (IST-Africa), 2013 (pp. 1–8). IEEE.
[13]. Pruyt, E., & De Sitter, G. (2008). Food or Energy? Is that the question? Paper presented at the Proceedings of the 28th International Conference of the System Dynamics Society, Athens, Greece.
[14]. Repenning, N. P. & Sterman, J. (2002). Capability traps and self-confirming attribution errors in the dynamics of process improvement. Administrative Science Quarterly 47: 265–295.
[15]. Rwashana, A. S., & Williams, D. W. (2008). Modeling the dynamics of immunization healthcare systems: The Ugandan case study. In Proceedings of the 26th International Conference of the System Dynamics Society (pp. 20–24).
[16]. Sandvik, S. & Moxnes, E. (2009). Peak oil, bio-fuels, and long-termfood security. University of Bergen. Available at http://www.ifi.uib.no/sd/a accessed on 24/08/2013.
[17]. Sterman, J. D. (2000). Business dynamics: Systems Thinking and Modeling for a Complex World Boston, United States of America: Irwin/McGraw-Hill.
[19]. Uganda Bureau of Statistics-Government of Uganda- World Food Programme (UBOS-GoU-WFP) (2013). Comprehensive Food Security and Vulnerability Analysis (CFSVA)-Uganda.
[20]. Ullah, M. A. (2012). Enhancing the Understanding of Corruption through System Dynamics Modeling: A Case Study Analysis of Pakistan.