Licensed under Creative Common Page 892
http://ijecm.co.uk/
ISSN 2348 0386
RATIOS FOR MEASURING BASIC INDUSTRY AND
CHEMICALS FIRMS PERFORMANCE
Dadan Rahadian Telkom University, Malaysia dadan.rahadian@gmail.com
Anisah Firli
Telkom University, Malaysia firli297@yahoo.co.id
Galang Nusa Mahardika
Telkom University, Malaysia galangnusa7@gmail.com
Abstract
Measuring firm performance using financial ratios has been challenging for many researchers
and practitioners. The identification of factors that describes the firm performance can
accurately predict which parts of the firms’ operations should be maintained, which is important
for decision makers. This study aims to examine the financial ratios that can be used to
measure financial performance in Basic Industry and Chemicals Firms and measure the
financial performance by using the ratio found. We found 16 ratios to measure the performance
in this industry that ideally can be used in Basic Industry and Chemicals Firms Performance:
Return on Assets (ROA), Return on Equity (ROE), Return on Sales (ROS), Return on
Investment (ROI), Net Profit Margin (NPM), Operating Cash Flow (OCF), Earning Per Share
(EPS), Operating Profit Growth (OPG), Sales Growth (SG), Return on Capital Employed
(ROCE), Cash Stocks (CSA), Total Assets Turnover Ratio (TATO), Labor Productivity (LP),
Profit per Employee (PPE), Gross Profit Margin (GPM), and EBITDA Margin. This research
gives implication for improving the financial performance for this sector. Company in this sector
Licensed under Creative Common Page 893
on other performance measures. Decreasing in profit will give impact into decreasing other
performance indicators. Different industry ideally has different measurement of financial
performance, so this research should be extended to find ratios performance in other industry.
Keywords: Financial Performance, Firm Performance, Financial Ratio, Basic Industry and
Chemicals
INTRODUCTION
The numbers of firms entering basic industry and chemicals sector in Indonesia are increasing. They strive to produce high quality products with minimum cost in order to increase competitiveness in domestic and global markets. It is a challenge for businessmen to maintain and improve their performance in order to survive in the increasingly fierce competition, especially in times of crisis. Therefore, the firms’ performance needs to be evaluated to identify their growth. Evaluation of firm performance is very important, not only for the firms but also for their creditors and investors. Performance evaluation is one of the important tools to identify the firms’ strengths and weaknesses and to see the opportunities and threats of competitors. In addition, it can also locate the firms’ position in the competitive market. In particular, financial performance evaluation is usually conducted using financial ratios in accordance with the purpose of the measurement. Each industry has a different performance structure. For example, in hospitality industry, there is a measurement of ratio regarding occupation rate. Furthermore, in banking industry, the ratios of BOPO, CAR, NPL can be found, which are unique and not necessarily applicable to other industries. Another example is the telecommunication industry that uses ARPU measurement to measure the firm performance in terms of revenue per customer. In this study, we collected various ratios from previous studies in basic industry and chemicals sectors.
Licensed under Creative Common Page 894 Sectoral Index Growth (2015 – 2016)
Annually, the growth in basic industry and chemicals sector is the second highest after the mining sector. The high growth of the basic industry and chemicals sector may be caused by the increasing demand for basic industries, such as cement as building materials. Based on Figure 1, Indonesia Stock Exchange (IDX) data shows that, in 2016, the cement subsector became the largest contributor to the growth of the basic industry and chemicals sector index, 33,313,713,617 shares were being traded out of the total 81,239,287,937 shares traded or contributed to the 41.00% growth in basic industry and chemicals sector. This is very closely related to the Indonesian government decree that, through the policy package, attempts to increase the national economic growth through infrastructure development, such as transportation and electricity in various regions in Indonesia. Due to the conditions that trigger the increasingly fierce competition between businessmen, firms should plan a strategy to improve their performance and win the competition.
Therefore, firm performance evaluation needs to be conducted by evaluating financial ratios to guide the decision-making process. Furthermore, the financial ratios used to measure firm performance are varied, and this study aimed at analyzing the ratios that will be used to measure the performance of firms that are specifically engaged in basic industry and chemical sector.
Licensed under Creative Common Page 895 LITERATURE REVIEW
Measuring Firm Performance
Based on previous studies, we found some variables that can be used to measure the performance of manufacturing firms especially in basic industry and chemicals sector. The following ratios will be used in this study:
Table 1. Firm Performance’s Measurement of Basic Industry and Chemicals Sector
Variables Authors Definition
Return on
Assets (ROA)
Voulgaris and Lemonakis (2014), Purwanto and
Augustin (2017), Muhammad, Shah and ul Islam
(2014), Shahzad et al., (2015), Khidmat and Rehman
(2014), Gill (2011), Haque and Faruquee (2013),
Kamatra and Kartikaningdyah (2015), Hakro and
Akram (2009), Liu, Miao and Li (2007), Iwata and
Okada (2011), Dehning, Richardson and Zmud (2007).
Net income of the firm divided by the
total assets.
Return on
Equity (ROE)
Muhammad, Shah and ul Islam (2014), Farrokh,
Heydari and Janani (2016), Moghimi and Anvari
(2014), Khidmat and Rehman (2014), Pour (2016),
Dasti, Zadeh and Sharifi (2016), Hunjra et al., (2014),
Khan (2012), Cheema and Din (2013), Sasikala and
Balakrishnan (2016), Haque and Faruquee (2013),
Kamatra and Kartikaningdyah (2015), Hakro and
Akram (2009), Iwata and Okada (2011), Wagner et al., (2002), Ertuğrul and Karakaşoğlu (2009).
Net income of the firm divided by the
shareholders equity.
Return on
Sales (ROS)
Hakro and Akram (2009), Liu, Miao, and Li (2007),
Iwata and Okada (2011), Wagner et al., (2002),
Dehning, Richardson and Zmud (2007).
Operating income to sales, operating
income is defined as sales less costs
of goods sold (COGS) and general
and administrative expenses
(SG&A).
Return on
Investment
(ROI)
Naz, Ijaz and Naqvi (2016), Sasikala and Balakrishnan
(2016), Iwata and Okada (2011), Makki and Lodhi
(2009).
Operating profit of the firm divided by
the capital employed.
Net Profit
Margin (NPM)
Muhammad, Shah and ul Islam (2014), Farrokh,
Heydari and Janani (2016), Moghimi and Anvari
(2014), Naz, Ijaz and Naqvi (2016), Ariefin and Pervin (2016), Kamatra and Kartikaningdyah (2015), Ertuğrul and Karakaşoğlu (2009).
Net profit of the firm divided by the
Licensed under Creative Common Page 896 Operating
Cash Flow
(OCF)
Abbadi and Abbadi (2013), Ernayani and Robiyanto
(2016), Wan and Zhu (2011), Pour (2016), Dasti,
Zadeh, and Sharifi (2016), Vijayalakshmi and Bansal
(2013), Gill (2011).
Operating cash flow to total assets,
operating cash flow is defined as (EBIT + depreciation – taxes).
Earning Per
Share (EPS)
Hunjra et al., (2014), Arefin and Pervin (2016), Khan
(2012), Cheema and Din (2013), Jatoi et al., (2014),
Haque and Faruquee (2013), Kamatra and
Kartikaningdyah (2015).
Net income of the firm divided by the
number of total number of shares
outstanding.
Operating
Profit Growth
(OPG)
Farrokh, Heydari and Janani (2016), Moghimi and Anvari (2014), Ertuğrul and Karakaşoğlu (2009).
The increase in current period
operating profit for a firm between
the two-time period. It can be calculated by [(Pt−Pt −1)/(Pt −1)]×100,where Pt is the operating profit with current pricesand Pt −1 is
the operating profit of the previous
period.
Sales Growth
(SG)
Farrokh, Heydari and Janani (2016), Moghimi and
Anvari (2014), Vijayalakshmi and Bansal (2013), Bayyurt and Duzu (2008), Ertuğrul and Karakaşoğlu (2009).
The percentage increase in sales
within specific period than its last
period sales. It can be calculated by [(St−St −1)/(St −1)]×100, where St is the net sales of the current period and St −1 is the net sales of the
previous period.
Return on
Capital
Employed
(ROCE)
Sasikala and Balakrishnan (2016), Wagner et al.,
(2002), Diaz et al., (2017).
Operating profit of the firm divided by
the capital employed.
Cash Stocks
(CSA)
Silva and de Carvalho (2015). Cash stocks scaled by the total
assets.
Total Assets
Turnover Ratio
(TATO)
Ertuğrul and Karakaşoğlu (2009), Dehning, Richardson and Zmud (2007).
Sales divided by the total assets.
Labor
Productivity
(LP)
Voulgaris and Lemonakis (2014), Hakro and Akram
(2009), Wagner (2002), Heshmati and Rashidghalam
(2016).
It can be calculated by dividing the
firm total sales by the number of
employees.
Profit per
Employee
(PPE)
Pflug (2014), Bayyurt and Duzu (2008), Bryan (2007). Net income divided by the number of
Licensed under Creative Common Page 897 Gross Profit
Margin (GPM)
Muhammad, Shah and Ul Islam (2014). Total sales minus cost of goods sold
then divided by firm total sales.
EBITDA
Margin
Kaen and Baumann (2003), Pidun and Wolff (2007). EBITDA divided by total revenue.
EBITDA can be calculated with
operating profit plus depreciation,
depletion, and amortization (DD&A).
RESEARCH METHODOLOGY
Based on the investigation in over 30 studies measuring firm performance in the basic industry and chemicals sector, there are 16 ratios used to measure the performance in the sector. The used ratios include Return on Assets (ROA), Return on Equity (ROE), Return on Sales (ROS), Return on Investment (ROI), Net Profit Margin (NPM), Operating Cash Flow (OCF), Earning Per Share (EPS), Operating Profit Growth (OPG), Sales Growth (SG), Return on Capital Employed (ROCE), Cash Stocks (CSA), Total Assets Turnover Ratio (TATO), Labor Productivity (LP), Profit per Employee (PPE), Gross Profit Margin (GPM),and EBITDA Margin. This study also used secondary data from Indonesia Stock Exchange (IDX) in the form of firm annual report, which is the annual data from 2012 to 2016. From the basic industry and chemicals sector, there are 53 firms’ data collected out of 66 firms listed on IDX. The selection of samples was based on the availability of data.
Table 2. Sample Proportion
Subsector Number of
Firms
Number of
Samples Firm’s Stock Name
Cement 6 3 INTP, SMCB, and SMGR
Ceramics, Glass, Porcelain 6 6 AMFG, ARNA, IKAI, KIAS, MLIA and TOTO
Metal and Allied Products 16 14 ALKA, ALMI, BAJA, BTON, CTBN, GDST, INAI, JKSW, JPRS, KRAS, LION, LMSH, NIKL and TBMS
Chemicals 10 7 BRPT, DPNS, EKAD, INCI, SRSN, TPIA and UNIC
Plastics and Packaging 12 10 AKPI, APLI, BRNA, FPNI, IGAR, IPOL, SIAP, SIMA, TRST and YPAS
Animal Feed 4 4 CPIN, JPFA, MAIN and SIPD
Wood Industries 2 2 SULI and TIRT
Pulp and Paper 9 7 ALDO, FASW, INKP, INRU, KBRI, SPMA and TKIM
Others 1 0 -
Licensed under Creative Common Page 898 FINDINGS AND DISCUSSION
This study analyzed 53 firms in basic industry and chemicals sector. The data related to the calculation of each component ratio processed using descriptive statistics to identify the mean, standard deviation, minimum value, and maximum value of each variable. The descriptive statistical result of this study is presented in Table 3.
Table 3. Descriptive Statistics
Variables Mean Std.Dev Minimum Maximum Observations
ROA 0.03 0.09 -0.54 0.32 53
ROE 0.02 0.27 -2.67 0.44 53
ROS 0.04 0.19 -1.52 0.79 53
ROI 0.07 0.24 -2.14 0.47 53
NPM 0.01 0.21 -1.83 0.82 53
OCF 0.06 0.10 -0.29 0.80 53
EPS Rp183 Rp568 -Rp2,970 Rp4,415 53
OPG -0.13 1.42 -5.90 6.67 53
SG 0.07 0.64 -1.00 4.93 53
ROCE 0.07 0.24 -2.14 0.47 53
CSA Rp6,621,972,411,828 Rp
13,594,739,180,928 Rp685,812,995
Rp
84,460,944,000,000 53
TATO 3.72 34.52 0.00 552.83 53
LP Rp1,754,447,310 Rp3,139,258,808 Rp1,062,531 Rp25,651,589,519 53
PPE Rp57,391,197 Rp197,766,712 -Rp998,375,839 Rp881,494,748 53
GPM 0.15 0.14 -0.28 1.00 53
EBITDA_M 0.09 0.14 -1.04 0.85 53
Return on Assets (ROA)
Licensed under Creative Common Page 899
Figure 2. Return on Assets (ROA)
Based on Figure 2, the ROA in basic industry and chemicals sector decreased in 2012-2015, but increased again in 2016. During the study in 2015, the ROA of basic industry and chemicals sector was at the lowest level. This decrease also came with a reduction in overall assets in basic industry and chemicals sector. The decrease in assets owned has an impact on the reduction in revenues. Some of the causes of the decrease in firms’ assets in basic industry and chemicals sector were the economic slowdown in 2015. In addition, the government’s policy that was contradicting with the cement industry also caused negative sentiment among investors, so investors tend to cancel their investments. The economic slowdown was marked by the weakening of rupiah value, which was burdening the businessmen who import a lot of raw materials, such as those in the steel industry. This was certainly difficult to avoid because the raw materials of production were mostly imported. As much as 64% of the total industry in Indonesia still relies on raw materials, auxiliary materials, and imported capital goods to support the production process. This condition occurred because the business men were trying to avoid fluctuations in the rupiah exchange rate against the US dollar.
Return on Equity (ROE)
Licensed under Creative Common Page 900
Figure 3. Return on Equity (ROE)
In 2012-2016, based on Figure 3, the ROE of the basic industry and chemicals sector decreased in 2012-2013 due to a decrease in net income and total equity. It also happened in 2014-2015, where the net income and total equity in this sector decreased sharply. The ROE increased back in 2015-2016, indicated by an increase in net income and total equity in this sector. However, this increase was dominated by an increase in net profit. The decrease and increase in net income in this sector was due to the decrease and increase in sales that could be generated by the firms. The fluctuations in total equity in this sector may be due to factors outside the firms, one of which is related to investors’ sentiments. The decrease in total equity can be attributed to the investors that tend to cancel their investments. If this happens, it will certainly affect the availability of funds, operational activities, and productivity levels in this sector. If the firms do not conduct operational activities and perform optimum productivity, the profits generated will be impacted. Moreover, the firms’ ability to generate profits will have an impact on the their ability to make a turnover for the shareholders.
Return on Sales (ROS)
ROS is the ratio used to measure firm performance in terms of profitability, which is to calculate how much is the operational profit that can be obtained by a firm from sales activities. This ratio can be obtained by dividing operating income with total sales (Hakro, A. N., & Akram, M. (2009)).
Licensed under Creative Common Page 901
According to Figure 4, the ROS in 2012-2016 was fluctuating, meaning that there was a decrease in 2012-2013 and a sharp decrease in 2014-2015. This decrease was due to a decrease in sales. Decreases in sales can be caused by the decrease in people’s purchasing power of basic needs. In addition, this sector was faced with increased production costs in 2015, hampering firms’ operations, such as IKAI that halted production in early 2015 due to the weak condition of real estate sector. However, by 2016, the basic industry and chemicals market showed growth.This condition may happendue to the increase in export volume and the increase of the competitiveness of firms.
Return on Investment (ROI)
ROI represents the number generated from a firm’s assets to measure the level of financial efficiency or the firm’s performance. It is obtained by calculating the operating profit against capital employed. ROI is also referred to as ROCE(Sasikala, R., & Balakrishnan, K. P. (2016)).
Figure 5. Return on Investment (ROI)
The ROI increase in Figure 5 occurred in 2012-2014 and 2014 got the highest increase in the last four years. This increase was due to an increase in operating profit. Furthermore, the highest increase in 2014 was due to an increase in the demand of plastic and cement industries by 8% and 10% respectively. The increased demand for plastic was triggered by several factors, such as the growth of food and beverage and automotive industries. However, the ROI appeared to decrease in 2014-2016, which was expected due to the weakening of the Indonesian economy since 2015 that reduced the purchasing power of the people on basic needs, resulting in a decrease in operating profits.
Net Profit Margin (NPM)
Licensed under Creative Common Page 902
Figure 6. Net Profit Margin (NPM)
Based on Figure 6, the NPM for basic industry and chemicals sector tends to fluctuate. The NPM in the basic industry and chemicals sector ranged between 3.12% and -2.44%. The lowest point, which is in 2015, shows the small net profit resulting from sales. The low NPM ratio indicates that the efficiency of firms’ operational activities was decreased. In addition, the low NPM ratio of basic industry and chemicals sector was due to the decrease in sales. This sales decrease led to a significant decrease in profits in this sector.
Operating Cash Flow (OCF)
OCF represents the amount of money generated by firms from their operations. The OCF numbers is obtained from firms’ cash flow statement and then divided by total assets. OCF measurements can be used to compare performance with other firms (Dasti, M., Zadeh, S. H., & Sharifi, M. (2016)).
Licensed under Creative Common Page 903
Based on Figure 7, the OCF of basic industry and chemicals sector experienced fluctuation, even though there has been a slight increase in 2012-2014. The decrease of the OCF also coincided with the decrease of OPG. This happened simultaneously because of the lack of money, which can obstruct operations. Despite the decrease, the OCF value was still in the positive category in the range of 4.17% to 7.96%. A positive OCF allows firms to finance more conservative operational working capital in order to increase future sales growth. However, firms with negative OCF need to use other sources of funding to finance a positive operational working capital38,39. In addition, in 2015, the OCF was decreased, which was due to an increase in operating cash flow that was not as big as the total assets.
Earning Per Share (EPS)
EPS is calculated by dividing net income by the number of outstanding shares, this ratio is an indicator to measure the performance of a firm in terms of the profitability. From an investor perspective, higher EPS is better since it indicates the business prospects of the firm in the future is better and it has a higher potential of growth opportunities. This condition allows the return rate received by investors to be higher (Haque, S., & Faruquee, M. (2013)).
Figure 8. Earning Per Share (EPS)
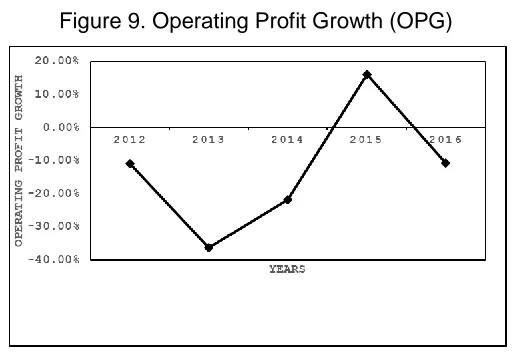
Licensed under Creative Common Page 904 Operating Profit Growth (OPG)
This ratio is used to measure the percentage increase in the operating profit of a firm at a certain period between two observation periods (Farrokh, M., Heydari, H., & Janani, H. (2016)). Therefore, the percentage increase or decrease in operating profit run by the firm can be identified.
Figure 9. Operating Profit Growth (OPG)
In contrast to SG, OPG decreased in 2012 to 2013, then it experienced a sharp increase in 2013 to 2015. By 2015, OPG has decreased again. Despite the significant increase in 2013 to 2016, OPG is still in the negative category area. The decrease of OPG was due to the sharp decrease in the operating profit in 2013, which was the impact of limited local raw materials available and the majority of industries still depend on imports of raw materials from abroad. In contrast to the year 2014, basic industry and chemicals sector actually showed better achievements than the previous year. This achievement was based on the rapid growth of non-machinery metal goods industry and cement industry. This growth was one of the impacts of the government’s policies that seek to accelerate the development of infrastructure so as to make entrepreneurs or investors to enter into these industries.
Sales Growth (SG)
Licensed under Creative Common Page 905
Figure 10. Sales Growth (SG)
Based on Figure 10, the sales of basic industry and chemicals sector decreased sharply in the period of 2012-2013. It then increased in 2013, decreased in 2014, and increased again in 2015. Increases in 2013-2014 and 2015-2016 took place with the increasing demand for chemicals. The sector most benefited from the increasing demand for such materials include the plastic and cement sectors. Firms must be able to take advantage of the moment, and the increasing need for chemicals in the basic industry sector should be anticipated by the firms by encouraging growth and development of factories and encourage investors to engage for long-term goals in order to increase market opportunities. The larger the market shares owned by the firms means the greater the opportunity for the firms to make higher sales volume.
Return on Capital Employed (ROCE)
The success of a firm’s performance, especially in financial terms, can be measured using the ROCE ratio. It measures the ratio between operating profit to total capital employed (Sasikala, R., & Balakrishnan, K. P. (2016)). The ROCE used to identify the operating returns of a firm’s own assets and long-term funds is also used by investors to identify the added value of the funded assets in generating profits from the operations of the firm.
Licensed under Creative Common Page 906
The ROCE increase in Figure 11 occurred since 2012 and 2014 was the highest in the last four years. This increase in operating profit in 2014 was due to an increase in the demand of plastic and cement industries by 8% and 10% respectively. The increased demand for plastic was triggered by several factors, such as the growth of food and beverage and automotive industries. However, the ROCE appeared to decrease since reaching its peak in 2014 until the end of 2016. This is presumably occurred due to the weakening of the Indonesian economy since 2015, which caused a decrease in people's purchasing power over basic needs and caused the firms’ sales to decrease.
Cash Stocks (CSA)
Cash stocks is an indicator of firms’ liquidity (Silva, F., & de Carvalho, A. (2015)). Cash stocks are measured by looking at the total assets owned by firms’, where firms with larger cash stocks have bigger chance to survive when the market conditions in the future experience negative shocks. This can happen when large cash stocks are used by firms to take on more lucrative investment opportunities in the future, which can also help them when external financing is difficult to obtain.
Figure 12. Cash Stocks (CSA)
Licensed under Creative Common Page 907 Total Assets Turnover Ratio (TATO)
TATO is the ratio of the sales value or revenue generated by firms relative to the total assets. This ratio also shows how effective is the firms in generating sales (Wagner, J. (2002)). In general, the higher this ratio means the better performance of the firms. This can be proved when the firms generate more revenue per asset owned.
Figure 13. Total Assets Turnover Ratio (TATO)
The TATO ratio of basic industry and chemicals sector decreased in 2012-2013. In 2013-2014, the TATO experienced an increase, but decreased again in the following year and increased again in 2015. One of the reasons of the TATO decrease is the decrease of the sales value generated by the firms. However, the total assets in this sector were increased. It can be said that the firms have not been able to optimally use the owned assets to generate sales for them, which can impact the firms’ stock in this sector. For example, in the third quarter of 2015, the basic industry and chemicals sector index was at the lowest level under various industry sectors at minus 2.1%. The firms that have big influence on sectoral stock prices were firms from the cement sector, namely INTP and SMGR. Both firms were reported to weaken by 3.8% and 3%. From the above conditions, it can be said that the decrease in the sales of basic industry and chemicals sector brought a bad influence on investment activities undertaken by investors, especially for investors who invest in this sector. The firms are increasingly demanded to be sustained and they should consider this factor because it is important for their sustainability.
Labor Productivity (LP)
Licensed under Creative Common Page 908
productivity from the production side, expensive labor costs in producing the value of products or services is also the reason of the use of this factor to measure the performance of a firm.
Figure 14. Labor Productivity (LP)
The decrease in labor productivity from year to year can be seen in Figure 14. From 2012 to 2016, labor productivity in basic industry and chemicals sector has been decreasing. The decrease in the average sector productivity was due to the decreasing rupiah exchange rate. Since this industry mostly depends on imported raw materials, the decreasing exchange rate of rupiah certainly disrupted the production process of the firms, especially in terms of procurement. Furthermore, the decrease in productivity of the basic industry and chemicals sector can also affect investment interests, especially stocks. An example is the sharpest decrease in basic industry and chemicals sector indexed in the third quarter of 2015 at the level of 2.82% or minus 9,605 points that became a challenge for businessmen to minimalize losses. The solutions for the dependence of imported raw materials include the firms to substitute the raw materials to something processed in the country. In terms of labor, firms should make full efforts to improve the quality of skilled labor to fulfill the expectation of the increasingly fierce competition.
Profit per Employee (PPE)
Licensed under Creative Common Page 909
Figure 15. Profit per Employee (PPE)
Based on Figure 15, the decreasing PPE until the end of 2015 represents the productivity of the basic industry and chemicals sector that was getting weak, in which one of the reasons may be the low quality of employees that impact the low competitiveness. Based on data from the Central Bureau of Statistics (BPS) in 2015, about 26% of the labor force was dominated by elementary school (SD) graduates. The limited qualified human resources were also a problem when firms or industries want to get qualified workers, especially in 2015 when the national labor force must face more challenging external challenges; the ASEAN Economic Community (MEA) agreement requires employers and employees to be able to compete on a global scale. Furthermore, not only because of the issue of labor, the decrease in basic industry and chemicals sector profits in 2015 was likely served as a result from a decrease in the public’s purchasing power due to the soaring prices of basic commodities and the government policy’s targets from the tax side that were too high. This condition also certainly made investors hesitant to invest in sectors or industries affected by this economic downturn to avoid high risks.
Gross Profit Margin (GPM)
GPM shows the total increase between cost of goods sold (COGS) and sales revenue (Shahzad, F., Ahmed, N., Fareed, Z., Zulfiqar, B., & Naeem, F. (2015)). This measurement is intended to determine the efficiency of a firm in generating each unit of product. GPM is obtained by subtracting sales with COGS then divided by sales.
Licensed under Creative Common Page 910
Based on Figure 16, the GPM increased in 2012-2014, decreased in 2014-2015, and increase again in 2015-2016. The increase in GPM was due to a significant increase of profit margins in this sector. Similarly, the decrease in GPM was the impact of the decreased of profits obtained by firms. The decrease of GPM in 2015 may be influenced by increased sales expenses. Since basic industry and chemicals sector depends on the imports of raw materials of production, it can be said that this decrease was the impact of the rising costs of production. In addition, this condition also caused the decrease in the index of basic industry and chemicals sector because most investors may not want to take high risks when basic industry and chemicals sector was in a difficult position.
Earnings Before Interest, Taxes, Depreciation, and Amortization Margin (EBITDA Margin)
EBITDA is used to measure income flows before interest and taxes (Kaen, F. R., & Baumann, H. D. (2003)). It is an important proxy for measuring the profitability of a firm’s operations before interest expense and depreciation and amortization. EBITDA margin is calculated by dividing EBITDA by total revenue.
Figure 17. Earnings Before Interest, Taxes, Depreciation, and Amortization Margin (EBITDA Margin)
Licensed under Creative Common Page 911 CONCLUSION
All the ratios that have been presented are important parts of assessing performance in basic industry and chemicals sector. First, better ability of firms to generate profits that are presented by the ratios (ROA, ROE, ROI, NPM, GPM, ROCE, OCF, OPG, EPS, TATO, and MARGIN EBITDA) will be able to attract investors to invest in their business development. In contrast, a low profitability rate will cause investors to cancel their investments. Second, the high liquidity measured through the CSA ratio, which describes the firms’ ability to pay their debts or payment obligations, is also very important considering that business activities are inseparable with debts or liabilities. Third, ROS and SG are used to measure operational efficiency and PPE and LP to measure labor productivity. From the descriptive analysis, it is known that the decrease of basic industry and chemicals sector’s performance is caused by the decrease of the operational activity, which is caused by the limited supply of raw materials in Indonesia. Therefore, firms are dependent on imported raw materials while the price of imported raw materials often increases due to the impact of US dollar. These conditions certainly affect the production process, which also result in the decreasing sales, and sales decreases affect the gaining of profit. Furthermore, lower earnings will decrease the cycle of stock investment to the sector. This decreasing profit, which is a result of this internal factor, and external factors (such as government policies) that are considered to be detrimental to the sector, can certainly affect the flow of incoming funds from investors.
Licensed under Creative Common Page 912 REFERENCES
Voulgaris, F., & Lemonakis, C. (2014). Competitiveness and profitability: The case of chemicals, pharmaceuticals and plastics. The Journal of Economic Asymmetries, 11, 46-57.
Purwanto, P., & Agustin, J. (2017). Financial Performance towards Value of Firms in Basic and Chemicals Industry. European Research Studies, 20(2), 443.
Chemicals Industry. European Research Studies Journal.
Muhammad, H., Shah, B., & ul Islam, Z. (2014). The impact of capital structure on firm performance: evidence from Pakistan. Journal of Industrial Distribution & Business, 5(2), 13-20.
Shahzad, F., Ahmed, N., Fareed, Z., Zulfiqar, B., & Naeem, F. (2015). Corporate governance impact on firm performance: evidence from cement industry of Pakistan. European researcher. Series A, (1), 37-47.
Farrokh, M., Heydari, H., & Janani, H. (2016). Two comparative MCDM approaches for evaluating the financial performance of Iranian basic metals companies. Iranian Journal of Management Studies, 9(2), 359.
Moghimi, R., & Anvari, A. (2014). An integrated fuzzy MCDM approach and analysis to evaluate the financial performance of Iranian cement companies. The International Journal of Advanced Manufacturing Technology, 71(1-4), 685-698.
Naz, F., Ijaz, F., & Naqvi, F. (2016). Financial Performance of Firms: Evidence from Pakistan Cement Industry.Journal of Teaching and Education, 5(1), 81-94.
Khidmat, W., & Rehman, M. (2014). Impact of liquidity and solvency on profitability chemicals sector of Pakistan. Economics Management Innovation, 6(3), 34-67.
Silva, F., & de Carvalho, A. (2015). Evaluating the Financial Health of the Steel Industry. Paris, France: OECD.
Abbadi, S. M., & Abbadi, R. T. (2012). The determinants of working capital requirements in Palestinian industrial corporations. International Journal of Economics and Finance, 5(1), 65-75.
Ernayani, R., & Robiyanto, R. (2016). The Effect of the Cash Flows, Gross Profit and Company Size on Indonesian Stock Returns (A Study on the Chemicals and Basic Industry Companies During the Periods of 2009-2014). International Journal of Applied Business and Economic Research,14(3),1697-1709. Wan, H., & Zhu, K. (2011). Is investment–cashflow sensitivity a good measure of financial constraints?. China Journal of Accounting Research, 4(4), 253-270.
Pour, A, Z. (2016). A comparative study on the effects of profitability and operating cash flow on the trademarks at different industries. International Journal of Humanities and Cultural Studies, 1874-1882. Dasti, M., Zadeh, S. H., & Sharifi, M. (2016). A Study and Comparison of the Effect of Profitability and Operating Cash Flow on Trademarks Value in Different Industries. International Journal of Humanities and Cultural Studies (IJHCS) ISSN 2356-5926, 1986-1995.
Vijayalakshmi, S., & Bansal, N. (2013). Determinants of Working Capital in Cement Industry-A case study of ACC Ltd. Pacific Business Review International, 6(1), 45-50.
Gill, A. (2011). Factors that influence working capital requirements in Canada. Economics and Finance Review, 1(3), 30-40.
Hunjra, A. I., Ijaz, M. S., Chani, M. I., ul Hassan, S., & Mustafa, U. (2014). Impact of Dividend Policy, Earning per Share, Return on Equity, Profit after Tax on Stock Prices. International Journal of Economics and Empirical Research, 2(3), 109-115.
Arefin, S., & Pervin, T. (2016). Financial Ratios Analysis and The Impact Of Earning Potential Ratios Of A Company On Its Market Price Of Stock - A Study On Pharmaceutical And Chemicals Industries Of Bangladesh. IOSR Journal of Business and Management, 18(2), 25-33.
Licensed under Creative Common Page 913 Cheema, K. U. R., & Din, M. S. (2013). Impact of corporate governance on performance of firms: A case study of cement industry in Pakistan. Journal of Business and Management Sciences, 1(4), 44-46.
Jatoi, M. Z., Shabir, G., Hamad, N., Iqbal, N., & Muhammad, K. (2014). A Regressional impact of earning per share on market value of share: A case study cement industry of Pakistan. International Journal of Academic Research in Accounting, Finance and Management Sciences, 4(4), 221-227.
Sasikala, R., & Balakrishnan, K. P. (2016). Growth and Profitability of Selected Cement Industries in India. Journal of Academia and Industrial Research (JAIR), 5(1), 5.
Haque, S., & Faruquee, M. (2013). Impact of Fundamental Factors on Stock Price: A Case Based Approach on Pharmaceutical Companies Listed with Dhaka Stock Exchange. International Journal of Business and Management Invention, 2(9), 34-41.
Kamatra, N., & Kartikaningdyah, E. (2015). Effect Corporate Social Responsibility on Financial Performance. International Journal of Economics and Financial Issues, 5, 157-164.
Pflug, K. (2014). Correlation between Sales and Profit Development and Ownership Type in the Chinese Chemicals Industry. Journal of Business Chemistry, 11(3), 133-141.
Bryan, L. L. (2007). The New Metrics of Corporate Performance:ProfitPer Employee. The McKinsey Quarterly,1, 57-65.
Bayyurt, N., & Duzu, G. (2008). Performance measurement of Turkish and Chinese manufacturing firms: A comparative analysis. Eurasian Journal of Business and Economics, 1(2), 71-83.
Hakro, A. N., & Akram, M. (2009). Pre-Post performance assessment of privatization process In Pakistan. International Review of Business Research Papers, 5(1), 70-86.
Liu, L., Miao, R., & Li, C. (2007). The impacts of enterprise resource planning systems on firm performance: an empirical analysis of Chinese chemicals firms. In Research and Practical Issues of Enterprise Information Systems II (pp. 579-587). Springer, Boston, MA.
Iwata, H., & Okada, K. (2011). How does environmental performance affect financial performance? Evidence from Japanese manufacturing firms. Ecological Economics, 70(9), 1691-1700.
Wagner, M., Van Phu, N., Azomahou, T., & Wehrmeyer, W. (2002). The relationship between the environmental and economic performance of firms: an empirical analysis of the European paper industry. Corporate Social Responsibility and Environmental Management, 9(3), 133-146.
Makki, M. M., & Lodhi, S. A. (2009). Impact of intellectual capital on return on investment in Pakistani corporate sector. Australian Journal of Basic and Applied Sciences, 3(3), 2995-3007.
Ertuğrul, İ., & Karakaşoğlu, N. (2009). Performance evaluation of Turkish cement firms with fuzzy analytic hierarchy process and TOPSIS methods. Expert Systems with Applications, 36(1), 702-715.
Wagner, J. (2002). The causal effects of exports on firm size and labor productivity: first evidence from a matching approach. Economics Letters, 77(2), 287-292.
Heshmati, A., & Rashidghalam, M. (2016). Labour Productivity in Kenyan Manufacturing and Service Industries. IZA Discussion Paper, (9923).
Dehning, B., Richardson, V. J., & Zmud, R. W. (2007). The financial performance effects of IT-based supply chain management systems in manufacturing firms. Journal of Operations Management, 25(4), 806-824.
Díaz, Y. C., Berriel, S. S., Heierli, U., Favier, A. R., Machado, I. R. S., Scrivener, K. L., Hernández, J. F. M.,& Habert, G. (2017). Limestone calcined clay cement as a low-carbon solution to meet expanding cement demand in emerging economies. Development Engineering.
Appuhami, B. R. (2008). The impact of firms' capital expenditure on working capital management: An empirical study across industries in Thailand. International Management Review, 4(1), 8.
Licensed under Creative Common Page 914 Kaen, F. R., & Baumann, H. D. (2003). Firm size, employees and profitability in U.S. manufacturing industries. Soc. Sci. Res. Net., 13, 71-79.
Pidun, U., & Wolff, M. (2007). Value Management In Weakly Growing Industries An Empirical Analysis Using TheChemicals Industry As An Example. Corporate Ownership & Control, 5(1), 31-37.
Santi, J.C. (2015). Perusahaan Semen Tertekan. [online].
http://ekonomi.kompas.com/read/2015/01/20/003615726/Perusahaan.Semen.Tertekan. [Diakses 3 Oktober 2017].
Gideon, A. (2015). Industri Berbahan Baku Impor Paling Terpukul. [online]. http://news.liputan6.com/read/2262001/industri-berbahan-baku-impor-paling-terpukul. [Diakses 3 Oktober 2017].
Kementerian Perindustrian Republik Indonesia (Kemenperin RI). (2014). 64% dari Industri Nasional Bergantung pada Bahan Baku Impor. [online]. http://www.kemenperin.go.id/artikel/9306/64-dari-Industri-Nasional-Bergantung-pada-Bahan-Baku-Impor4. [Diakses 3 Oktober 2017].
Badan Pusat Statistik (BPS). (2017). Penduduk Berumur 15 Tahun Ke Atas Menurut Pendidikan Tertinggi yang Ditamatkan dan Jenis Kegiatan Selama Seminggu yang Lalu, 2008-2017. [online]. https://www.bps.go.id/linkTabelStatis/view/id/1909. [Diakses 3 Oktober 2017].
Cakti, G.A. (2015). INDEKS SEKTORAL 27 Oktober: Sektor Industri Dasar dan Kimia Turun Paling Tajam, Tertekan INTP dan SMGR. [online]. http://market.bisnis.com/read/20151027/7/486250/indeks-sektoral-27-oktober-sektor-industri-dasar-dan-kimia-turun-paling-tajam-tertekan-intp-dan-smgr. [Diakses 3 Oktober 2017].
Khamdi, M. (2014). Permintaan Plastik Naik, Industri Kimia Dasar Diprediksi Tumbuh 8%. [online].
http://industri.bisnis.com/read/20140219/257/204547/permintaan-plastik-naik-industri-kimia-dasar-diprediksi-tumbuh-8. [Diakses 3 Oktober 2017].
Indonesia Stock Exchange (IDX). (2017). Yearly Statistics. [online]. http://www.idx.co.id/id-id/beranda/publikasi/statistik.aspx. [Diakses 21 September 2017].
Indonesia Stock Exchange (IDX). (2017). Laporan Keuangan & Tahunan. [online]. http://www.idx.co.id/id-id/beranda/perusahaantercatat/laporankeuangandantahunan.aspx. [Diakses 23 September-13 Oktober 2017].
Indonesia Stock Exchange (IDX). (2017). Fact Book. [online]. http://www.idx.co.id/id-id/beranda/publikasi/factbook.aspx. [Diakses 27 September 2017].
APPENDIX (List of Firms as Samples)
Number Firm’s Name Firm’s Stock Name
1. Indocement Tunggal Prakarsa Tbk. INTP
2. Holcim Indonesia Tbk. SMCB
3. Semen Indonesia (Persero) Tbk. SMGR
4. Asahimas Flat Glass Tbk. AMFG
5. Arwana Citramulia Tbk. ARNA
6. Intikeramik Alamasri Industri Tbk. IKAI 7. Keramika Indonesia Assosiasi Tbk. KIAS
8. Mulia Industrindo Tbk. MLIA
9. Surya Toto Indonesia Tbk. TOTO
10. Alakasa Industrindo Tbk. ALKA
11. Alumindo Light Metal Industry Tbk. ALMI 12. Saranacentral Bajatama Tbk. BAJA
13. Betonjaya Manunggal Tbk. BTON
14. Citra Tubindo Tbk. CTBN
Licensed under Creative Common Page 915 16. Indal Alumunium Industry Tbk. INAI
17. Jakarta Kyoei Steel Works Tbk. JKSW
18. Jaya Pari Steel Tbk. JPRS
19. Krakatau Steel (Persero) Tbk. KRAS
20. Lion Metal Works Tbk. LION
21. Lionmesh Prima Tbk. LMSH
22. Pelat Timah Nusantara Tbk. NIKL 23. Tembaga Mulia Semanan Tbk. TBMS
24. Barito Pacific Tbk. BRPT
25. Duta Pertiwi Nusantara Tbk. DPNS 26. Ekadharma International Tbk. EKAD 27. Intanwijaya Internasional Tbk. INCI
28. Indo Acidatama Tbk. SRSN
29. Chandra Asri Petrochemicals Tbk. TPIA
30. Unggul Indah Cahaya Tbk. UNIC
31. Argha Karya Prima Industry Tbk. AKPI 32. Asiaplast Industries Tbk. APLI
33. Berlina Tbk. BRNA
34. Lotte Chemicals Titan Tbk. FPNI 35. Champion Pacific Indonesia Tbk. IGAR 36. Indopoly Swakarsa Industry Tbk. IPOL
37. Sekawan Intipratama Tbk. SIAP
38. Siwani Makmur Tbk. SIMA
39. Trias Sentosa Tbk. TRST
40. Yanaprima Hastapersada Tbk. YPAS 41. Charoen Pokphand Indonesia Tbk. CPIN 42. Japfa Comfeed Indonesia Tbk. JPFA
43. Malindo Feedmill Tbk. MAIN
44. Sierad Produce Tbk. SIPD
45. SLJ Global Tbk. SULI
46. Tirta Mahakam Resources Tbk. TIRT
47. Alkindo Naratama Tbk. ALDO
48. Fajar Surya Wisesa Tbk. FASW
49. Indah Kiat Pulp & Paper Tbk. INKP
50. Toba Pulp Lestari Tbk. INRU
51. Kertas Basuki Rachmat Indonesia Tbk. KBRI
52. Suparma Tbk. SPMA