IJSRR, 8(2) April. – June., 2019 Page 2105
Research article Available online www.ijsrr.org
ISSN: 2279–0543
International Journal of Scientific Research and Reviews
An Empirical analysis of Customer intention to use Smart Cards
Rajbir Kaur, Vikas Kumar* and Amanjot Singh Syan
University Business School, Guru Nanak Dev University, Amritsar (Punjab India, Email: - [email protected]
ABSTRACT:
The present research aims to understand the customer intention to use smart cards in the
Indian context. The present study is based on 476 respondents which have been collected using
convenient sampling. Exploratory factor analysis, confirmatory factor analysis, and multiple
regression analysis have been applied to examine dimensions’ impact on customer intention. The
results of multiple regression analysis validated that customer intention towards smart cards is
significantly determined by trustworthiness, intention to use, value for money, social influence, ease
of use, and government initiatives.
KEYWORDS: customer intention; value for money; government initiatives; confirmatory factor analysis; multiple regression analysis; smart cards.
*Corresponding Author:
Dr. Vikas Kumar
Assistant Professor*, University Business School,
Guru Nanak Dev University, Amritsar (Punjab) India
IJSRR, 8(2) April. – June., 2019 Page 2106
INTRODUCTION
As the years passed, we found several changes in the form of money ranging from coins to
paper and now to any form 1-4. Developing at two-fold digit rates since the mid-1990s, there has been
a boom in the market place since 2003 5-7. Nowadays everything is changed with emerging
technology and similarly money has turned out to be electric money which can be used through
smart cards 8-13. Smart cards are an integrated payment system which will help a customer to make
and receive payment without having any physical card by integrating a mobile application with the
bank's database 14-18.Today, notwithstanding money, electronic cash cards, credit cards, smart cards,
debit cards, online fund transfers, and even countertrade has empowered clients to purchase as well
as utilize the items they need 19-22. Payment cards have been around for quite a while now and with
them, the comfort of stashing plastic cards has been found and delighted 23-26. Presently, the
transaction cards are being replaced by smart cards in the next generation 27-29. Despite the
never-ending benefits of using the smart cards the intentions of users are not positive especially in the rural
areas in India 30-31.
Research Gap
Previously many studies have focused on the economic aspect of smart cards and various
incentives a consumer gets by using a smart card 32, 10. In addition to above, social influence on users
for using the smart cards has been focused much by the researchers 33, 9, 25.However, as the concept
of the smart card is new for Indian customers, the social influence and economic benefits only cannot
properly address the problem of non-acceptance. Moreover to explain why people use innovative and
modern technological system, researchers in user acceptance research stream have pinned various
established theories of consumer behaviour, such as the Theory of Reasoned Action (TRA), the
Social Cognitive Theory (SCT), Theory of Planned Behavior (TPB), and the Innovation Diffusion
Theory (IDT). Based on these theories, various model like the technology acceptance model (TAM)
was developed. Each model has its own independent and dependent factors for user acceptance
although there are many overlaps in all the existing models 1, 34,35,32,36,37,6. Thus this study derives the
various latent contracts from different behavioural theories to explain the problem more extensively
and in more depth. As a result, this study attempts to cover the gap of knowledge in existing and the
previous literature. Henceforth, this study aims to explore the antecedents affecting the intention of
the users to use smart cards. The objective of this study are twofold, as it addresses specifically the
question of why people use a system in a particular context, because it will lead to insights as to what
factors in the system that causes people to choose it over other available options and secondly the
IJSRR, 8(2) April. – June., 2019 Page 2107
Organization of the Study
The study is organized into various sections. The very first part includes an introduction,
importance of the smart cards, theoretical background and hypothesis, various dimensions of smart
cards, research gap, and objective of the research. The hypothesis is also established and explained.
Further, in the methodology section the research design is described including data collection, a
demographic profile of the respondents, and data analysis. The results have been discussed in the last
section followed by discussions, implication, recommendations, and limitations of the research.
CONCEPTUAL FRAMEWORK AND HYPOTHESIS FORMULATION
As far as the review of the previous studies was concerned, the various variables having their
impact upon customers’ intention dominantly are trustworthiness, intention to use, value for money,
social influence, ease of use, and government initiatives. The literature discussed below explains the
classification of the variables that have an impact on users' intention in the context of smart cards.
Value for Money
Sudies depicted the impact of the value of money on consumer satisfaction with regard to
online purchases 38. Additionally, smart cards also help to make information clear, interactive
between the parties, simplify the purchase, and sale process 1, 39-41. These also help the consumers to
make a purchase decision at a given point of time in a better way 5, 34,36,6. Previous studies explained
that smart cards affect consumer buying behavior 8, 42-44. These studies also evidenced that the smart
cards increase the spending of consumers with high self-control 23, 32, 29, 45. It is also suggested that
this effect can be decreased by increasing the credit availability on credit card 30, 2,46,31,47. Use of credit card provides the benefit of spending now and repaying later 14,37,24,12. This can prove
beneficial in case of unplanned expenditure and emergencies 19, 28, 25.
Social Influence
Earlier it was presumed that smart cards are being used by high-income group only but with
the extension of this facility, these are not only used by urban customers but also by rural customers
27, 20
. With the development of banking and commercial sector fixed income groups have also started
the use of the plastic and electronic money 33, 48, 13. Many studies have evidenced a positive impact
on the lives of people from every sphere of life. These are used as an easier way of payment in the
modern era 65, 36, 9, 42, 41. Furthermore, the competitive cost of credit card leads to overconsumption
because they distort competition within the credit industry 23, 34, 37, 49. Plastic money means lesser use
IJSRR, 8(2) April. – June., 2019 Page 2108
Ease of Use
In any developed economy usability of a medium of exchange is dependent upon the
development of e-commerce 1, 9, 40. By clarifying usage goal from the bank clients’ viewpoint the
findings of this examination will not just assist business saves money with developing better
user-accepted smart card systems, yet additionally give bits of knowledge to the potential customers the
newly emerging context of smart cards 5, 48. More the benefits a bank offer to customers more is the
uses of cards 27. Previous studies evidenced that plastic money helps to access and manage accounts
more easily through debit card, credit card and prepaid card 19, 25. Using bank cards instead of cash
helps in removing the hassle and risk of carrying big bundles of cash everywhere 8, 6, 11.With plastic
cards in one’s pockets, any transaction, however big or small, can be made and one is free from the
tension of keeping safe the currency notes 30, 42, 17, 21. Risk of theft or accidental loss of money can be
eliminated with the use of plastic money 23, 37, 16, 43. Transactions made with cash alternatives can be
made without any prior planning of securing the exact amount of currency notes and carrying them
over to the payee 65, 24. People can shop, pay bills, and transfer funds sitting in the comfort of their
homes 33, 45, 3. It has become easy for travelers as they don’t have to carry cash anymore 34, 28, 4.
Increase in the number of Point of sale (POS) and ATMs have helped popularize these alternatives to
cash 36, 15, 51, 41.
Trustworthiness
The studies have shown that with the increase in the loyalty of smart card technology there is
favorable response towards the use of smart cards 39, 18. Loyal and satisfied customers promote these
cards because of their attributes because a motivated customer believes more on the recommendation
of further customers because of his quality belief 14, 20, 52. Therefore, more the values a customer
receives more he is motivated to remain loyal and promote the cards and thereby resulting in positive
consumer response 19, 28, 40. Thus, it is suggested that loyalty promotes positive word of mouth and
increase the uses of smart cards 27, 39, 13. Every transaction made with credit or debit cards is
recorded which provides a clear link of the source of payments and receivers 1, 37, 17, 44. This proves
immensely beneficial in order to establish the source of money and catch any fraudulent and
unaccounted move of money in the economy 30, 32, 24, 22.
Government Initiatives
The present central government has a number of ambitious programmes and flagship schemes
to take pride in. Amongst the most promoted is the ‘Digital India’ dream of Prime Minister Narendra
IJSRR, 8(2) April. – June., 2019 Page 2109
social security to India’s unorganised sector's workers, the government is planning to issue smart
cards for various advantages to the service sector 8, 37, 52. The card, which will be called the
Unorganised Workers’ Identification Number or UWIN card, will be issued by district collectors
under the Unorganised Workers Social Security Act to enable different ministries to provide services
to such workers on a single card 5, 34, 48, 26, 43, 4. There is a huge potential for the use of plastic money
in India. Apart from providing enhanced convenience to the customers, plastic money can ensure
transaction secrecy and integrity to them 65, 36, 15. With demonetization, as the interest rates can go
down, the use of plastic money can get further encouraged 27, 53, 25, 7. Also, like the use of credit cards
and other such options, your credit rating, and CIBIL score will improve, leading to better chances of
availing loans 14, 11, 51. The banking service sector can benefit a lot from this move 54, 18, 47. With
quick payment method, plastic money can ensure higher customer retention for banks with an
enhanced level of customer satisfaction 23, 48, 45, 21. The government can also plug leakages of
government funds as plastic money will ensure electronic payment 65, 24, 17. If the government starts
to use plastic money, it will enable effective resource allocation with fewer chances of corruption 34,
39, 44
. Also, there will be no forgery headaches with plastic money having a lifespan more than four to
five times of paper money 8, 33, 52, 17.
Intention to Use
Consumers have secure, convenient, and reliable means of payment with the help of the smart
cards 14, 54, 49, 40. Studies documented that the payment through the smart card is easier than paying
with cash, especially while traveling 7, 2, 43, 41. Likewise, smart cards can be used for hotel bookings
and advance online airline payment, where money exchanges are not possible 5, 2, 3. Studies have
proved that use of plastic money has increased business of retail, the distribution also provides cost
benefits and suggested many measures to avoid frauds 30, 48. There are many shreds of evidence
which prove that these cards are in wider use for making purchases as well as cash withdrawals 8, 33,
11, 49, 29
. The use of plastic cards has bought the world towards a cashless society 1, 10, 49, 13. Making
purchases using credit or debit cards is time and cost saving as one does not have to travel all the
way to the seller to make payments providing card details over the internet suffices 19, 39, 26, 22.
Hypotheses Formulation
Following are the hypothesis:-s
H01 - There is no impact of ‘value for money’ dimension on customers’ intention to use smart
IJSRR, 8(2) April. – June., 2019 Page 2110
H02 - There is no impact of ‘social influence’ dimension on customers’intention to use smart
cards.
H03 - There is no impact of ‘ease of use’ dimension on customers’ intention to use smart
cards.
H04 - There is no impact of ‘trustworthiness’ dimension on customers’ intention to use smart
cards.
H05 - There is no impact of ‘government initiatives’ dimension on customers’ intention to use
smart cards.
METHODOLOGY
In order to examine the customer intention towards smart cards item generation, refinement,
and validity process was used. For the generation of the items, an extensive literature review of
previous studies was carried out. The scale was modified as the requirement of the current objective.
The comments of the experts were invited and researchers were also consulted for making the
construct more effective and useful. The final scale was tested for reliability and validity of the scale.
A five-point Likert scale ranging from strongly agrees to strongly disagree has been used to collect
the information from respondents 71. For dimension reduction, exploratory factor analysis was used
and finally, confirmatory factor analysis was applied to verify the factor structure and their loadings 55-58
.
Demographic Profile
The demographic profile consists of 48.32 per cent male and 51.68 per cent female
participated in the survey. Moreover, 26.26 per cent of the respondents belonged to the age group of
18-27, followed by 25.63 per cent in the age group of 28-37; 25.24 per cent in the age group of
38-47; and 22.69 per cent were falling in the age group of 48-57. In the case of marital status, 72.69 per
cent were married and 27.31 per cent respondents were unmarried. As far as the education of the
respondents’ is concerned 18.49 per cent respondents belonged to matriculation; followed by 25.63
per cent were belong to higher secondary; 32.77 per cent belonged to graduation and 23.11 per cent
belonged to the respondents who have done post graduation.
Factor Analysis
Exploratory factor analysis was conducted by using principal component analysis in order to
identify the set of underlying factors and constructs having an eigen value less than unit were finally
ignored. In table 1 all the extracted variables along with their communalities are shown and the
IJSRR, 8(2) April. – June., 2019 Page 2111
Table 1. KMO and Bartlett's Test
Kaiser-Meyer-Olkin Measure of Sampling Adequacy. 0.769
Bartlett's Test of Sphericity Approx. Chi-Square 13674.300
Cronbach's Alpha (Sample Size=476) 0.760
Number of Items 23
Df 253
Sig. 0.000
Source: Compiled from SPSS 20 output
Bartlett’s test of sphericity (13674.300) and Kaiser-Meyer-Olkin measure of sampling
adequacy (0.769) has been shown in table 1. The Cronbach’s alpha comes out to be 0.760 which is
considered satisfactory for factor analysis 55, 57, 59. Cronbach’s alpha of an individual dimension is
also above the satisfactory level (0.7). So, all six dimensions were considered reliable 60, 58.
Table 2. Rotated Component Matrix
Items Component
1 2 3 4 5 6
V8 .964
V10 .956
V9 .954
V11 .948
V14 .850
V7 .976
V23 .974
V5 .931
V6 .926
V18 .951
V19 .944
V21 .931
V20 .925
V3 .957
V2 .950
V4 .897
V1 .896
V15 .924
V17 .904
V16 .866
V22 .927
V12 .908
V13 .816
Percentage of Variance Explained 86.655%
Source: Compiled from SPSS 20 output
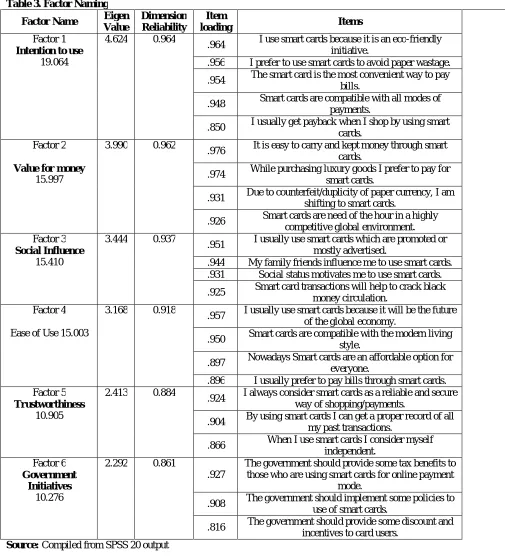
After applying the varimax rotation method, six latent factors were found to be significant
having eigenvalue more than one and accounted for 86.655 per cent of the total variance were
retained for the further analysis. Table 2 represents rotated component matrix which shows that six
factors were extracted having factor loading value more than 0.6. The factor with less than three
variables is generally weak and unstable 60, 56, 59. In addition, the factor loading of the variables must
0.6 in order to determine which items will group into which factors 61, 62, 58. If the value is 0.6, it
depends on the highest factor loading allocate by each of them. As per the standards, the value needs
IJSRR, 8(2) April. – June., 2019 Page 2112
Table 3. Factor Naming
Factor Name Eigen
Value
Dimension Reliability
Item
loading Items
Factor 1
Intention to use
19.064
4.624 0.964
.964 I use smart cards because it is an eco-friendly initiative.
.956 I prefer to use smart cards to avoid paper wastage.
.954 The smart card is the most convenient way to pay bills.
.948 Smart cards are compatible with all modes of payments.
.850 I usually get payback when I shop by using smart cards.
Factor 2
Value for money
15.997
3.990 0.962
.976 It is easy to carry and kept money through smart cards.
.974 While purchasing luxury goods I prefer to pay for smart cards.
.931 Due to counterfeit/duplicity of paper currency, I am shifting to smart cards.
.926 Smart cards are need of the hour in a highly competitive global environment. Factor 3
Social Influence
15.410
3.444 0.937
.951 I usually use smart cards which are promoted or mostly advertised.
.944 My family friends influence me to use smart cards. .931 Social status motivates me to use smart cards.
.925 Smart card transactions will help to crack black money circulation.
Factor 4
Ease of Use 15.003
3.168 0.918
.957 I usually use smart cards because it will be the future of the global economy.
.950 Smart cards are compatible with the modern living style.
.897 Nowadays Smart cards are an affordable option for everyone.
.896 I usually prefer to pay bills through smart cards. Factor 5
Trustworthiness
10.905
2.413 0.884
.924 I always consider smart cards as a reliable and secure way of shopping/payments.
.904 By using smart cards I can get a proper record of all my past transactions.
.866 When I use smart cards I consider myself
independent. Factor 6
Government Initiatives
10.276
2.292 0.861
.927
The government should provide some tax benefits to those who are using smart cards for online payment
mode.
.908 The government should implement some policies to use of smart cards.
.816 The government should provide some discount and incentives to card users.
Source: Compiled from SPSS 20 output
Confirmatory Factor Analysis
After finding out the adequate outcomes of EFA, the CFA has been applied to test the
validity of the underlying constructs. Structural model depicts that all the factors have an influence
on customers' intention to use smart cards.
IJSRR, 8(2) April. – June., 2019 Page 2113
index = 0.975, and Root mean square error of approximation = 0.049. All presented values were
accepted to the threshold level of fit indices 60, 64, 65, 66. To analyse the constructs’ validity, the
convergent and discriminant validity was also measured.
Table 4: Model fit Indices
Indices Ideal Value Recommended By Model fit Indices
P-Value 0.00 Hair et al., 2015 0.000
GFI >0.9 Kline, 2011 0.903
AGFI >0.8 Kline, 2011 0.901
CFI >0.9 Hu and Bentler, 1999 0.975
NFI >0.9 Hu and Bentler, 1999 0.961
IFI >0.9 Fornell and Larcker, 1981 0.976
TLI >0.9 Fornell and Larcker, 1981 0.970
RMSEA <0.8 Bollen, 1989 0.049
Source: Compiled from Amos output
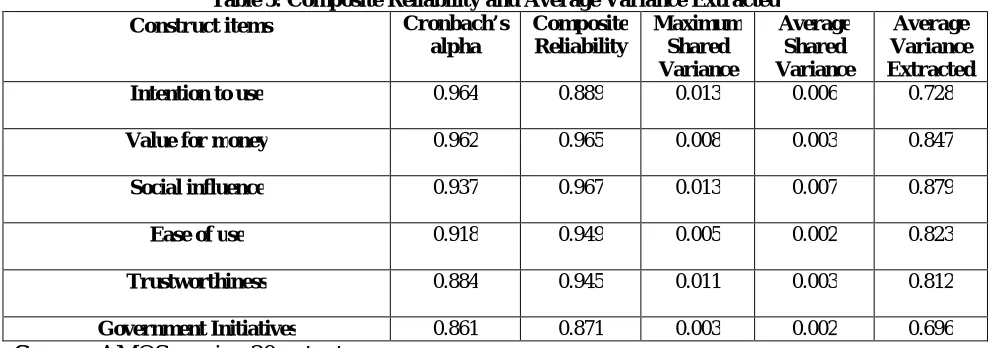
Table 5: Composite Reliability and Average Variance Extracted
Construct items Cronbach’s
alpha Composite Reliability Maximum Shared Variance Average Shared Variance Average Variance Extracted
Intention to use 0.964 0.889 0.013 0.006 0.728
Value for money 0.962 0.965 0.008 0.003 0.847
Social influence 0.937 0.967 0.013 0.007 0.879
Ease of use 0.918 0.949 0.005 0.002 0.823
Trustworthiness 0.884 0.945 0.011 0.003 0.812
Government Initiatives 0.861 0.871 0.003 0.002 0.696
Source: AMOS version 20 output
The discriminant validity was evaluated by comparing the average variance extracted for each
construct with squared correlations between constructs. Table 4 reported that square root of average
variance extracted for each construct was greater than their squared correlations which establish the
adequate discriminant validity 35, 55, 61, 65, 62, 63, 67. The measurement model was found to be valid in
terms of discriminant validity as both MSV and ASV of individual constructs were found to be lower
than their respective average shared variance (AVE) estimates 60, 68.
Table 6: Discriminant Validity
Dimensions Trust- worthiness Intention to use Value for money Social Influence Ease of Use Govt. Initiatives
Trustworthiness 0.853
Intention to use -0.085 0.920
Value for money 0.115 -0.087 0.938
Social Influence 0.073 -0.006 0.050 0.907
Ease of Use 0.042 -0.015 0.104 0.007 0.901
Govt. Initiatives 0.041 -0.019 0.030 0.053 0.052 0.834
IJSRR, 8(2) April. – June., 2019 Page 2114
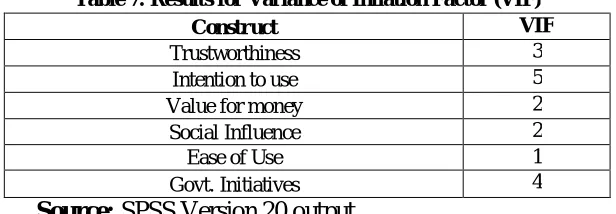
Multicollinearity
Before conducting the multiple regression analysis, the problem of multicollinearity has been
tested by the method of measuring the variance of inflation factor 69. VIF indicates the degree of
association between the independent and dependent variables and is the most commonly used and
recommended measure of multi co-linearity. The suggested threshold limit of VIF is less than or
equal to 10 (i.e. tolerance> 0.1) 55. In the current study, VIF has been checked for all the constructs
predicting the intention to use and is presented in Table 8. The VIF for all factors came out to be far
less than the threshold limit of 10 points, thus, this has provided enough evidence against the
problem of multicollinearity. Therefore, the variables are fit for conducting regression analysis.
Table 7: Results for Variance of Inflation Factor (VIF)
Construct VIF
Trustworthiness 3
Intention to use 5
Value for money 2
Social Influence 2
Ease of Use 1
Govt. Initiatives 4
Source: SPSS Version 20 output
Multiple regression analysis
In order to determine the influence of the extracted variables on the intention to use smart
cards, multiple regression analysis has been used. The summary of results is presented in table 7. The
coefficient of determination (R2) accounted for 0.838 signifying that 83.8 per cent of variance is
explained by independent variables, which is quite an adequate variance in determining the intention
of the customers to use smart cards 69. The Adjusted R2 comes out to be 0.836; R=0.915; F
change=485.58; significant at 0.000; and value of Durbin Watson=1.928, all these values implies that
overall model is fit and a significant relationship exists between the dependent variable and
independent variables from which some important inferences can be drawn 70, 62, 66, 69.
Table 8: Model Summary of Multiple Regression Analysis
Model R R
Square
Adjusted R Square
Std. Error of the Estimate
Change Statistics
Durbin-Watson R Square
Change
F Change
df1 df2 Sig. F
Change
1 .915 .838 .836 .24724 .838 485.508 5 470 .000 1.928
ANOVA
Model Sum of Squares Df Mean Square F Sig.
Regression 148.386 5 29.677 485.508 .000
Residual 28.729 470 .061
Total 177.116 475
IJSRR, 8(2) April. – June., 2019 Page 2115
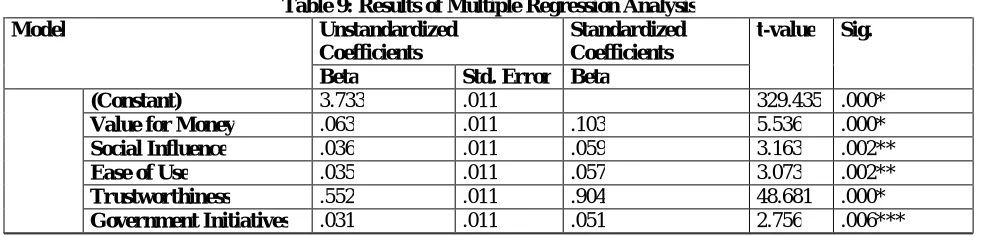
The results of multiple regression analysis depict that null hypotheses for all dimensions were
rejected at 5 per cent level of significance which described that all dimensions have a significant
impact on customer intention to use smart cards 70, 62, 68.
Table 9: Results of Multiple Regression Analysis
Model Unstandardized
Coefficients
Standardized Coefficients
t-value Sig.
Beta Std. Error Beta
(Constant) 3.733 .011 329.435 .000*
Value for Money .063 .011 .103 5.536 .000*
Social Influence .036 .011 .059 3.163 .002**
Ease of Use .035 .011 .057 3.073 .002**
Trustworthiness .552 .011 .904 48.681 .000*
Government Initiatives .031 .011 .051 2.756 .006***
Independent Variable: Government Initiatives, Trustworthiness, Ease of Use, Social Influence, Value for Money
Dependent Variable: Intention to Use
Note: Significant at *p< .00, **p< .002, ***p< .006 level
Source: Compiled from SPSS output
Results and Discussions
The results of the regression analysis have been presented in table 9 and reveal that out of all
the constructs, the construct of trustworthiness has the highest positive influence (β =.552, p-value< 0.00) on the intentions of the users to use smart cards. This finding of the study is similar to the
findings of other studies 50. This reflects that the respondents tend to use only those products in
which they have faith. Also, the technology of smart cards is new to the market and most of the
respondents have not opted to use this technology because of lack of trust. Thus, it makes quite a
sense that, respondents being rational in nature only incline towards those technologies in which they
have ample amount of faith and as a result, the construct of trustworthiness has come out to be the
most significant construct. After trustworthiness, the second most significant factor is value for
money with (β = 0.064 and p-value<0.00) and the results are in line with the studies 2, 20, 29. The plausible explanation behind this is the role of rationality in the consumers. The consumer is only
intent to use a particular technology if it delivers the ample amount of benefits to consumers as
compared to efforts made to use that technology. The construct of social influence is less significant
than value for money with (β=.036, p-value>0.002). It reflects that social influence interacts through the construct of value for money as users came into the influence of society only after they perceive
that the present technology provides enough value for the money invested. However, ease of use
construct has been taken from the technology acceptance model. This construct is the second least
significant construct and the results are in contrast to the studies 42, 16. As the Indian market is one of
the fastest growing emerging economies and the highest youth population over the world where the
majority of the population are a young adult and educated. Consequently, ease of use is a less
IJSRR, 8(2) April. – June., 2019 Page 2116
initiatives is the least significant construct which influences the intention to adopt the smart cards
with (β=0.031; p-value < 0.006). The results are also in contrast to the earlier research conducted by study 52. This less significant influence has been justified by the fact that, most of the smart cards in
the market have been introduced by the private banks and these already have invested a large chunk
of money on the promotion and investment of the technology which makes the government
initiatives less effective as it has been observed in this study.
CONCLUSION AND IMPLICATIONS
The present study, measures the effect of various independent factors on the intention use
smart cards in India. The various factors constructs have been explored and later validated. All the
explored factors were later analyzed to study their influence vis-à-vis intention to use these smart
cards. All the factors were found to be significant having a noteworthy impact. Out of all the factors,
trustworthiness and value of money have the highest impact followed by social influence, ease of
use, and government initiatives. Consequently, the results of the research imply that the adoption of
smart cards is still at the nascent phase in India; therefore, a lot of efforts are needed to mold the
intentions of users towards smart cards. Moreover, this study provides great insights and also
supplements the previously existing literature. In the current study, the variables that have been
selected by taking into consideration the individual attributes, product-related attributes, and the
societal factors as well. The results further imply that societal factors only interact and try to mold
the behavior of the user if it is interacted through the trustworthiness and value for money, signifying
the self-centered rationality of the users. In a nutshell, it can be said that users will only use smart
cards and new banking technologies if they perceive them to be profitable.
In the case of practical and managerial implications, this study will be of great help for the
policymakers to formulate new strategies which will enhance the adoption and intention to use smart
cards. New strategies to protect the interest of the users should be formulated and also there is a need
for the managers to provide the financial initiatives to users. Furthermore, advertisements should
contain rational appeal and should address the concern of value for money. As the value for money is
the second most significant construct that impacts the intentions. In addition, the next strongest
predictor is the social class of the user and special attention should be given by the policymakers to
attach some esteem value with the smart cards so that intention can be molded in a positive manner.
Advertisements should be made in such a way that they reflect the esteem values relating to the
products. As a result, the use of smart cards is beneficial for both the consumers and the service
providers. Hence, it is very important to influence intentions in a positive way.
IJSRR, 8(2) April. – June., 2019 Page 2117
Firstly, the study specifically focused on the factors of intention to use smart cards within the
business to consumer (B2C) markets only. Secondly, the data for this study were collected within the
Indian consumer environment. Therefore, the generalization of the findings to other cultures can be
done carefully. Finally, using convenience sampling techniques may affect the findings of the study.
Future research directions
The findings and limitations uncover a lot of potential avenues for future research. This
framework can be examined in a wider context to verify its application by taking more diverse
sample composition that shares large commonalities in terms of consumer values. Furthermore, it
suggested that the model can be further examined within other areas of technology usage also.
REFERENCES
1. Mariëtte, Louise., Zietsman, Pierre. Mostert., and Göran, Svensson. Perceived price and service
quality as mediators between price fairness and perceived value in business banking relationships: A
micro-enterprise perspective. International Journal of Bank Marketing, 2019; 37(1): 2-19.
2. Yung, Hsiang,. Cheng., and Sz-Fan, Chen. Adoption forecasting of multipurpose smart cards in transit
systems. Journal of Intelligent Transportation Systems, 2016; 20(4): 363-384.
3. Talmor, S. TVs to Toll Booths: Smart Card Capabilities, Security Management, 1994; 38(4): 52-74.
4. Svigals, J. Smart cards -A critical decision point. Journal of Retail Banking, 1987; 9(1): 43-55.
5. Fatima, Akhtar., and Niladri, Das. Predictors of investment intention in Indian stock markets:
Extending the theory of planned behavior. International Journal of Bank Marketing, 2019; 37(1):
97-119.
6. Foscht, T., Maloles, C., Swoboda, B., and Chia, S. L. Debit and credit card usage and satisfaction:
who uses which and why–evidence from Austria. International Journal of Bank Marketing, 2010; 28
(2): 150-165.
7. Worthington, S. The cashless society. International Journal of Retail and Distribution Management,
1995; 23(7), 31-40.
8. Mona, Sinha., Hufrish, Majra., Jennifer, Hutchins., and Rajan, Saxena. Mobile payments in India: the
privacy factor. International Journal of Bank Marketing, 2019; 37(1): 192-209.
9. Flavián, C., Belanche, D., and Casaló, L. V. The role of place identity in smart card adoption. Public
Management Review, 2014; 16(8): 1205-1228.
10. Ramasamy, R., and Muniyandi, A. P. An Efficient Password Authentication Scheme for Smart
Card. International Journal of Network Security, 2012; 14(3): 180-186.
11. Minna, Mattila., Heikki, Karjaluoto., and Tapio, Pento. Internet banking adoption among mature
customers: early majority or laggards? Journal of Services Marketing, 2003; 17(5): 514-528.
IJSRR, 8(2) April. – June., 2019 Page 2118 13. Arndt, J. Role of product-related conversations in the diffusion of a new product. Journal of
Marketing Research, 1967; 3: 291-295.
14. Chauhan, V., Rambalak, Yadav., and Vipin, Choudhary. Analyzing the impact of consumer
innovativeness and perceived risk in internet banking adoption: A study of Indian consumers.
International Journal of Bank Marketing, 2019; 37 (1): 323-339.
15. Monica, Cortinas., Margarita, Elorz., and José, Miguel. Múgica. The use of loyalty-cards databases:
Differences in regular price and discount sensitivity in the brand choice decision between card and
non-card holders. Journal of Retailing and Consumer Services, 2008;15(1): 52-62.
16. Amin, H. An analysis of mobile credit card usage intentions. Information Management & Computer
Security, 2007; 15: 260-269.
17. Hart, S., Smith, A., Sparks, L., and Tzokas, N. Are loyalty schemes a manifestation of relationship
marketing?, Journal of Marketing Management,1999; 15(6): 541-62.
18. Lunt, P. The smart cards are coming! But will they stay? ABA Banking Journal, 1995; 87(9): 46-52.
19. Mohammed, Z. Salem., Samir, Baidoun., and Grace, Walsh. Factors affecting Palestinian customers’
use of online banking services. International Journal of Bank Marketing, 2019; 37(2): 426-451.
20. Jamie, Murphy., Richard, Lee., and Evan, Swinger. Student Perceptions and Adoption of University
Smart Card Systems. International Journal of Technology and Human Interaction, 2013; 7 (1): 1-15.
21. Puri, V. Smart cards - the smart way for the banks to go? International Journal of Bank Marketing,
1997; 15(4): 134 – 139.
22. Marr, N.E., and Prendergast, G.P. Consumer adoption of self-service technologies in retail banking: is
expert opinion supported by consumer research? International Journal of Bank Marketing, 1993;
11(1): 3-10.
23. Liqiong, Lin., Mohamad, Dian. Revindo., Christopher, Gan., and David, A. Cohen. Determinants of
credit card spending and debt of Chinese consumers. International Journal of Bank Marketing, 2019;
37(2): 545-564.
24. Li, C. T., and Hwang, M. S. An efficient biometrics-based remote user authentication scheme using
smart cards. Journal of Network and computer applications, 2010; 33(1): 1-5.
25. Kumar, V., and Hundal, B. S., & Kaur, K. Exploring the Service Quality determinants of Solar
Product Dealers. Asia-Pacific Journal of Management Research and Innovation, 2019; 1–12, DOI:
10.1177/2319510X19829339.
26. Daniel, P., and Murphy. Electronic Transfer of Funds: Smart Cards, Internet Banking, and Wireless
Communications. Journal of Financial Crime, 1998; 6(1): 26 – 35.
27. Reem, Ramadan., and Jawdat, Aita. A model of mobile payment usage among Arab consumers.
International Journal of Bank Marketing, 2018; 36 (7): 1213-1234.
28. Hundal, S. K., and Kumar, V. Customer Relationship Management-A Study of Public & Private
IJSRR, 8(2) April. – June., 2019 Page 2119 29. Christopher, R., Plouffe, Mark., and Vandenbosch, John. Hulland. Why smart cards have failed:
looking to consumer and merchant reactions to a new payment technology. International Journal of
Bank Marketing, 2000; 18(3): 112 – 123.
30. Michael, Humbani., and Melanie, Wiese. An integrated framework for the adoption and continuance
intention to use mobile payment apps. International Journal of Bank Marketing, 2019; 37 (2):
646-664.
31. Kumar, V., Hundal, B. S. Customer Perception towards Celebrity Endorsement. Pacific Business
Review International, 2015; 8 (5): 46-53.
32. Gan, C. E., Cohen, D. A., Hu, B., Tran, M. C., Dong, W., and Wang, A. The relationship between
credit card attributes and the demographic characteristics of card users in China. International Journal
of Bank Marketing, 2016; 34(7): 966-984.
33. Mirza, Tabrani., Muslim, Amin., and Ahmad, Nizam. Trust, commitment, customer intimacy and
customer loyalty in Islamic banking relationships. International Journal of Bank Marketing, 2018;
36(5): 823-848.
34. Jyotiranjan, Hota., and Sasmita, Mishra. Development and validation of a multivendor ATM adoption
model in India. International Journal of Bank Marketing, 2018; 36(5): 884-907.
35. Kumar, V., and Hundal, B. S, Evaluating the Service Quality of Solar Product Companies using
SERVQUAL Model, International Journal of Energy Sector Management, 2018
Doi.org/10.1108/IJSEM-07-2017-0007.
36. Runnemark, E., Hedman, J., and Xiao, X, Do consumers pay more using debit cards than
cash? Electronic Commerce Research and Applications, 2015; 14(5): 285-291.
37. Patil, S. Impact of plastic money on banking trends in India. International Journal of Management
Research and Business Strategy, 2014; 3(1): 34-51.
38. Spiller, P., and Lohse, G. L. Electronic shopping, Communications of the ACM. 1998; 41(7): 81-87.
39. Singh, S., and Rana, R. Study of Consumer Perception of Digital Payment Mode. Journal of Internet
Banking and Commerce, 2017; 22(3): 1-14.
40. Hundal, B.S., and Kumar, V. Consumer Perception towards Green Products: A Factor Analytic
Approach. Pacific Business Review International, 2015; 7(10): 1-7.
41. Devlin, J.F. Technology and innovation in retail banking distribution. International Journal of Bank
Marketing, 1995; 13(4): 19-25.
42. Ziqi, Liao., Xinping, Shi., and Wing, Keung. Wong. Key determinants of sustainable smartcard
payment. Journal of Retailing and Consumer Services, 2014; 21(1): 306-313.
43. Goode, M.M.H., Moutinho, L.A., and Chien, C. Structural equation modeling of overall satisfaction
and full use of services for ATMs. International Journal of Bank Marketing, 1996; 14 (7): 12-20.
44. Gart, A. How technology is changing banking. Journal of Retail Banking, 1992; 14(1): 35-43.
45. Roboff, G., and Charles, C. Privacy of financial information in cyberspace: banks addressing what
IJSRR, 8(2) April. – June., 2019 Page 2120 46. Wilcox, K., Block, L. G., and Eisenstein, E. M. Leave home without it? The effects of credit card debt
and available credit on spending. Journal of Marketing Research, 2011; 48(1): 78-90.
47. Morall, K. Smart cards – signal a cashless society. Bank Marketing, 1995; 27(4): 13-17.
48. Trépanier, M., Habib, K. M., and Morency, C. Are transit users loyal? Revelations from a hazard
model based on smart card data. Canadian Journal of Civil Engineering, 2012; 39(6): 610-618.
49. John, Byrom. The role of loyalty card data within local marketing initiatives. International Journal of
Retail & Distribution Management, 2001; 29(7): 333-342.
50. Hundal, B.S., & Kumar, V. Assessing the Service Quality of Northern Railway by using SERVQUAL
Model. Pacific Business Review International, 2015; 8(2): 82-88,
51. Steve, Worthington, Introduction: Affinity credit cards: a critical review. International Journal of
Retail & Distribution Management, 2001; 29(11): 485-508.
52. Joseph, A., Bellizzi., and Terry, Bristol. An assessment of supermarket loyalty cards in one major US
market, Journal of Consumer Marketing, 2004; 21(2): 144-154.
53. Singh, Charan, India since Demonetisation, Working Paper, No: 567. Indian Institute of Management
Bangalore, Bannerghatta Road, Bangalore, March 2018.
54. Yuan, L., Xi, C., and Xiaoyi, W. Evaluating the readiness of government portal websites in China to
adopt contemporary public administration principles. Government Information Quarterly, 2012;
29(3): 403-412.
55. Hair, J.F., Black, W.C., Babin, B.J. and Anderson, R.E. Multivariate Data Analysis. Pearson: India,
Noida; 2015.
56. Henseler, J. Why generalized structured component analysis is not universally preferable to structural
equation modeling. Journal of the Academy of Marketing Science, 2012; 40(3): 402–413.
57. Hu, L. and Bentler, M. Cutoff criteria for fit indexes in covariance structure analysis: conventional
criteria versus new alternatives. Structural Equation Modeling, 1999; 6(1): 1–55.
58. Schuessler, K.F, Analyzing Social Data: A Statistical Orientation. Houghton – Mifflin, New York;
1971.
59. Pallant, J. SPSS Survival Manual: A Step by Step Guide to Data Analysis using SPSS for Windows,
10th ed., McPherson’s Printing Group: Maryborough, Victoria, Australia; 2001.
60. Malhotra, N.K., and Dash, S. Marketing Research: An Applied Approach. Pearson: India, New Delhi;
2014.
61. Costello, A., and Osborne, J. Best practices in exploratory factor analysis: four recommendations for
getting the most from your analysis. Practical Assessment Research & Evaluation, 2005; 10(7): 1–7.
62. George, D., and Mallery, P. SPSS for Windows Step by Step: A Simple Guide and Reference, 4th ed.,
Allyn & Bacon: Boston; 2003.
63. Kinnear, T., and Taylor, J. Marketing: Research an Applied Approach, 5th ed., McGraw Hill Inc.,
IJSRR, 8(2) April. – June., 2019 Page 2121 64. Kline, R.B. Principles and Practice of Structural Equation Modeling. Guilford Press: New York;
2011.
65. Cooper, D.R., and Schindler, P.S. Business Research Methods, 8th ed., McGraw Hill/Irwin: New
York; 2003.
66. Anderson, J.C., and Gerbing, D.W. Structural equation modeling in practice: a review and
recommended two-step approach, Psychological Bulletin, 1988; 103: 411.
67. Campbell, D.T., and Fiske, D.W. Convergent and discriminant validation by the
multitrait-multimethod matrix, Psychological Bulletin, 1959; 56(2): 81–105.
68. Fornell, C., and Larcker, D.F. Evaluating structural equation models with unobservable variables and
measurement error. Journal of Marketing Research, 1981; 18(1): 39–50.
69. Fisher, R.A. The goodness of fit of regression formulae, and the distribution of regression
coefficients, Journal of the Royal Statistical Society Blackwell Publishing, 1922; 85(4): 597–612.
70. Armstrong, J.S. Illusions in regression analysis. International Journal of Forecasting, 2012; 28: 689.
71. Likert, R. A technique for the measurement of attitudes. Archives of Psychology, 1932; 22(140): 55.
72. Aldrich, J. Fisher and regression. Statistical Science, 2005; 20: 401–417.
73. Bollen, K.A. Structural Equations with Latent Variables. John Wiley: New York; 1989.
74. Lei, Huang., and Julie, Fitzpatrick. Lending a hand: perceptions of green credit cards. International
Journal of Bank Marketing, 2018; 36(7): 1329-1346.
75. Linn, R. L. Measurement and assessment in teaching. Pearson Education: India; 2008