654
Decision Support System Using Data Warehouse
For Top Marketer
Abba Suganda Girsang, Sani Muhamad Isa, Sherly Oktafiani, Gannisnahayu Dinda
Abstract: Marketing is an important thing that greatly influences the growth of the company. If marketing performance is good, then the company will also develop well. But in today's conditions, we often find that marketing motivation is often overlooked or not too cared for. So that performance decreases and will be very detrimental to the company. However, marketing motivation needs to be improved by determining the top marketers through a bonus system.Where the use of data warehouse will be carried out as the best Decision Support System (DSS) for manager in determining the top marketers. With the use of data warehouses, large amounts of data can be prayed in such a way as to produce information that is useful for managers in decision making.
Keywords: Marketing, Data Warehouse, Bonus System, Decision Support System.
————————————————————
1
I
NTRODUCTIONToday the existence of marketing in a company cannot be ignored. Where marketing can be likened to the spearhead of the company. Which certainly will greatly affect the growth of a company. If the marketing performance is good, then the growth of a company will also be much better and if the mar-keting performance is bad, it will also reduce the quality of the company. Indirectly we can see that marketing performance has played an active role in helping to widen the network of a company, develop a company's business, reach market tar-gets of a company and so on. Marketing is a very close me-dium to build business relationships as a support for the growth of a company. So that a company should give motiva-tion and encouragement to the marketing team to continue to improve their performance at work. Unfortunately, there are still companies that don't pay too much attention to this mar-keting section. So that their performance and performance decreased and the achievement was low towards the targets set by the previous company. This will certainly have a very bad impact on the company, considering that marketing is very important for the development of a company. In helping to increase marketing motivation, there are several compa-nies that implement top marketing systems. By choosing the best marketing that can later be used as a promotional path or additional commission for the selected. Of course this will foster more enthusiasm and motivation for the marketing. But unfortunately this is still running manually and is less effective to implement. Then also requires a long analysis time and seems not objective, causing a sense of social jealousy with each other because it seems there is an element of favoritism and so on. Based on the problem that I have as the writer suggests a solution that is able to improve performance for marketing. That is by developing a decision-making system related to top marketing determination. In order to implement the data warehouse, it is expected to be able to help the
se-lection of top marketing more effectively and efficiently. Later, giving bonus points to top marketing that can achieve the best performance in each month will be easier to do. This is certainly expected to be the motivation of one another to con-tinue to compete to do the best so that the better the perfor-mance of the marketing. Which certainly will have a good impact on the company.
2
R
ELATEDW
ORKS2.1 Data Warehouse
The data warehouse is a series of decision support technolo-gies that aim to assist in faster and better decision making [3]. To handle large amounts of data, the data warehouse is made of historical repositories, time variants, non-volatile da-ta about products, product classification, regional marketing, etc. Because traditional data usage does not produce satis-factory results as DBMS and RDBMS to process basic que-ries [1]. Operational databases tend to be hundreds of mega-bytes to gigamega-bytes in size. Database consistency and recov-ery are vrecov-ery important, and maximizing transactions is the main thing. As a result, databases are designed to reflect known application operational semantics, and, in particular, to minimize concurrency conflicts [3]. The data warehouse is indeed used as a computing machine to replace and make other cubes. Then based on the application of the data ware-house, the pattern was analyzed and to provide the best solu-tion in determining the top marketers in this health equipment distributor company [2].
The generic data warehouse architecture consists of three layers. To build a data warehouse we must run an ETL tool that has three tasks: (1) data extracted from different data sources, (2) distributed to the data staging area where it is transformed and cleaned, and then (3) loaded into the data warehouse. ETL tools are a category of specialized tools with the task of handling data warehouse homogeneity, cleaning, transformation, and problem loading [4]. The ETL process is periodic in accordance with the refresh cycle and business needs. It also captures only data that has changed since the last extraction using many techniques as an audit column, database log, system date, or delta technique [4].
2.2 Modeling Dimension
Its complex spatial hierarchy affects the query process in OLAP. Where spatial OLAP depends on the spatial index to determine whether it is necessary to exploit existing cubes [5]. Research in the field of modeling ETL processes can be ————————————————
Abba Suganda Girsang Computer Science Department, BINUS Grad-uate Program Master of Computer Science, Bina Nusantara Universi-ty, Jakarta, Indonesia 11480, Email : [email protected].
Sani Muhamad Isa Computer Science Department, BINUS Graduate Program Master of Computer Science, Bina Nusantara University, Ja-karta, Indonesi 11480, Email : [email protected].
Sherly Oktafiani Computer Science Department, BINUS Graduate ProgramMaster of Computer Science, Bina Nusantara University, Ja-karta, Indonesia 11480, Email : [email protected].
categorized into three main approaches:1. Modeling based on mapping expression and guidelines. 2. Modeling-based on conceptual constructs. 3. Modeling based on UML environ-ment [4].
3
P
ROPOSED METHODBased on the Kimball Methodology, the first thing to do in the datawerhouse concept is to describe the top marketer's busi-ness processes. Understanding busibusi-ness processes is a very important basic thing. By understanding business processes and their requirements, we will be able to engage businesses, prioritize efforts and provide business value. The process of defining business requirements is done by doing business with stakeholders to gain insight and a better understanding of the business itself and the purpose of further regulation of the data warehouse implementation. Star schema as shown Fig 1 consists of 4 dimension tables, 1 snowflake and 1 fact table:
Fig.1 Star Schema
1. Time Dimension.The time dimension contains infor-mation about when marketing gets a bonus. Inside is information about the month and year.
2. Regional marketing dimensions. Regional marketing dimensions contain information about the branch or region of each marketing.
3. Employee Dimensions. The employee dimension con-tains all information related to employees. Whether it's address, telephone number, e-mail and so on.
4. Product Dimensions. Product dimensions contain in-formation on the types of products offered by market-ing to customers.
5. Snowflake Classification. Snowflake classification is a grouping of the types of products sold by marketing. 6. Fact Bonus.The fact bonus table contains a set of
the dimension table and ETL to the fact table. The steps tak-en are explained in detail in the stages as shown Fig.2
Fig.2 ETL Customer bonus
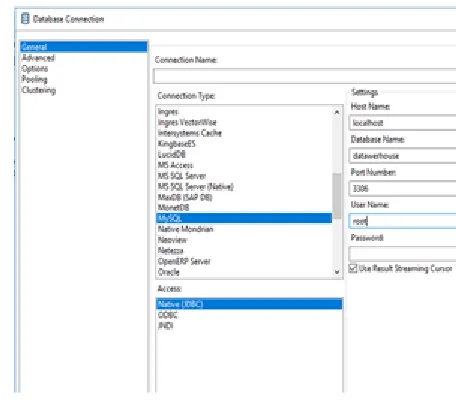
Input Table. The first to create a table input, where data is taken from the original database by first making a connection between the input tables in Pentaho and the MySQL data-base as shown Fig.3
Fig.3 Connection input table
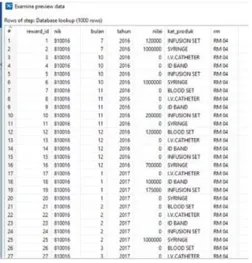
656 Fig.5 Database Value Lookup
Table Output. Table output contains the data we need in the process of generating marketing bonus data. Where from this output table we create a new table whose contents corre-spond to the ETL process we have done in the MySQL data-base. also see pie diagrams that describe product classifica-tions that affect the bonus value in the current month and year. By looking at the data as presented, it will certainly make it easier to do data analysis than having to look at large amounts of data as separate lists on the Excel.
4
A
NALYSIS RESULTBy using a data warehouse, the resulting report can be pro-cessed more quickly when compared to the manual method. Allows report results to be generated based on different pa-rameters. By looking at the results of the bar graph analysis on Fig 6 and Fig 7, we can see sales bonus reports within a particular month and year period.
Fig. 6 Report marketing sales
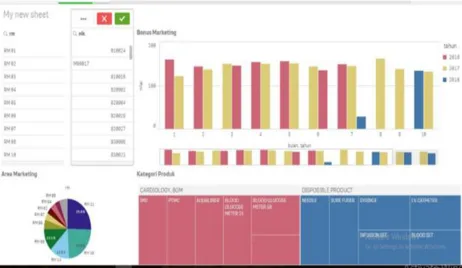
Fig 8 Dashboard Sales
Based on the report as shown Fig 8, of course the manager will get a lot of information that is useful to assist in making the best decisions. This ETL process will be carried out every month to see the best performance of each marketing. Then the performance comparison or performance on each month will be evaluated to produce a decision.
5 Conclusion
The implementation of a data warehouse in this company, clearly seems very helpful in decision making. Reports are able to be delivered faster, accurately and efficiently. The form of the report can be adjusted to the needs, there are various kinds of reports that can adapt to your needs. Much information is produced to support decisions. Where this will have an extraordinary influence or influence in a large com-pany. Large amounts of data can be used to produce infor-mation that is useful for developing the company in a better direction.
References
[1] IYER, Sailesh S.; LAKHTARIA, Kamaljit I. Proposed Healthcare Model using Data Warehouse, OLAP and Da-ta Analytics. 2017.
23.2: 91-104.
[5] RAO, Fangyan, et al. Spatial hierarchy and OLAP-favored search in spatial data warehouse. In: Proceed-ings of the 6th ACM international workshop on Data warehousing and OLAP. ACM, 2003. p. 48-55.
[6] KIMBALL, Ralph; ROSS, Margy. The data warehouse toolkit: The definitive guide to dimensional modeling. John Wiley & Sons, 2013.
[7] TRUJILLO, Juan; LUJÁN-MORA, Sergio. A UML based approach for modeling ETL processes in data ware-houses. In: International Conference on Conceptual Modeling. Springer, Berlin, Heidelberg, 2003. p. 307-320. [8] WHITE, Mason. Big Data vs. Data Warehousing. 2018. [9] ANDERSEN, Ove; THOMSEN, Christian; TORP, Kristian.
SimpleETL: ETL Processing by Simple Specifications. In: 20th International Workshop on Design, Optimization, Languages and Analytical Processing of Big Data co-located with 10th EDBT/ICDT Joint ConferenceInterna-tional Workshop on Data Warehousing and OLAP. 2018. [10] MUKHERJEE, Rajendrani; KAR, Pragma. A Comparative
943-658 mation Communication Technology (ICEEICT), 2015
In-ternational Conference on. IEEE, 2015. p. 1-6.