http://www.gjaets.com © Global Journal of Advance Engineering Technology and Sciences 37
Global Journal of Advanced Engineering Technologies and Sciences
COLOR DATA CLUSTERING ALGORITHMS (CDCA) USING SPATIAL
TEMPORAL DATA MINING
Capt. Dr. S.Santhosh Baboo
*1, K.Tajudin
2*1Associate Professor, Postgraduate & Research, Department of Computer Applications, D.G.Vaishnav
College, Arumbakkam, Chennai-600106, India,.
2Assistant Professor, Department of Computer Science, The New College, Royapettah, Chennai-600014,
Tamilnadu, India,.
Abstract
The clustering algorithm in coloring basis is describes in two different ways. The first section discusses about different color object, here to cluster same color of objects only which is specified in the runtime. The algorithm is specifying all necessary steps are followed to cluster colouring objects. The second section deals with the maximum wind details are Hurricane/Tropical Data for Northern Indian Ocean from the website of http://weather.unisys.com/hurricane/. Here to concentrate the flow record of maximum wind, starting from the year 2001 to 2013, the maximum cyclone flow updated in different duration i.e., hourly basis. The databases keep all records of data, to apply the clustering for coloring based. The wind color is different for the range basis. The database store all the wind ranges and to generate the coloring range, the SQL query to retrieve in the prescribed range format.
Keywords: Spatial Temporal Database-Moving Object- Color finding-Query analysation.
Introduction
Data Mining is an analytic process designed to explore data (usually large amounts of data - typically business or market related) in search of consistent patterns and/or systematic relationships between variables, and then to validate the findings by applying the detected patterns to new subsets of data. The ultimate goal of data mining is prediction - and predictive data mining is the most common type of data mining and one that has the most direct business applications. Technically, data mining is the process of finding correlations or patterns among dozens of fields in large relational databases.
The process of data mining consists of three stages: (1) the initial exploration, (2) model building or pattern identification with validation/verification, and (3) deployment (i.e., the application of the model to new data in order to generate predictions).
When the data has relations with spatial data, the term becomes spatial data mining. In other words, spatial data mining is the application of data mining technique to spatial data. It will follow along the same functions in data mining; with the end objective is to find patterns in geography, meteorology etc.
Databases that store information about states of the real world across time are called temporal databases. Based on the issue of time in database systems, distinguish time as measured by the system and time as observed in the real world. The valid time for a fact is the set of time intervals during which the fact is true in the real world, independent of the recording of that fact in some databases. Valid time can be in the past, present, or in the future.
A spatio-temporal database system manages data whose geometry changes over time. Applications that generate such type of data include surveillance applications, transportation systems, mobile communication systems and geographical and environmental systems, and so on. Spatio-temporal datasets have some unique characteristics that make them different from traditional relational and transactional datasets.
LITERAL REVIEW
http://www.gjaets.com © Global Journal of Advance Engineering Technology and Sciences 38
algorithm is more suitable for similarity measure that can be represent by a distance measure each clustering represented by one data object. CURE accept any similarity measures and the cluster can be represented by more than one representative this very important to represent cluster of different space there are location in the space that are highly similar this are represented with in each of the small location groups.
Color mining of images based on clustering. A metadata base may be used to shorten query resolution time by trying to limit the number of images being thoroughly analyzed to a smaller subset, having a high probability of finding query images [17].The index is created by describing the images according to their color characteristics, with compact feature vectors that represent typical color distributions.
RELATED WORK
A. Cluster Color Objects
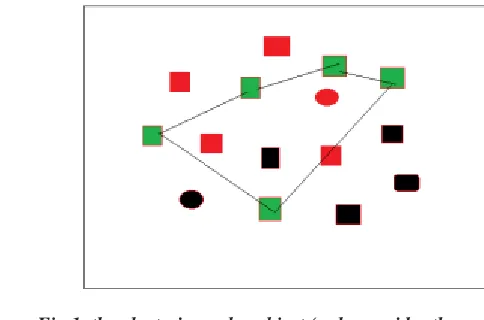
The first section describes different color object in the screen, to cluster only specific mentioned color objects. The figure (1) shows different shapes of objects with mentioned different colors, green color objects connect the lines, the output display count of green color objects only.
Fig.1. the clustering color object (only consider the green)
i=n
COcolor = ∑ S_C --eq(1) i=1
Where COcolor- represent cluster object color is sum of S_C (specific Color) object constrain.
The equation (1) describes left side mentioned color object clustering result, the right side specifies sum of specific color output. For example, the above-mentioned figure (1) only specifies green color so the output result will be a display that mentioned color only, based on the figure the output value is five likewise to specify red color, the output will be five and so on
ColorOuput_green= ∏object_name(σcolor=green(color_object))-eq(2)
The equation (2) shows the predicate that indicates color that is equal to green, here to filter green object only.
B. Hurricane Flow Data Cluster Based on Color
The second section deals with the maximum wind details these are Hurricane/Tropical Data for Northern Indian Ocean from the website of http://weather.unisys.com/hurricane/. Here to concentrate the flow record of maximum wind, starting from the year 2001 to 2013, the maximum cyclone flow updated in different duration i.e., hourly basis.
http://www.gjaets.com © Global Journal of Advance Engineering Technology and Sciences 39
Type Categor y
Pressure (mb)
Winds (knots)
Winds (mph)
Surge (ft)
Line Color
Depression
TD --- < 34 < 39 Green
Tropical S Storm
TS --- 34-63 39-73 Yellow
Cyclone 1 > 980 64-82 74-95 4-5 Red
Cyclone 2 965-980 83-95 96-110
6-8 Light Red
Cyclone 3 945-965 96-112 111-130
9-12 Magent a
Cyclone 4 920-945 113-135
131-155
13-18 Light Magent a
Cyclone 5 < 920 >135 >155 >18 White
The table (I) shows details of hurricane/ tropical data for north Indian ocean, the line flow in different coloring depends on the wind range either it’s based on wind knots basis or wind mph basis. The green color line specifies less than 34 knots, yellow color line specifies between 34 knots to 63 knots, red color line specifies 64 knots to 82 knots and the light red color line specifies between 83 knots to 95 knots, magenta color line specifies 96 knots to 112 knots, light magenta color specifies between 113 knots to 135 knots and above 135 knots specifies white color.
Fig.2. Cluster of hurricane details based on color
http://www.gjaets.com © Global Journal of Advance Engineering Technology and Sciences 40
details of mentioned color and the second output result display count of all summary data. Each time the color specified internally, generate range of wind knots.
CRep= CData --eq(3)
Where Cluster hurricane report is display all the entries based on the color data (CD) constrain.
i=n
Ccount = ∑ CRep --eq(4) i=1
Where Ccount- represent sum of cluster report values.
The equation (3) displays all the data in specific color range of wind knots basis. The left side of equation specifies color hurricane report and right side specifies color data individual flow details. The equation (4) displays cluster-counting report on color basis.
Data Analysis
The following section describes details of data analysation of moving object with color clustering.
A. Cluster Color Object Data Analysation
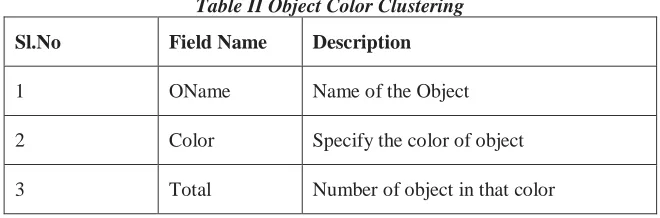
The table (II) shows details of color object clustering; the fields and object name, color specification of the object and total number of objects in that particular color. Each time to run an application, specified color of object and its output display total number of objects are in particular color.
Table II Object Color Clustering
Sl.No Field Name Description
1 OName Name of the Object
2 Color Specify the color of object
3 Total Number of object in that color
B. Hurricane Flow Data Analysation
The database table is used to maximum wind details from the year of 2001 to 2010 Hurricane/Tropical Data for Northern Indian Ocean from the website of http://weather.unisys.com/hurricane/.The table (III) and (1V) is used to store the information of above details.
Table III Max_cyclone database table Sl.No Attribute Description
1 Mid Maximum Wind Id, Set with unique attribute i.e., primary key
2 Name Wind Name Occurrence
3 Sdate Wind occurrence Starting Date
4 Edate Wind occurrence Ending Date
5 MND Maximum wind Pressure
Details
6 Cat Wind Category Range
http://www.gjaets.com © Global Journal of Advance Engineering Technology and Sciences 41
Sl.No Attribute Description
1 Mid Maximum Wind Id
References from First table
2 Lat Range of the Latitude
3 Lon Range of the Longitude
4 C_Occur Cyclone Occurrences
Details
5 Time Timing Details when the wind occur
6 Wind Wind Details
7 Status Status report based on wind flow Details
Research Finding
A. Cluster Color Object Algorithm Algorithm-1
Step1: To create a different coloring object Step2: To specify the color of object
Step3: The step4 and Step 5 follow until to check all object coloring Step4: if object.color= X then
Step5: Count =Count+1 Step6: end if
Step7: stop
Where X- defines color of the object specifies in runtime; Count- defines number of object satisfied that color.
B. Hurricane Flow Color Data Clustering Algorithm Algorithm-2
Step1: Create a database from the hurricane collection data
Step2: Create another database individual hurricane flow data with the reference of first database. Step3: Update all the entries in the database
Step4: Now to cluster the hurricane report based on the color of wind flow data.
Step5: Specify the color in runtime, at the same time to generate data based on the color specification because each color defines wind knots is different.
Step6: Generate first report query basis on color to display all the individual flow entries from the database.
CRep= CData
Where CData-Color Data;
CRep – Cluster Color Data Report
Step7: Finding the result of Step7 to count number of entries in specified color. Ccount = ∑ CRep
Where Ccount- represent sum of cluster report values
Step8: Stop.
Experiment Result
The following sections are discussed about experimental result of moving object cluster with shape and time constrains.
http://www.gjaets.com © Global Journal of Advance Engineering Technology and Sciences 42
The main objective of this session is to focus cluster objects based on color; the figure (3) shows experimental front-end application of clustering objects.
Fig.3. Color Clustering Experimental Screen Shot
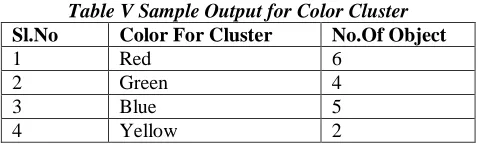
The figure (3) shows details of selected color for clustering and result of count, the number of objects is displayed in different color and different shapes also. Here to concentrate only color of objects because in the before chapters it discusses more about shape of object. Totally seventeen objects are display in the screen each object filled with color.
Table V Sample Output for Color Cluster Sl.No Color For Cluster No.Of Object
1 Red 6
2 Green 4
3 Blue 5
4 Yellow 2
The table (V) shows output result of color clustering, the second column specify color of the object, the third column specify number of cluster object based on color constrain. The red color contains six objects, the green color contains four objects, the blue color contains five objects and the yellow color contains two objects. Totally seventeen object with four different clustering groups.
B. Hurricane Color Cluster Report:
The figure (2) shows screen shot for hurricane data generation using color. Each time to run the application backend to load hurricane data, the SQL query to generate the report for that particular color input. For example the input specify Light Red color to generate query in the following like that
Max_windoutput=∏mid,lat,lon,date,time,wind,status(σwind>=rangeᴧwind<=range(max_wind)) –eq(5.7)
The above equation filter color object based on predicates. The attributes are display based on output.
Table VI Summary Result of Hurricane Color Wind Flow
Sl.No Color Count
1 Green 10
2 Light Red 11
3 Yellow 65
4 Red 34
http://www.gjaets.com © Global Journal of Advance Engineering Technology and Sciences 43
6 Light Magenta 11
7 White 2
Fig.4. Hurricane Color Cluster Wind Data Report Output
The figure (4) shows result output of hurricane data, during the year 2010 to 2013 duration maximum wind flow data occurrence entries of color specified in above figure. The white color summary report output of two, the magenta color summary report of seven, the yellow color summary report of sixty five, the light magenta color summary report of eleven, the Red color summary report of thirty four and so on.
Table VII Color Clustering Percentage Calculation
Sl.No Wind Color Range
Color
Specification Count %
1 <34 Green 10 7.52
2 >=34 to <=63 Light Red 65 48.87
3 >=64 to <=85 Yellow 34 25.56
4 >=86 to <=95 Red 4 3.01
5 >=96 to <=112 Magenta 7 5.26
6 >=113 to <=135 Light
Magenta 11 8.27
7 >135 White 2 1.50
http://www.gjaets.com © Global Journal of Advance Engineering Technology and Sciences 44
This paper to describe two different ways of color clusters, the first section discussed color object clustering. To cluster different color objects, the clustering occur only specified color only. This will give knowledge of how to cluster specific color object. The second section describes about real time data collection of hurricane data, here to cluster different color basis, each color specify wind pressure detail range is different. The cluster output only displayed based on the specific color. The summary report counts all entries in that color specification. The final report gave result of maximum color clustering occurred in light red range of wind flow.
References
1. ANTHONY DAVID VENESS A real-time spatio-temporal data exploration tool for marine research,Master of Applied Science University of Tasmania, October 2009.
2. DIMITRIS PAPADIAS, YUFEI TAO, PANOS KALNIS, JUN ZHANG, Indexing Spatio-Temporal Data Warehouses,
Data Engineering, International Conference 2002
3. D.LIN,C.JENSEN,B.OOI, AND S.SALTENIS.Efficient indexing of the historical, present, and future positions of moving objects. In MDM, pages 59–66, 2005.
4. GHAZI H.AL-NAYMAT new methods for mining Sequential and time series Data, PhD thesis, the university of Sydney June 2009
5. JIAWEI HAN AND MICHELINE KAMBER Data Mining Concepts and Techniques, second edition, Morgan Kaufmann Publishers an imprint of Elsevier
6. KIMBALL,R. The Data Warehouse Toolkit John Wiley, 1996.
7. M.PELANIS,S.ˇSALTENIS, AND C.JENSEN. Indexing the past, present, and anticipated future positions of moving objects. TODS, 31(1):255–298, 2006.
8. N.ROUSSOPOULOS,S.KELLEY,F.VINCENT, Nearest neighbour Queries, Proceedings of ACM SIGMOD
Conference, 1995.
9. RALF HARTMUT GUTING AND MARKUS SCHNEIDER Moving Objects Databases, Elsevier publication, 2005
10. S.SUDARSAN KRITHIRAMAMRITHAM DataWarehousing and Data mining, IIT Bombay, sudarsha@
cse.iitb.ernet.in,[email protected]
11. SUBRAMANIAN ARUMUGAM efficient algorithms for spatiotemporal data management, PhD Thesis
University of Florida, 2008
12. TAHER OMRAN AHMED AND MARYVONNE MIQUEL Multidimensional Structures Dedicated to Continuous
Spatiotemporal Phenomena Springer-Verlag Berlin Heidelberg 2005, pp 1-12
13. Z.-H.LIU,X.-L.LIU,J.-W.GE, AND H.-Y.BAE. Indexing large moving objects from past to future with PCFI+-index.In COMAD, pages 131–137, 2005.
14. KNOPR,E.M.,AND NG,R.T.Finding aggregated proximity relationships and commonalities in spatial data mining.IEEE Transaction on Knowledge and data Engineering 8.6(1996),884-897.
15. LU,W.,HAN,J.,AND OOI,B.C.Discovery of general knowledge in large spatial database in 1993(singapor:1993),pp.275-289.
16. SANCHEZ-DIAZ,G.,ANDRUIZ-SHULCLOPER,J.Midmining a logical combination pattern recognition approach to clustring in large data sets.
17. FISHER, D., AND LANGLEY,P.Approaches to conceptual clustering.In proceding 9th international joint
conference(1985),pp.691-697.