IMPACT ON COMPETENCY MAPPING
AMONG THE MIDDLE-LEVEL
MANAGERS: A STUDY WITH SPECIAL
REFERENCE TO AUTO ELECTRICAL
INDUSTRIES IN CHENNAI CITY
R. PRABAKARAN
Ph.D. Research Scholar, Department of Management studies, SCSVMV University, Enathur, Kanchipuram-631 561.
Dr. G. P. RAMAN
Research Supervisor & Guide, Controller of Examinations, SCSVMV University, Enathur, Kanchipuram-631 561.
Abstract
Competency mapping is a process which identifies an individual employee’s strength and weakness to help them to recognize themselves better. It leads to increased capacity by achieving a more holistic view of the accumulated competence of the entire organization. The competency mapping establishes expectations for performance excellence, resulting in a systematic approach to professional development, improved job satisfaction, and better employee retention. The study conducted among the middle-level managers of auto electrical industries in Chennai city. This paper attempts to understand Competency mapping and its impact on the performance of the organization. The effort is made to understand the competency mapping in the implementation areas such as recruitment, training, appraisal process and career development of employees in precisely. The study found that the training programs, selection process and performance appraisal process significantly influencing towards the job performance among the middle level managers in auto electrical industries in Chennai city.
Keywords: Competency Mapping, Job Performance, Training, Selection process, and Performance Appraisal system
I.INTRODUCTION
evaluating people for layoffs. Competencies are only a way of talking about what helps people get results in their jobs. What matters is performance– being effective and meeting job expectations (Anisha, 2012). In this dynamic world only one thing is permanent and that is the change" so keeping pace with ever-changing environment is always be a requirement and challenge for the business world in several areas of management including human resource management, as it is necessary for business houses to choose the job-fit personality for sustainable growth and development. In a knowledge economy, people are the heart of any business organization. Organizations need to build, sharpen and leverage on their competitive advantage – people. Organizations of the 21st century recognize the fact that human resources are the most valuable resource of the company and are the key differentiating factor in this competitive scenario. HR professionals have generated much interest in the notion of competencies as a critical element and measure of human performance, but one of the most challenging tasks of the HR professional is placing the right people in the right jobs.
Competency mapping is a current movement seen across various organizations. Competency is a combination of knowledge, skill, and attributes which lead to successful performance. Identification of competencies which lead to successful performance helps the organization growth along with the development of people associated with it. Here are various approaches to follow the competency mapping process like the bottom up and top approach, each one leading to organizational effectiveness. Competency mapping has found its uses in various functions of HRM and HRD like Selection, Performance Management, Career planning and Succession planning, leadership development, etc.
Every well-managed firm should have well-defined roles and list of competencies required for performing each role effectively. Such a list should be used for recruitment, performance management, promotions, placement and training needs identification.
Review of Literature
generation brings to the workforce is its 24*6 connectivity and technological expertise. Qualitative data revealed the concept of work-life integration instead of a work-life balance. Research supports the prediction that this generation is set to bring about unprecedented advancement to the workforce (Mathur & Hameed, 2016). Skill development by Competency mapping is one of the most accurate means of identifying the job and behavioural competencies of an individual in an organization. Competency mapping should not be seen as rewards. All the stakeholders must see in the exercise an opportunity for long-term growth. Competency mapping is not only done for Confirmed employees of an organization, and it can also be done for contract workers or for those seeking employment to emphasize the specific skills which would make them valuable to a potential employer. Competency is a set of knowledge, skills, and attitudes required to perform a job effectively and efficiently. A Competency is something that describes how a job might be done excellently; a Competence only describes what has to be done, not how. Core competency is something which cannot be copied, and it is the pillar upon which individual rest (Rajan, 2015). The study found that the JCAM tools are widely known and applied across the sectors particularly in areas of human resourcing with limited applications to performance management, talent, and leadership development while the compensation-based application is low. The study recommends the adoption of the JCAM tools as viable HRM models for improving performance effectiveness and enhancing organizational competitive advantage in Nigeria (Samuel, 2015). The study addresses the concept of competency mapping and skills of employees for enhancement. The study may help the organization to identify the men of incompetence among the employees and to take
remedial measures to improve their performance. The findings of the present study are considered to be very important as it analyses the factors of core competency mapping and development of employees for excellent in IBM, India(Ahmed & Alsabri, 2015). Competency mapping process helps organizations not only in identifying gaps but also bridges the gap which results in enhanced productivity for the organization and rising career graph of the individual employee. The 360-degree method appears to be the most appropriate & accepted method. It helps in creating a healthy organizational culture. It has also been evidenced that there is indeed a quest for Competency mapping among the employees of the organization(Sharma, 2014)
purposes. The biggest reasons for adoption of competency framework are the increasing quality of candidates selected, employee effectiveness and employee efficiency(Shah & Domingo, 2011).
II.OBJECTIVES
1. To study the impact of competency mapping on HR processes among the middle-level managers in Auto Electrical Industries in Chennai city; and
2. To identify the effectiveness of competency mapping on middle-level managers performance in Auto Electrical Industries in Chennai City
Statement of Hypotheses
There is no Effectiveness of Competency mapping at the time of selection process among the middle-level managers in Auto Electrical Industries in Chennai City
There is no Effectiveness of Competency mapping at the time of training process among the middle-level managers in Auto Electrical Industries in Chennai City
There is no Effectiveness of Competency mapping at the time of performance appraisal process among the middle-level managers in Auto Electrical Industries in Chennai City Research Methodology
The present study’s important purpose is to find out the Impact on Competency Mapping among the Middle-Level Managers: A Study with Special Reference to Auto Electrical Industries in Chennai City. The study used both secondary and primary data. Based on the literature survey, the questionnaire was prepared and conducted the pilot study. The pilot study results indicate that the value of Cronbach’s alpha is 0.891. The same questionnaire used for final study without modification of questionnaire copy. The 250 questionnaire were distributed to middle-level manager's viz., Assistant Manager, Deputy
Manager, Manager and Senior Manager drew by the simple random sampling method. The middle-level managers were contacted face-to-face for the purpose of collection of primary data. Out of 250 questionnaires, 21 questionnaires were rejected due to inadequate information provided by the respondents. Finally, 229 questionnaires are valid for further analysis. Therefore, the sample size of the study is 229. The data were collected during the period from February 2018 to May 2018.The primary data collected from target respondents were analyzed using descriptive statistics, one-sample t-test. The data were analyzed using SPSS 21.0 version.
Data Analysis and Discussion
Table 1 Demographic Profile of Respondents
Frequency Percent Gender
Male 152 66.4
Female 77 33.6
Total 229 100.0
Age
Below 30 years 42 18.3
31-35 years 66 28.8
36-40 years 47 20.5
41-45 years 40 17.5
46-50 years 34 14.8
Total 229 100.0
Marital Status
Single 51 22.3
Married 178 77.7
Total 229 100.0
Educational qualification
Diploma Holders 25 10.9
PG 39 17.0
Professional 165 72.1
Total 229 100.0
Annual Income
up to Rs. 5 Lakhs 38 16.6
Rs.5.1 - 7 Lakhs 54 23.6
Rs.7.1 - 8 Lakhs 57 24.9
Above Rs.8 Lakhs 80 34.9
Total 229 100.0
Working Department
Production Department 42 18.3
Marketing Department 37 16.2
HR Department 43 18.8
Finance Department 32 14.0
Maintenance (Works
Engineering) 38 16.6
Total 229 100.0
Designation
Assistant Manager 45 19.7
Deputy Manager 65 28.4
Manager 69 30.1
Senior Manager 50 21.8
Total 229 100.0
Experience
Up to 4 years 70 30.6
4.1 years to 6 years 90 39.3
6.1 years to 8 years 45 19.7
Above 8 years 24 10.5
Total 229 100.0
Source: Computed from primary survey
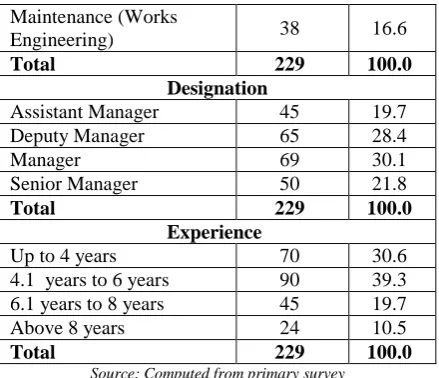
Table 1 reveals the demographic profile of the middle-level managers of auto electrical industries in Chennai city. Out of 229 respondents, majority 66.4% of the respondents are the male category, and 33.6% of the respondents are the female category. The study inferred that majority of the respondents are the male category. Regarding the age classification of the respondents, majority 28.6% of respondents were in the age group between 31-35 years, followed by 28.8% of respondents are in the age group of between 31-35 years, 20.5% of the respondents are in the age group between 36-40 years, 18.3% of the respondents are in the age group up to 30 years and 17.5 % of the respondents are in the group of between 41-45 years. In connection with the marital status concern, majority 77.7% of the respondents are married, and 22.3% of the respondents are single. In connection with the Educational Qualification, 72.1% of respondents are professionally qualified, followed by 17% of respondents are post-graduates and 10.9% of respondents were diploma holders. As for an annual income concern of the respondents, majority 34.9% of the respondents annual was above 8 Lakhs, followed by 24.9% of the respondent's annual income was between Rs.7.1-8 Lakhs, 23.6% of the
respondent's annual income was between Rs.5.1-7 Lakhs and 16.6% of the respondent’s annual income was up to 5 lakhs.
In connection with the respondents working department concern, majority 18.8% of the respondents were working in the HR department, followed by 18.3% of the respondents were working in the production department, 16.6% of the respondents are working in maintenance (works engineering) department, 16.2% of the respondents were working in the purchasing department, and 14% of the respondents were working in the finance department. As for as designation of respondents concern, majority 30.1% of the respondents were managers, followed by 28.4% of the respondents were deputy managers, 21.8% of the respondents were senior managers and 19.7% of the respondents were assistant managers. Regarding the working experience of the respondents, majority 39.3% of the respondents are having work experience between 4.1 years to 6 years, followed by 30.6% of the respondents are having working experience up to 4 years, 19.7% of the respondents are having working experience of 6.1 years to 8 years and 10.5% of the respondents are having work experience above 8 years.
Null Hypothesis-1
There is no Effectiveness of Competency mapping at the time of selection process among the middle-level managers in Auto Electrical Industries in Chennai City
Table 2 One-sample t-test for Effectiveness of Competency Mapping during the period of the selection process
Selection Process N Mean Std.
Deviation t-value P-value Awareness of Job Profile 229 3.56 .665 12.658 <0.001** I have adequate knowledge & skills for my job profile 229 3.59 .834 10.633 <0.001** I had a clear vision of my duties and responsibilities 229 3.54 .833 9.806 <0.001**
Recruitment & Selection are done based on the
competence 229 3.55 .796 10.482 <0.001**
Source: Computed from primary survey
Table 2 highlights the results of One-sample t-test for Effectiveness of Competency Mapping during the period of selection process among the middle-level managers in auto electrical industries in Chennai city. It is identified from the above table; all the selection process statements P-values are less than 0.01 and statistically significant. Hence it is concluded that Effectiveness of Competency mapping significant effect on at the
time of selection process among the middle-level managers in Auto Electrical Industries in Chennai City.
Null Hypothesis 2
There is no Effectiveness of Competency mapping at the time of training process among the middle-level managers in Auto Electrical Industries in Chennai City
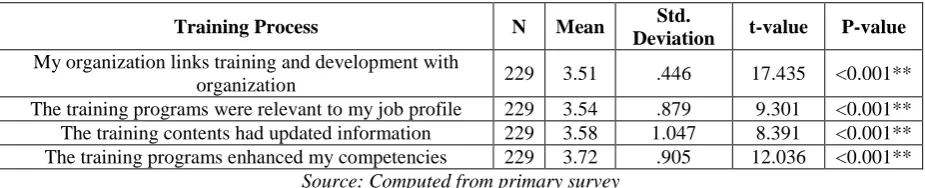
Table 3 One-sample t-test for Effectiveness of Competency Mapping during the period of the training process
Training Process N Mean Std.
Deviation t-value P-value My organization links training and development with
organization 229 3.51 .446 17.435 <0.001**
The training programs were relevant to my job profile 229 3.54 .879 9.301 <0.001** The training contents had updated information 229 3.58 1.047 8.391 <0.001** The training programs enhanced my competencies 229 3.72 .905 12.036 <0.001**
Source: Computed from primary survey
One-sample t-test for Effectiveness of Competency Mapping during the period of training process results depicts the Table 3. The training process statement namely ‘My organization links training and development with organization’ (t-value= 17.435 and P-value <0.001), followed by ‘The training programs enhanced my competencies’ (t-value= 12.036 and P-value <0.001), ‘The training programs was relevant to my job profile’(t-value= 9.301 and P-value <0.001) and ‘The training contents had updated information’ (t-value= 9.301 and P-value <0.001). The study established that all the statement P-values are less than 0.01 and statistically important. The null hypothesis rejected at the 1% level of significance. Hence it is concluded that there is significant
Effectiveness of Competency mapping at the time of training process among the middle-level managers in Auto Electrical Industries in Chennai City.
Null Hypothesis 3
There is no Effectiveness of Competency mapping at the time of performance appraisal process among the middle-level managers in Auto Electrical Industries in Chennai City
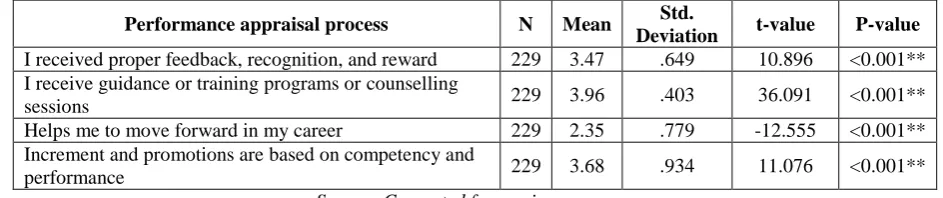
Table 4 One-sample t-test for Effectiveness of Competency Mapping during the period of performance appraisals
Performance appraisal process N Mean Std.
Deviation t-value P-value I received proper feedback, recognition, and reward 229 3.47 .649 10.896 <0.001** I receive guidance or training programs or counselling
sessions 229 3.96 .403 36.091 <0.001**
Helps me to move forward in my career 229 2.35 .779 -12.555 <0.001** Increment and promotions are based on competency and
performance 229 3.68 .934 11.076 <0.001**
Source: Computed from primary survey
Table 4 shows the results of the one-sample t-test for Effectiveness of Competency Mapping during the period of performance appraisals in the study area. It is noted from the above table, all the statements P-values are less than 0.01 and the null hypothesis is rejected at the 1% level of significance. Hence it is concluded that there is the actual effectiveness of competency mapping at the time of the performance appraisal process among the middle-level managers in Auto Electrical Industries in Chennai City.
III.SUGGESTIONS
Based on the results of the analysis the following suggestions are made:
The Auto Electrical industries should recruit the candidates according to the required competencies of the particular role.
The best performed middle-level managers need to be recognized and rewarded at the end of each project; and
Motivation should be given to the middle-level managers so that they take an interest in challenging assignments and capability building.
IV.CONCLUSION
Competency Mapping is a essential mechanism in the field of HR. It promises economic use of the most critical resource, Human Capital by ensuring the best suitable job for the person. It also ensures individuals growth and development. The grey areas in the implementation of the competency mapping are analyzed in this study. The study reveals that the auto electrical
industries are effectively implemented the competency mapping on the selection process, training needs, and performance appraisal process. The dimension of competency mapping namely training needs, selection process and performance appraisal process significantly influencing towards the job performance among the middle level managers in auto electrical industries in Chennai city.
V.REFERENCES
1) Ahmed, M., & Alsabri, A. (2015). “ Core Competency Mapping and Skills of Employees for Enhancement in. Acme Intellects International Journal of Research in Management, Social Sciences & Technology ISSN, 2939(10), 1–16.
2) Anisha, N. (2012). Competency Mapping of the Employees, 1(5), 1–7.
3) Competency Enhancement and Employee Empowerment in a TPM Organization - an Empirical Study. (2005).
4) Mathur, M., & Hameed, S. (2016). A Study on Behavioural Competencies of the Z Generation. International Conference on Management and Information Systems,63– 71.Retrieved from http:// www. icmis.net/icmis16/ICMIS16CD/pdf/S122.pdf 5) Pandey, J. P., & Guha, S. (2014).
Competency-Based Human Resource Management in Process Industries with Specific Reference to Bhilai Steel Plant, 16(9), 20–23.
International Journal of Scientific & Engineering Research, 2(8), 1–7. https://doi.org/10.1017/CBO9781107415324.0 04
7) Rajan, L. J. S. (2015). Competency Mapping Analysis : A Study Conducted in Specific Package Industry at the Puducherry State of India, 7(19), 147–158.
8) Samuel, R. (2015). Assessment of Methods and Applications of Competency Frameworks in the Nigerian Private Sector Organizations, III(Iv), 1–14.
9) Sandhya, N. (2017). A STUDY ON EMPLOYEES ’ COMPETENCY MAPPING, 705–714.
10) Shah, A., & Domingo, R. (2011). An electronic copy is available at http://ssrn.com/abstract=1499625, 25(2), 1–49. https://doi.org/10.3386/w19846