European Research Studies Journal Volume XXII, Issue 3, 2019
pp. 106-118
Price Formation around Dividend Announcement Date:
Empirical Evidence in Indonesian Stock Exchange
Submitted 13/03/19, 1st revision 22/04/19, 2nd revision 12/06/19, accepted 21/07/19
Budi Frensidy
1, Irene Josephine
2, Ignatius Roni Setyawan
3 Abstract:Purpose: This research aims to prove that there is a change in abnormal return around the dividend announcement date. Based on differences in the interests of rational and irrational investors related to the dividend announcement and subsequent event, the authors propose two research questions: first, whether there is an abnormal return around the dividend announcement date; second, whether price changes around that event.
Design/Methodology/Approach: The time span of the study was five days before and five days after the announcement date of 15 companies which announced dividends from 2007-2012. To answer the first question, we used the t-test and to answer the second question, we employ the coefficient of multiple regression equations, namely the bid and ask price.
Findings: The results of this study indicate significant abnormal returns around the dividend announcement date. The price formation is not influenced by dividend announcement, but it was influenced by the demand and the bid prices which implies that there is an effort of investors to maximize capital gains by selling and buying certain stocks.
Practical Implications: Dividend announcement date still contains information for investors, because the possibility of surprise factor has been reduced. Investors have already received the rumors about the dividend announcement date and the event has received financial reports, which may have been used by investors in predicting the stock price.
Originality/Value:Our study is the first to link bid and ask price to the price formation process before and after the dividend announcement date. The results of this test have answered the question that there are price changes during the dividend distribution event for testing individual levels of the company.
Keywords: Cum date, event study, abnormal return, price, ask price, bid price.
JEL codes: G30, G32, G29.
Paper Type: Research Paper.
1Lecturer at the Faculty of Economics and Business, Universitas Indonesia (UI), e-mail:
budi.frensidy@ui.ac.id
2Alumnae of Master Management Program from Esa Unggul University (UEU), e-mail:
irene_zakaria@yahoo.com
3Corresponding author, Lecturer at Faculty of Economics, Tarumanagara University
1. Introduction
Generally, stock investments made by investors in companies with good prospects are reflected in high stock prices. In order to achieve the investment objectives, investors will sell (ask) and buy (bid) stocks for their portfolio respectively. Olsson (2005) asserted that the actions of buying and selling stocks by investors are conducted by using the event information (event study) as a basis for looking at whether or not there is abnormal profit or return.
According to Liu et al. (2008), abnormal returns will generally occur at the day range ahead of strategic activities of issuers (listed companies). Strategic activities of the listed companies i.e., the corporate actions are often perceived by investors as the companies’ efforts to improve their liquidity. Because liquidity is often considered as the short term income for investors, they will compete to obtain the information related to the issuer's corporate action. One of the most anticipated corporate actions is the dividend announcement. The dividend announcement will be the good news signal for investors, because the decision of dividend distribution by listed companies will be considered as the improvement of company's performance.
Ahead of the dividend announcement, it will result in investors’ reactions. The investors’ reactions that occur before and after the dividend announcement will show the differences in expectations of the investors themselves. Nurhadi (2008) states that there are two types of investors: rational investors and irrational investors. Rational investors (generally the "big players") have a long term orientation and still consider dividends as a major part of their yield. Rational investors are not likely to pursue acquisition of information on the agenda of the dividend announcement. This is because rational investors are more informed about the dividend announcement.
Dasilas and Sergios (2011) stated that irrational investors (generally "small players") would have less information in the agenda of the dividend announcement. They will not receive sufficient information for their investment. In order to remain focused on achieving the investment objectives, they will take advantage of alternative sources of information made by the stock analyst. Alternative sources of information are usually graphical trends such as dividend per share (DPS) and the typical dividend policy. The DPS trend information is used to predict future stock prices so that the target capital gain can be well-predicted. The typical dividend policy will be used to predict the cash flow pattern that will underpin the amount of DPS. On the basis of differences in the interests of rational and irrational investors related to the date and subsequent effects that often occur, the authors propose two important research questions: first, whether there is an abnormal return around the dividend announcement; second, whether price changes around that event.
2. Literature Review
Stock price illustrates the general information that is open and available, and it is provided by companies or the stock exchange to be processed by investors. Analysis of profit and dividend is commonly used by investors. This sparks expectation of earnings and price as a puzzling phenomenon where the effects are associated with a small company (Akbar and Habib 2010). The market could also experience sharp losses because it has too high expectations for the growth of companies and too pessimistic expectations of the small ones.
2.2 Investor’s Behavior
Investor’s behavior pattern is different. It is similar to risks. The risk enthusiasts can drive the market for irrational acts, leading the market to act with sentiment. This condition supports the statement that the greatest enemies of the business are the investors. However, investors’ confidence can be turned against themselves. The main concern of investors who do not like risks is to minimize them (risks), but they are willing to accept higher risks for the sake of profit above the average. Surely, the existence of irrational investors does not cause markets to be inefficient.
2.3 Event Studies and Efficient Market Hypothesis
According to Capstaff et al. (2004), it is important for investors to observe events that can change the price, because an efficient market reacts quickly and accurately to achieve a new equilibrium price which fully reflects the information available. The general approach used is abnormal return. Abnormal return measurement method is commonly used to reduce the real return to the normal return. The essence of efficient markets is the rapid reaction of price to the changing markets into the new price to be accepted by the market. It is difficult for investors to earn abnormal returns. Fama (1970) states that it would be an efficient market informationally if the prices of the securities behave as if everyone observes the information. This means no market participants can get abnormal return in an efficient market.
2.4 Signaling Theory
Signaling theory expresses a positive relationship between the asymmetry of information and the dividend announcement. Signal is often sent by a company to the market, but unfortunately not all investors have equal access to the information signal. Positive information signal indicates significant abnormal return to the market. The opposite is true for negative information signal. Abnormal return for a group of investors reinforces the notion that information asymmetry will strengthen the reaction because the agenda is declared.
2.5 Theory of Demand and Supply
be daily, monthly, or yearly depending on the demand conditions and availability of goods. The value of goods depends on their usefulness. Demand also depends on the price of the goods, the price of other goods, and consumers’ income or predictions of the future. The law of demand states that demand will be higher if the price of an item is lower. On the other hand, demand will be less when the price is higher. Investors want to buy at lower prices with the hope that they can obtain profit when they resell (Thalassinos et al., 2013; 2009).
The theory of supply is the company's ability to offer a certain item at a certain price within a certain period. The offer will be reduced when prices go down, or if they do not meet the desired profit. Offer price is determined by the cost of the product itself, the price of other goods and the profits to be obtained. The stock market can offer it in the form of bids based on the principle of time priority and price priority according to the trading system at BEI as an order-driven market.
3. Research Methodology
3.1 Research Framework
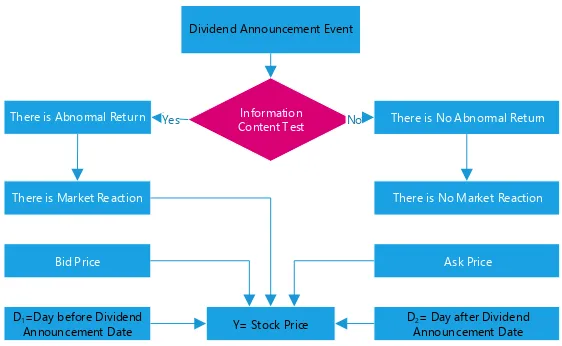
An event study is a statistical method to assess the impact of an event on the return or the value of a firm. The basic idea is to find the abnormal return attributable to the event being observed by adjusting for the return that stems from the price fluctuation of the market as a whole. If there are abnormal returns through the shock of an event, it can be said that the event contains useful information for the market to make decisions quickly, because the market sees value of the information to the company.
Figure 1, shows how the speed market reacts to absorb the information of the event after testing the market efficiency of the content of the information published. An efficient market information would quickly react to information announced by the company and investors quickly perform analysis to make a decision to buy or sell action, as seen through the abnormal return absorbed by investor to get a new price equilibrium.
Figure 1. Conceptual Framework
Information Content Test
There is Abnormal Return There is No Abnormal Return
There is No Market Reaction
No Yes
There is Market Reaction
Bid Price
D2= Day after Dividend
Announcement Date D1=Day before Dividend
Announcement Date
Ask Price
Dividend Announcement Event
Y= Stock Price
3.2 Research Hypotheses
The research hypotheses are temporary answers to the proposed research:
H1: There is a significant abnormal return around the date of increasing dividend. H2: There is a price change around the announcement date.
3.3 Operational Definition and Measurement of Variables
Daily return to the company is the difference in price (capital gain or capital loss) of securities to the previous day's price. Daily return of the company is measured:
Pi, t - Pi,t-1
R i,t = --- (1)
Pi,t - 1
where: Ri, t = Return of the actual stock i on day t; Pi, t = Price of stock i on day t;
Pi,t-1 = Price of stock i on the previous day (t-1).
Market return index is a calculation of the returns using daily stock market prices of the Composite Stock Price Index (CSPI or IHSG) around the announcement date. Market return index is calculated by:
JCIt - JCIt-1
Rm,t = --- (2)
where: Rm,t = Market return on day t; JCIt = Composite stock price index on day t;
JCIt-1 = Composite stock price index on the previous day.
Abnormal return is the difference between the actual return and the normal return. The normal return is the expected return, assuming there is no specific event. Expected return is calculated using a market-adjusted model. The use of the market-adjusted model is due to the fact that this model no longer needs the estimation period to establish it. It is assumed that this model gives the best estimated return. Abnormal return is measured by:
ARi t = Ri,t - E (R) i,t (3)
where: ARi,t = Abnormal return of stock i on day t; Ri,t = Actual return of stock i on
day t; E(R)i,t = Expected return of stock i on day t.
The data are obtained from companies that announced dividends during the period 2007 - 2012 and with the increasing dividends for the three consecutive years.
4. Results
The mean difference test was used to look at differences in average abnormal return before, during, and after the dividend announcement. For H1, using t-test at significant level of 10%, t-statistics is greater than t-table. Therefore, H1 can be accepted that there is abnormal return at significance level 0.10%. We use multiple regression to get the effect of independent variables i.e., ask price (At), bid price (Bt), and dummy
1 (D1) to measure the day before the announcement of dividends, while dummy 2 (D2)
is employed to measure the day after the announcement of the dividend toward the dependent variable i.e., stock price (Pt). The model is formulated as follows:
Pt = α0 + α1At + α2D1 + α3D2 + ε i,t (4)
Pt = β0 + β1Bt + β2D1 + β3D2+ ε i,t (5)
where: Pt = Price t, α0, β0 = intercept, α1, ... β3 = regression coefficients,
At = Ask price t, Bt = Bid price t, D1= Dummy 1 (the day before the dividend
announcement), D2 = Dummy 2 (the day after the dividend announcement).
The 2nd hypothesis would be accepted if the regression coefficients α
1, …, β3
influenced Pt significantly. In this case, the variables that are expected to be significant
at the minimum level of 10% are At and Bt as the coefficient α1 and β1 are the
coefficients of the ask price and the bid price.
5. Discussion
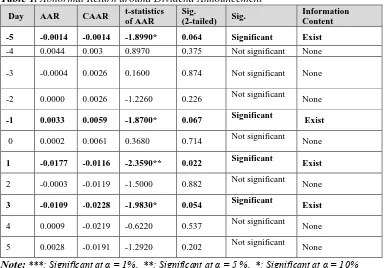
announcement is not different from zero. The market reacted negatively five days before the announcement, on one day and three days after the dividend announcement. On the other hand, the market reacted positively only one day before and one day after the dividend announcement date.
Table 1. Abnormal Return around Dividend Announcement
Day AAR CAAR t-statistics of AAR
Sig.
(2-tailed) Sig.
Information Content
-5 -0.0014 -0.0014 -1.8990* 0.064 Significant Exist
-4 0.0044 0.003 0.8970 0.375 Not significant None -3 -0.0004 0.0026 0.1600 0.874 Not significant None
-2 0.0000 0.0026 -1.2260 0.226 Not significant None
-1 0.0033 0.0059 -1.8700* 0.067 Significant Exist
0 0.0002 0.0061 0.3680 0.714 Not significant None
1 -0.0177 -0.0116 -2.3590** 0.022 Significant Exist
2 -0.0003 -0.0119 -1.5000 0.882 Not significant None
3 -0.0109 -0.0228 -1.9830* 0.054 Significant Exist
4 0.0009 -0.0219 -0.6220 0.537 Not significant None 5 0.0028 -0.0191 -1.2920 0.202 Not significant None
Note:***: Significant at α = 1%, **: Significant at α = 5 %, *: Significant at α = 10%
From the test results above, the alternative hypothesis (H1) is accepted. Abnormal return still exists around the announcement date of the dividend, namely five days and one day before the before the announcement as well as one day and three days after the announcement. It proves that there is abnormal return from dividend announcement. The information content of dividend announcement does not provide a significant advantage under the assumption of efficient market information; all have received the information. It is declared that there is no chance to get more profit. Increased dividend information is known by every investor, so that no one can enjoy the abnormal return. This is consistent with the efficient market hypothesis, that no one can enjoy more return. Analysis of the stock selling and buying prices, with a realistic look to the price of the sale price and the purchase price can be done to see if the price is determined by the announcement of dividend or other causes.
gains no significant abnormal return from the observation period on the dividend announcement date. The t-test proves no information content on day one after the announcement of dividend. From the test results above, the alternative hypothesis (H1) that there is a significant abnormal return around the announcement date of the dividend increase is acceptable, because there are more advantages derived from the cum dividend announcement date. It still has a significant abnormal return.
5.1 Ask Price Changes Regarding Announcement of Dividend
In Tables 2 and 3 below the regression model has an R-square of 0.960 which means the selling price (ask price) can explain the dependent variable by 96% and the remaining 4% is explained by other factors such as economic conditions, political, fundamental, level of inflation, and others. The model also accepts H2, the alternative hypothesis that price changes around the announcement date.
Table 2. SPSS Output from R-Square on Price, Ask Price, Five Days Before and After
Dividend Announcement
Model R R Square Adjusted R
Square
Std. Error of the Estimate
1 .980a .960 .960 4132.69626
Table 3. SPSS Output from Regression Model on Price, Ask Price, Five Days Before
and After Dividend Announcement
Model Unstandardized
Coefficient
Standardized Coefficient
t Sig.
B Std. Error Beta
(Constant) 1635.798 265.532 6.160 .000
Ask Price .711 .005 .980 131.415 .000
Days Before 46.439 387.968 .001 .120 .905
Days After -165.191 387.970 -.004 -.426 .670
The regression model can be described by the following equation:
Pt = 1635,798 + 0,711A1***+ 46,439D1 - 165,1916 D2
In this model above Pt can be seen as the direction of the selling price influences on
stock price. This is significant but not significant in terms of time. Every increase in selling price (ask price) of 1 point will raise the price by 0.711 point. The regression analysis model has a significant value of 0.000 indicating that the model can be used to predict future prices. The model accepts the alternative hypothesis (H2) that price changes around the announcement date.
From Tables 4 and 5 below, the regression analysis model has an R-square value of 0.549 which means the purchase price (bid price) can explain prices by 54.9% and the remaining 45.1% is explained by other factors outside the trade situation. The model accepts H2 which means that price changes around the announcement date.
Table 4. SPSS Output from R -Square on Price, Bid Price, Five Days Before and
After Dividend Announcement
Model R R Square Adjusted R
Square
Std. Error of the Estimate
1 .741a .549 .547 13852.81293
Table 5. SPSS Output from Regression Model on Price, Ask Price, Five Days Before
and After Dividend Announcement
Model Unstandardized
Coefficient
Standardized Coefficient
t Sig.
B Std. Error Beta
(Constant) 4445.852 886.610 5.014 .000
Bid Price .513 .017 .741 29.638 .000
Days Before 90.614 1300.473 .002 .070 .944
Days After -241.262 1300.475 -.006 -.186 .853
The regression model can be described by the following equation:
Pt = 4445,852 + 0,513Bt***+ 90,614 D1 - 241,262D2
Regression model above shows that the purchase price affects the price at the same direction, one point increase in the purchase price (bid price) will raise the price by 0.513 point. But the effect of the day or the time to is not significant. The regression analysis model has a significant value of 0.000 which indicates that the model can be used to predict future price and the value of R square of 0.549, which means that the purchase price (bid price) can explain prices by 54.9% and the remaining 45.1% is explained by other factors. Results of R square from the selling price is about 0.96 which is greater than R square of the purchase price. This indicates that the reaction to the ask price (sell) is more powerful than the purchase price (bid) in influencing investor decisions.
5.3 Changes in Dividend Announcement Regarding the Price of Each Company
Table 6. Regression Model from Ask Price, Bid Price, and Days before and Days after
Dividend Announcement on Price of Each Listed Firm
No Name of
Listed Firms Variabl e X Un. Std. Beta Dummy 1 Coefficien t Dummy 2 Coefficien t Status 1
Summarecon Ask 1.031*** -8.64* 9.69* Sell Price Position
Summarecon Bid 0.954** 29.82 78.84 Buy Price Position
2
Indofood S.M. Ask 0.956*** 64.14 35.36 Sell Price Position
Indofood S.M. Bid 0.980*** 95.47* 17.84 Buy Price Position
3
Indocement Ask 1.019*** -248.98* -59.69 Sell Price Position
Indocement Bid 1.023*** -222.81* -77.43 Buy Price Position
4
Kalbe Farma Ask 1.000** 8.333 -58.333 Sell Price Position
Kalbe Farma Bid 0.779* 121.32 -112.89 Buy Price Position
5
Telkom Ind. Ask 0.836*** 40.64 -227.18 Sell Price Position
Telkom Ind. Bid 0.841*** 45.07 -221.08 Buy Price Position
6
Goodyear Ask 0.274*** 38.43 7.55 Sell Price
Position
Goodyear Bid 0.265** -5.79 -22.39 Buy Price
Position
7
Panin Sekuritas
Ask 0.965*** -40.26 -74.85 Sell Price Position
Panin Sekuritas
Bid 1.002*** 45.05 -54.73 Buy Price Position
8
Trias Sentosa Ask 1.009*** 14.94 12.55 Sell Price Position
Trias Sentosa Bid 1.009*** 12.95 8.56 Buy Price Position
9
Delta Djakarta Ask 0.708*** 124.19 -509.93 Sell Price Position
Delta Djakarta Bid 0.191** 502.01 -2486.86 Buy Price Position
10
Jaya Property Ask 0.502*** -2.37 24.86 Sell Price Position
Jaya Property Bid 0.763*** 10.253 -6.53 Buy Price Position
11
Mandala Finance
Mandala Finance
Bid 1.059*** -1.879 7.761 Buy Price Position
12
Mayora Indah Ask 0.991*** 74.81 318.32** Sell Price Position
Mayora Indah Bid 0.996** 47.107 209.42 Buy Price Position
13
Jaya Ancol Ask 0.261 -8.26 -14.78 Sell Price Position
Jaya Ancol Bid 0.799*** -20.39 -56.88** Buy Price Position
14
Indo Tambang Ask 1.003*** -345.39
-1067,34** *
Sell Price Position
Indo Tambang Bid 0.994*** -188.62
-967.35***
Buy Price Position
15
Surya C. Media
Ask 0.926*** 668.53** -710.68** Sell Price Position
Surya C. Media
Bid 0.970*** 677.3** -621.04* Buy Price Position
Note: ***: Significant at level α = 1% **: Significant at level α = 5 % *: Significant at level α = 10%.
From the analysis of the bid price, ask price, and the stock price, the effect of the sale price and the purchase price to the price are significantly different, in which the sales price is more significant than the purchase price. The test results of the price analysis indicate the acceptance of H2. There is one company which predominantly influences price formation around the dividend announcement. That company is Surya Citra Media. All independent variables namely the ask price, the bid price, dummy 1 (before the dividend announcement), and dummy 2 (after the dividend announcement) have an influence on market prices. The 14 other stocks only have a partial effect on the ask price and the bid price.
6. Conclusions and Recommendations
accepts it as good news. This proves the theory of efficient market hypothesis which proposes that the market is efficient in information, meaning that all have received the information declared that there is no chance to get excess return. From the conclusion of the study, it can be recommended that:
a) Companies may utilize the Indonesia market that has been towards efficient market through increased dividend announcement as a signal that the company has a good performance, professionally managed, well governed, and accountably reported.
b) Investors should consider and utilize dividend announcement date in buying and selling stocks in order to avoid losses and also the conditions of support and resistance to increase the offer price to meet the desired profit.
c) Regulator namely BEI should require the issuer to pay dividends to shareholders as a form of their performance. The obligation to pay dividends has been done since the privatization of state-owned companies rolled out in the early years of the 2000s. Dividend announcement should not be seen as a signal alone but rather as a mandate or an obligation that must be met by the public companies.
References:
Akbar, M. and Habib, H.B. 2010. Reaction of Stock Prices to Dividend Announcements and Market Efficiency in Pakistan. The Lahore Journal of Economics, 15,1, 103-125. Capstaff, J., Audun, K. and Marshall, P.A. 2004. Stock Price Reaction to Dividend
Announcements: Empirical Evidence on the Signaling Model from the Oslo Stock Exchange. Multinational Finance Journal, Vol. 8, No.1, 115-139.
Dasilas, A. and Sergios, L. 2011. Stock Market Reaction to Dividend Announcements: Evidence From the Greek Stock Market. International Review of Economics and Finance, Vol. 20, 302-311.
Doddy, S. and Jogiyanto, M.H. 2003. Testing of Market Efficiency Forms Half Strong Decision Analysis Dividend Increase Announcement. Indonesian Journal of Accounting Research, Vol 6, No 2, 131 - 144.
Fama, Eugene F. 1970. Efficient Capital Markets: A Review of Theory and Empirical Work. The Journal of Finance, Vol. 25, No. 2, 383-417.
Liu, Yi, Szewczyk, H.S. and Zaher, Z. 2008. Underreaction to Dividend Reductions and Omissions. The Journal of Finance, Vol. LXIII, No. 2, 987-1020.
Nurhadi, W.R. 2008. Dividend Policy Studies: Antecedents and Impact on Stock Price. Journal of Management & Entrepreneurship, Vol 10, No.1, 1-17.
Olsson, R. 2005. Implications of Constant Growth of Abnormal Earnings in Perpetuity for Equity Premia, Discount Rates, Earnings, Dividends, Book Values and Key Financial Ratios: An Extension of Claus and Thomas. Working paper from University of Umea, Umea School of Business and Economics, 1-43. Siaputra, L. and Atmadja, S.A. 2006. Effect of Dividend Announcement on Stock Price
Sularso, R.A. 2003. Effect of Dividend Announcement on Stock Price Change (Return) before and after the Ex-Dividend Date in Jakarta Stock Exchange (JSX). Journal of Accounting & Finance, Vol. 5, No.1, 1-17.
Thalassinos, I.E., Hanias, P.M., Curtis, G.P. and Thalassinos, E.J. 2013. Forecasting financial indices: The Baltic Dry Indices. Marine Navigation and Safety of Sea
Transportation: STCW, Maritime Education and Training (MET), Human Resources and Crew Manning, Maritime Policy, Logistics and Economic Matters; Code 97318, 283-290, ISBN: 978-113800104-6.
Thalassinos, I.E., Hanias, P.M., Curtis, G.P. and Thalassinos, E.J. 2009. Chaos theory: Forecasting the freight rate of an oil tanker. International Journal of Computational Economics and Econometrics, 1(1), 76-88.