2486
An Efficient Data Analytics Model For Predicting
The Harmful Effects Of Air Pollutants
G. Naveen Sundar, D. Narmadha, Samson Immanuel
Abstract : Predicting the harmful effects of air pollutants using data mining method helps to assess the impact on health from various pollutants. As such, unsupervised learning method is an important tool for assessing the harmful effects of air pollutants. This method uses the concept of K-means clustering to clusters the pollutants with similar health effects. This approach also helps to predict the health risks of outdoor air pollution and gives an overview of the general precautionary measures needed when exposed to severe pollutants.
Keywords: Air pollution analysis, air pollutants, prediction methods, risk assessment, adverse effects.
————————————————————
I.
INTRODUCTION
For an environmental modeling, prediction in air pollution is an important task. According to the WHO report in 2014, due to the cause of air pollution7 million peoples were dead worldwide. The pollutants that are considered in this research are sulphur dioxide, nitrogen dioxide and ozone. The cause of sulphur dioxide in atmosphere is due to the burning of fossil fuels by power plants and other industrial amenities. Sulphur dioxide harms the human organs like respiratory system, coughing, wheezing and asthma etc. The reasons for the formation of nitrogen dioxide is naturally due to the lighting but higher percentage of nitrogen dioxide persist in the atmosphere is due to the exhaust from vehicles. The increased level of nitrogen dioxide content present in air leads to the deduction of immunity in human lungs. Finally, ozone is a gas which is the combination of three atoms of oxygen. Ozone will have an existence in the upper layer and ground level in atmosphere. The upper level of ozone will cover us from the effect cause by the ultraviolet rays but the ground level ozone is created by chemical reaction between oxides of nitrogen. Breathing this ozone by the human beings leads to the damage of lung tissue. The atmospheric air quality can be degraded due to the amount of pollutants present in the air due to smoke emitted from the industries and vehicles. This can critically affect our environmental areas surrounded by waters and soil. So, it is essential to acquire necessary information on the type of pollutants present in the environment.
II.
RELATED WORK
In the areas related to weather prediction and meteorology, data mining have been used by many researchers. Sarah N. et. al. [1] proposed a method to extract knowledge from the weather historical data by using various data mining techniques such as clustering, prediction, classification and association rule mining techniques. Bilgin T et. al. [2] focused on applying DBSCAN based clustering algorithm on air temperature data to cluster the Turkey region into different clusters of similar climatic characteristics. Nandagopalet. al.
[3] introduced a method to generate inter transactional association rule mining to predict weather data using multi-station meteorological data. This method focused to generate N dimensional predictive analysis. Nocke T et. al. focused to apply multivariate pattern recognition techniques that may help to investigate climate data under various aspects simultaneously for a wide range of research questions. J. F. Peterset. al [4] emphasis on using a rough set theory approach for analyzing the storm events which are highly responsible for severe summer weather. S. Christyet. al [5] focused on collection air quality data collected from Tamil Nadu Pollution Control Board air quality data available in the websites. The quality of air is collected and monitored with the help of wireless sensors deployed in huge numbers. Feed forward and multilayer perception techniques are used for the prediction, forecasting and support in making effective decision process. Gupta et al.[6] analyzed about the air quality data in the urban regions of Kolkata. The air pollutants data such as Sulphur Nitrogen
___________________
Department of Computer Science Engineering, Karunya Institute of Technology and Sciences, Coimbatore.
Department of ECE, Karunya Institute of Technology and Sciences, Coimbatore.
Email:- [email protected],
dioxide, ammonia as well as meteorological parameters such as rainfall, wind direction, temperature and relative humidity were acquired and analyzed. Vaidhyanathanet. al [7] used hierarchical Bayesian based prediction to assess air quality and to generate metrics on county level. However, it does not focus on hourly prediction of harmful effects of air pollutants. Kim SY et. al [8] used two common prediction methods such as nearest neighbor and kriging to predict the harmful effects of air pollutants. Even though, these methods does a good health effect estimate they do not predict all the harmful effects of air pollution. Brunekreef B et. al [9] gave a detailed study on the respiratory and cardiovascular disease caused when exposed to air pollution. A. Koschinsky [10] gave insight on how conventional terrestrial mining is used to overcome the problems related to environmental factors. The authors of [11] gave insight into the various sources that causes the environment to be polluted. The researchers in [12] introduced a machine learning method to predict the measure the atmospheric pollutants in air. They don’t predict the outcome of the harmful effect of pollutants in the atmosphere. The authors of [14],[15] data mining technique evaluate the impact of air pollutants in human health.
III.
SYSTEM ARCHITECTURE
The architecture diagram shows the overall architecture of analyzing air quality data. It starts with the dataset. In this approach shown in Fig.1, air pollutant data for different pollutants in a region is taken for a period of one year. The data is in the form of comma separated values (csv) and contains fields like Station id, Pollutant Name, and its value in ppb over 24 hours. This data is imported to IBM SPSS Modeller which is a Big Data analysis tool .The next step is clustering, the data is clustered to group similar objects together based on pollutants and it’s corresponding value.
Fig. 1. System Architectural of the Proposed Work
The algorithm used for clustering is K-Means and based on value it is clustered into 5 clusters. Based on pollutants it forms different clusters for each pollutant. Now there are N clusters each clustering holding the data of each pollutant. Then each pollutant's data is taken separately for analysis. The data before processing is represented as a multi-plot to show its pattern, then statistical analysis is done to find the hourly maximum, minimum, range and average.
The daily average is also found for each day and added as a new field. In the next step any non-critical values are eliminated. Non critical values are those that are not above a level that they become harmful to humans. Each pollutant becomes dangerous at different levels so a careful analysis is done on each pollutant under analysis to find its critical levels and from these levels the Air Quality Index can be identified. The values that are not dangerous are eliminated. Finally, a dataset with only critical values are identified. The Air Quality Index for each pollutant is found out and the ranges are identified as good, moderate unhealthy for sensitive, unhealthy, very unhealthy and based on the AQI a dot plot is drawn. The dot plot shows the different ranges in AQI in the x axis and the date in Y axis and each individual dot represents one instance in the data. Then a report is shown for reference and this shows the effects of the pollutant in each of its ranges for understanding the health impact of that particular pollutant. The multiplot graph is used to represent the critical values which are shown in daily and hourly basis. For hourly basis the transpose of the critical data is taken and plotted .At the end the system has multiple outputs and takes a single dataset as input.
IV.
RESULTS AND DISCUSSION
Fig. 2. Data set Selection.
Fig. 2 shows the air pollution data collected from data.gov.uk. The dataset includes the emission of air pollutants such as sulphur dioxide, nitrogen dioxide, Ozone, ammonia and other particulate matter. SPSS software is used for editing and analyzing the data.
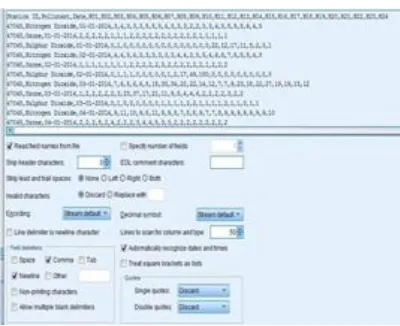
Fig. 3. Screen Layout
2488
shown in the form of a spreadsheet. In the first sheet, the original data is displayed and the second sheet meta data is shown.
Fig. 4. Clustering using K means
Figure 4 displays the output for clustering using k means clustering algorithm. The figure shows that three clusters are formed from the air pollution data and each represents a particular pollutant. Cluster size portrays the average distribution of data in each cluster, size of the smallest cluster, size of the largest cluster. Descriptive statistics can be performed using SPSS software. It helps to find the mean, minimum and maximum value within each cluster.
Fig. 5.Air Quality Index calculation
Figure 5 shows the air quality index value for moderate, unhealthy for sensitive, unhealthy and very unhealthy conditions. When the air quality index value is between 0 and 50, the quality of air is good. If the value falls between 51 and 100, the quality of air is moderate. If the value falls between 101 and 150, it may be unhealthy to sensitive groups. If the value is between 151 and 200, it is an unhealthy condition. If the value is between 201 and 300, it may be very unhealthy. If the value is between 301 and 500, it may be very hazardous to health. Based on the air quality
Fig. 6.prediction of harmful effects on daily basis
Fig. 7.Multi-plot representing hourly values in ppb
Figure 7 displays the multiplot representation of the harmful effects of sulphur dioxide on hourly basis. It is clear the effect of the pollutant is very severe during day time. In this diagram, X-axis shows different hours in a day and Y-axis shows the amount of Sulphur dioxide during day time. It is noticeable that the effect of pollutant is very high during the 18th hour. The value is 300 ppb (parts per billion) which may cause very serious lung and respiratory illness.
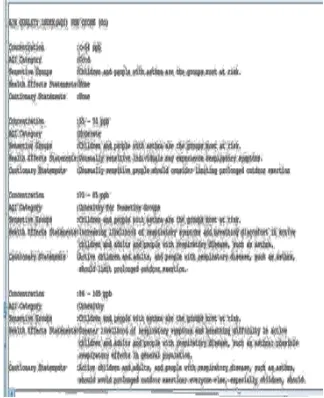
Fig. 8 Air quality index report for Ozone (O3)
Figure 8 shows the air quality index report for Ozone (O3). It is observed clearly that children and people
with asthma are affected when the air quality index value <=54 ppb. When the concentration is between 55 and 70 ppb, sensitive people may undergo respiratory symptoms and it is advisable to avoid prolonged outdoor activities. When the concentration of pollutants is between 71-85 ppb, children and people with asthma are at risk. So, it is advisable for active children and adult to limit prolonged outdoor exertion. When the amount of pollutants is between 86-105 ppb, active children and people with respiratory disease such as asthma should avoid prolonged outdoor exertion.
V.
CONCLUSION
Air pollution can cause severe harm to health when it is collected in very high concentration in air. The air pollutants such as nitrogen dioxide, sulphur di-oxide and Ozone continue to cause respiratory and cardio vascular illness. The continuous improvement in the prediction methods would help us to understand the importance of applying data analytics in air pollution data. In this research work, the air pollutants with similar harmful effects have been identified using unsupervised method and precautionary measures are also explored.
REFERENCES
[1] Sarah N. Kohail, Alaa M. El-Halees, ―Implementation of Data Mining Techniques for Meteorological Data Analysis‖, International Journal of Information and Communication Technology Research, Volume 1 No. 3, July 2011 ISSN -2223-4985.
[2] Bilgin T., and Çamurcu Y., "A Data Mining Application on Air Temperature Database", Advances in Information Systems, Springer Berlin, Heidelberg, pp.68-76. 2004.
[3] S. Nandagopalet. al, Mining of Metereological data using modified Apriori Algorithm, European Journal of Scientific Research, Vol. 47, No.2, pp. 295-308, 2010.
[4] Nocke T., Schumann H., Böhm U., ―Methods for the Visualization of Clustered Climate Data‖, Computational Statistics 19(1), pp. 75–94, 2004.
[5] Peters J., Suraj Z., Shan S., Ramanna S., Pedrycz W., Pizzi N., "Classification of meteorological volumetric radar data using rough set methods", Pattern Recognition Letters, pp.911–920. 2003.
[6] Gupta A. K., Karar K., Ayoob S. and John K. (2008), ―Spatio-Temporal Characteristics of Gaseous and Particulate Pollutants in an Urban region of Kolkata‖, India. Atmospheric Research, 87: 103-115.
[7] Ambarish Vaidyanathan, William Fred Dimmick, Scott R Kegler and Judith R Qualters., (2013), ―Statistical air quality predictions for public health surveillance: evaluation and generation of county level metrics of PM2.5 for the environmental public
health tracking network‖, International Journalof Health Geographics, Mar 2013, Vol.12, Issue 12.
[8] KIM SY, Sheppard L, Kim H., ―Health effects of long-term air pollution: influence of exposure prediction methods‖, Epidemiology, Vol. 20, Issue 3, May 2009.
2490
respiratory and cardiovascular mortality in the Netherlands: the NLCS-AIR study‖, Research Report, Health Effect Institute, Vo. 139, pp. 5-71, Mar 2009.
[10]A. Koschinsky, L. Heinrich, K. Boehnke, J.C. Cohrs, T. Markus, M. Shani, et al., ―deep-Sea mining: interdisciplinary research on potential environmental, legal, economic, and societal implications, Integr. Environ. Assess. Manag. (2018) 1–20.
[11]P.P.E. Weaver, D.S.M. Billett, C.L. Van Dover, Environmental risks of deep-Sea mining, in: M. Salomon, T. Markus (Eds.), Handbook on Marine Environment Protection, Springer International Publishing, Cham (CH), 2018, pp. 215–245.
[12]R. Sharma, deep-sea mining: current status and future considerations, in: R. Sharma (Ed.), Deep-Sea Mining Resource Potential, Technical and Environmental Considerations, first ed., Springer International Publishing, Cham (CH), 2017, pp. 3– 21.
[13]Siwek, K. and Osowski, S., 2016. Data mining methods for prediction of air pollution. International Journal of Applied Mathematics and Computer Science, 26(2), pp.467-478.
[14]K. Van Nijen, S. Van Passel, D. Squires, A stochastic techno-economic assessment of seabed mining of polymetallic nodules in the Clarion Clipperton Fracture Zone, Mar. Policy (2018).