Licensed under Creative Common Page 1
http://ijecm.co.uk/
ISSN 2348 0386
ANALYSIS OF FACTORS RESPONSIBLE FOR PROJECT
COST UNDERESTIMATION IN NIGERIA
Emmanuel C. Ubani
Department of Project Management Technology Federal University of Technology, Owerri (FUTO), Nigeria
ibeecheme@yahoo.com
Enoch O-M. Omajeh
Department of Project Management Technology Federal University of Technology, Owerri (FUTO), Nigeria
eomajeh@gmail.com
Onyinyechi F. Okebugwu
Department of Project Management Technology Federal University of Technology, Owerri (FUTO), Nigeria
francescaoke@gmail.com
Abstract
Since cost estimates are the basis for decision making regarding project selection,
underestimation lead to selection of project with significant cost risks. This paper analyzed the
factors responsible for project cost underestimation, with the aim of determining the main cause
of the problem and proposing appropriate remedies. Using a questionnaire survey, 64
individuals rated 18 factors responsible for cost underestimation. The relative importance index
(RII) used as analytical tool reveal that unintentional factors (inadequate information, project
complexity, inexperienced forecasters, or future uncertainties) are not the main factors
responsible for cost underestimation; but the main factors are intentional such as project
promoters intentionally understating cost to gain acceptance and funding commitments for
project. A t –test analysis of cost data from 15 projects revealed that there is a significant
Licensed under Creative Common Page 2
estimation in large and small projects, or in projects estimated in different time periods. It is
concluded that project cost underestimation can best be explained as intentional, with project
promoters having strong incentives to understate project costs. It is recommended that
disincentives for intentionally understating cost should be introduced such as sanctions, fines,
and even legal prosecution.
Keywords: Project Management; Project Costs; Cost estimation; Cost Underestimation; Hiding
Hand Principle; Strategic Misrepresentation
INTRODUCTION
Project cost estimates are the basis for serious decision making, it is therefore important that the estimates of project costs are accurate; that is, as much as possible they truly reflect the actual cost of completing the project. As Akintoye (1998) noted, the impact of inaccurate cost estimating on contracting business is significant. But, despite the well documented importance of accurate cost estimates and the dire consequences of inaccurate estimates; Flyvbjerg et al (2002), Akintoye (1998), Pickrell (1990), and Wachs (1990) discovered in their different studies that project cost estimates are consistently inaccurate.
Depending on the higher of actual costs and estimated costs, cost estimation inaccuracies generally take two forms: overestimation and underestimation (Akintoye, 1998). Overestimation is where the estimated costs are higher than the actual costs of completing the project, while underestimation is where the actual costs significantly exceeds the estimated costs. Researchers seem to agree that cost overestimation is not much of a problem as cost underestimation (Flyvbjerg et al, 2002; World Bank, 2004; Creedy, 2006). The error of underestimating costs is significantly much more common and much larger than the error of overestimating costs.
Licensed under Creative Common Page 3 project time overrun, shoddy deliverables, temporary abandonments, and even permanent abandonment. The objectives of this study are therefore to:
Identify and examine the factor(s) mainly responsible for project cost underestimation so
as to control and take into consideration the salient factors to be used in enhancing accuracy of project cost estimation.
Rank the factors in order of their significance using Relative Importance Index (RII) as
analytical tool
Establish if there is any significant difference between: private sector and public sector projects; large and small projects; projects in a first period (1984 – 1999) and projects in a second period (2000 – 2014).
LITERATURE REVIEW
Explanations of Cost Underestimation
According to Flyvbjerg (2009), three main types of explanations exist that claim to account for cost overruns and benefit shortfalls in major infrastructure projects. These are: Technical; Psychological; and Political-Economic.
Technical factors: These factors are the most common type of explanation of inaccuracy in forecasts (Morris and Hough, 1987; Wachs, 1990; Flyvbjerg et al., 2002, 2005). Some of the factors ranked under technical explanations in the open literature are: Imperfect forecasting techniques (Hester et al, 1991) Inadequate data (Hartgen et al, 1997; Creedy, 2006), Inherent problem in predicting the future, Lack of experience on the part of the forecasters, Honest mistakes (Flyvbjerg et al., 2002, 2005).
Psychological explanations: This attempt to explain inaccuracies in forecasts by a bias in the mental make-up of project promoters and forecasters (Flyvbjerg et al., 2002). Psychological explanations account for cost overruns and benefit shortfalls in terms of what psychologists call the planning fallacy and optimism bias (Kahneman and Tversky, 1979; Lovallo and Kahneman, 2003). The most common psychological explanation is probably that of “appraisal optimism.”
According to this explanation, promoters and forecasters are held to be overly optimistic about project outcomes in the appraisal phase of projects (Mackie & Preston, 1998; World Bank, 1994, p. 86).
Licensed under Creative Common Page 4 forecasting the outcomes of projects. They do this in order to increase the likelihood that it is their projects, and not the competition’s, that gain approval and funding.
Theories that aid Cost Underestimation
Many researchers have postulated theories that are responsible for cost underestimation. There are certain theories, principles and concept that though were developed for the utmost good, but whose application is seen to lend a helping hand to cost underestimation. Examples include: the principle of the hiding hand, the salami tactics, and the noble lie.
1) The Principle of the Hiding Hand: The principle as developed and coined by Hirschman (1991) is essentially a way of inducing action through error, the error being an underestimate of the project's costs or difficulties. What this principle suggests is that, far from seeking out and taking up challenges, people are apt to take on and plunge into new tasks because of the erroneously presumed absence of a challenge because the task looks easier and more manageable than it will turn out to be. As a result, the Hiding Hand can help accelerate the rate at which people engage successfully in problem-solving: they take up problems they think they can solve, find them more difficult than expected, but then, being stuck with them, attack willy-nilly the unsuspected difficulties- and sometimes even succeed (Hirschman, 1991).
Licensed under Creative Common Page 5
3) Noble Lie: By definition (Business Dictionary, 2011), a noble lie is a myth or untruth, knowingly told by an elite to maintain social harmony or to advance an agenda beneficial to the general public. As noted by Flyvbjerg et al (2002), the noble lie principle has crept into project management especially in the public sector, and persons are using the principle as a basis for underestimating costs of public works. This could be in situations where a particular development project would serve the people’s interest, but the actual cost figures might kill
public support for the project. The noble lie is told; cost are significantly understated; the pu blic weigh the perceived projects benefits against the cost estimates they are given and finding them favourable, throw their support behind the project even hailing the project promoters. But if actual costs data had been revealed, various uproars would have been heard; popular among them would be that the project promoters or leaders simply want to use the proposed project to siphon public funds. Not only will the public condemn the project, they could distrust the leaders and loss faith in the administration and that has its attendant consequences.
Research Gaps based on review of current literature on Project Cost Underestimation
Many research works have been conducted in the areas of project cost estimation, but little or none has been extended and explored in the area of project cost underestimation. Project cost underestimation is one of the major problems plaguing project management as the success of project management depend on the accuracy of cost estimation. There are some gaps based on the review of current literatures on project cost underestimation that this research aims to fill. There is no agreement among researchers as to the main factor(s) responsible for the problem of project cost underestimation. For example, Akintoye (1998) studied technical factor; Kahneman and Tversky (1979) and Lovallo and Kahneman (2003) advanced psychological explanations such as estimators’ over-optimism as the major cause of the problem; while
Flyvbjerg et al (2002) and Flyvbjerg (2009) rejected both technical and psychological explanations in their studies, and concluded that economic/ political explanation which is strategic misrepresentation or lying constitutes the main reason for the problem of cost underestimation.
Licensed under Creative Common Page 6 therefore aims to fill this research gap by establishing statistically whether cost underestimation in private and public sector projects are significantly different, with a view to solving the problem. Studies in project cost underestimation have focused on large infrastructural projects only, and therefore it cannot be determined if the problem of cost underestimation is any different in relatively smaller projects.
Many of the studies establishing the abysmal performance of projects as regards cost underestimation were done using large infrastructural projects from around hundreds of millions to several billion dollars (Flyvbjerg, 2009; Sawyer, 1952; Merewitz, 1973; Pickrell, 1990). With all these studies revealing large underestimation of costs, the question that would arise is whether the problem of cost underestimation would be any different in relatively smaller project. This research gap will also be filled with this study, as it would examine both large and smaller projects, and establish statistically whether the project size affect cost underestimation.
There are few studies that examine the problem of project cost underestimation over a long time span in order to determine if there is any significant difference in the problem in different time periods. Many of the above-mentioned comparative studies of project actual costs and estimated costs pool data from one time frame. That is, they do not tell the effect of time span on cost estimating accuracy. Or in other words, is there any significant difference between cost underestimation 20 and 30 years ago with cost underestimation today? Only the study of Flyvbjerg et al (2002) examined such effects, but with a sample of only large public projects. This study will examine such effects using large and small, public and private projects.
METHODOLOGY
Two main classes of primary data were collected for a 2-part analysis; primary data collected directly from project individuals, and primary data collected from documented project files. Judgmental sampling was employed in collecting the data. The project individuals are persons that were involved in the 15 projects examined in this study in the capacity of owner, promoter, consultant, planner, scheduler, manager, or supervisor.
Licensed under Creative Common Page 7 The Relative Importance Index for each factor is given by the following expression:
RII = (𝑊𝑖 𝑋 𝑁𝑖)
5 1
𝑁51 𝑖
(Ni = number of respondents scoring each factor; i = the order number of respondents; Wi =
rating given to each factor by the respondents ranging from 1 to 5, where 1 represents ‘strongly disagree’, 2 represents disagree, 3 represents neutral, 4 represents agree, and 5 represents
strongly agree)
The primary data collected from documented project files included the cost details (cost estimate, actual completion cost) of the 15 projects project studied. The projects were all executed in different states in Nigeria. For the publicly owned, the projects’ cost detail was
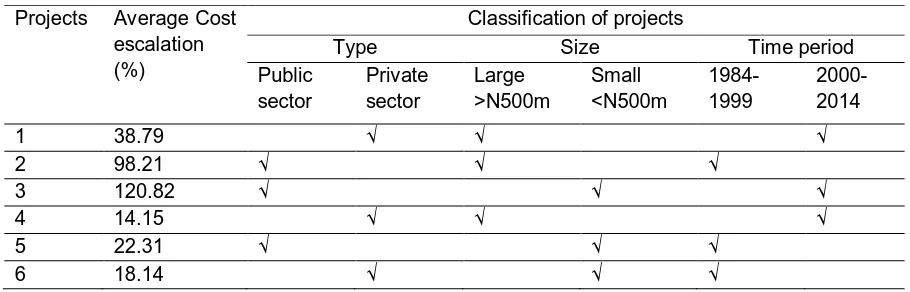
sourced from the Ministry of Works of the states, while the cost details of the privately owned projects were sourced from the files of the owners. To enable the analysis of the project cost data, 3 project classifications was employed: type, size and time period. By type classification, the projects are separated into public sector project and private sector project. By size classification, the projects are separated into large projects and small projects (The large projects are those whose actual execution costs exceeded N500, 000,000 while the small projects are those whose actual execution costs do not exceed N500, 000,000). By time period classification, the projects are separated into two; those whose cost estimates were made during the period 1984 – 1999, and those whose cost estimates were produced during the period 2000 – 2014. The t – test statistics was employed for the analysis to determine: whether
cost underestimation in private and public sector projects differ significantly; whether cost underestimation in large and relatively smaller projects differ significantly; and whether cost underestimation in one time period (1984 – 1999) and in another time period (2000 – 2014) differ significantly.
The formula for computing the t test is as below:
t cal =
𝑀1− 𝑀2
𝑁 1 𝑆12+ 𝑁2𝑆22
𝑁 1+ 𝑁2− 2 𝑁 1+ 𝑁2
𝑁 1𝑁2
(Where: N1 and N2 are the number of observation for the two groups being compared; M1 and
M2 are the mean score of the two groups; S1 and S2 are the standard deviations of the two
groups)
The decision rule on t – test is: If the tcal < ttab ; We accept that the two parameters are not
Licensed under Creative Common Page 8
ANALYSIS
Analysis of Questionnaire Data and Discussions of Findings
TABLE I: Factors Responsible for Project Cost Underestimation
Key Description of Factor
F1 Complexity of project design and construction
F2 Buildability/ constructability
F3 Uncertainties inherent in predicting the future
F4 Technological requirements and complexities of project
F5 Inadequate information and poor information flow
F6 Capacity and skills of design team
F7 Deliberately producing low estimates in order to gain approval and funding
F8 Inadequate consultancy in project cost estimation
F9 Low level of experience and/ or expertise of cost estimators/ forecasters
F10 Desperation for winning the contract
F11 Poor contractual arrangement/ requirements
F12 Change in project scope/ design/ construction requirements
F13 Frequent change in policy/ regulation
F14 Inflation and fluctuations of costs
F15 Strikes and civil unrest
F16 Over-optimism of project estimators/ forecasters
F17 Honest mistakes made during project estimation
F18 Low level of Project team experience
TABLE II: Summary of Respondents’ Rating of the Factors
Factors Strongly Agree
Agree Neutral Disagree Strongly Disagree
RII Rank
Licensed under Creative Common Page 9 The results of the analysis as presented in Table II above show that the highest ranking factors responsible for project cost underestimation are: “Deliberately producing low estimates to gain approval and funding” (ranked first with RII of 4.97), and “Desperation for winning the contract”
(ranked second with RII of 4.94). These two factors are the most significant factors responsible for project cost underestimation. The closeness of the relative importance of these two factors (4.97 and 4.94) to the highest possible relative importance (5.00) further underlines their significance as perceived by the respondents. This is in line with the conclusions reached in the 19th century by Sawyer (1952) and even recently by Flyvbjerg et al (2002) that in a number of ultimately successful economic undertakings, deliberately underestimating cost were crucial to getting the enterprise launched at all, and that had the total investment required been accurately and objectively known at the beginning, the project would not have been begun. The other factors in the ranking are all factors that cannot be termed as deliberate/ intentional as opposed to the first two factors in the rankings in which project costs are deliberately understated; and none of these other factors have importance of up to 4.00.
This further underlines the significance of the first two “deliberate” factors. “Over-optimism of project estimators/ forecasters” is third in the rankings with RII of 3.92. Optimism is
a form of self-deception where the forecasters erroneously believe that the project can actually be completed within the estimates. While it can cause cost underestimation, it is not the most significant factor, as shown by its importance index and its place in the rankings. Other mostly investigated factors such as “Inadequate information”, “complexity of design and construction”, “inexperience of forecasters”, “honest mistakes by forecasters”, and “uncertainty inherent in predicting the future” are ranked 4th, 5th, 6th, 8th, and 9th respectively, with RII of 3.91, 3.78,
3.61, 3.36, and 2.97 respectively.
Analysis of Project Cost Data and Discussions of Findings
TABLE III: summary of Projects Cost Data Projects Average Cost
escalation (%)
Classification of projects
Type Size Time period
Public sector
Private sector
Large >N500m
Small <N500m
1984-1999
2000-2014
1 38.79 √ √ √
2 98.21 √ √ √
3 120.82 √ √ √
4 14.15 √ √ √
5 22.31 √ √ √
Licensed under Creative Common Page 10
7 32.50 √ √ √
8 9.86 √ √ √
9 11.97 √ √ √
10 80.24 √ √ √
11 36.34 √ √ √
12 14.77 √ √ √
13 69.83 √ √ √
14 10.45 √ √ √
15 12.76 √ √ √
The table critical value of t (that is, t tab) is obtained at 5% level of significance and (N1 + N2 – 2)
degree of freedom. For all project classifications, (N1 + N2 – 2) = 13
Therefore, t tab = 1.77
TABLE IV: Result of Project Cost Data Analysis (Type Classification) Type of Project No of Projects
N
Average cost Escalation (%) M
Standard Deviation S
tcal
1. Public sector
2. Private sector 8 7
58.84 17.20
36.82 9.13
2.71
Since t cal of 2.71 is greater than t tab of 1.77, we reject that cost underestimation in public sector
projects is not significantly different from cost underestimation in private sector projects, and accept that public sector projects and private sector projects significantly differ with respect to cost underestimation. This means that public sector projects are more liable to cost underestimation than private sector projects.
TABLE V: Result of Project Cost Data Analysis (Size Classification) Size of Project No of Projects
N
Average cost Escalation (%) M
Standard Deviation S
tcal
1. Large (>N500m) 2. Small (<N500m)
6 9
42.43 37.39
34.78 34.24
0.26
Since t cal of 0.26 is less than t tab of 1.77, we accept that cost underestimation in large projects
Licensed under Creative Common Page 11 TABLE VI: Result of Project Cost Data Analysis (Time Period Classification)
Period of Execution No of Projects
N
Average cost Escalation (%) M
Standard Deviation S
tcal
1. 1984 – 1999 2. 2000 - 2014
7 8
39.73 39.13
32.24 36.44
0.03
Since tcal of 0.03 is less than ttab of 1.77; we accept that cost underestimation during the first
period (1984 – 1999) is not significantly different from cost underestimation during the second period (2000 – 2014).
This means that cost underestimation has not improved over the years. The level of cost underestimation in the 30 years period of this study is not significantly different. This result explains Flyvbjerg et al (2002) assertion that cost underestimation cannot be explained by technical factors such as errors/ mistake or inexperience of forecasters. If for example, forecasters’ errors/ mistakes are held as the main cause of cost underestimation; then it means,
forecasters have continually made the same mistakes in the 30 years period studied in this study, and that scenario is highly unlikely. Also, if underestimation were unintentional and related to lack of experience or faulty methods in estimating and forecasting costs; then, apriori, we would expect underestimation to decrease over time as better methods were developed and more experience gained through the planning and implementation of more infrastructure projects. But the result of this research reveal that cost underestimation has not decreased over the years but have remained the same.
CONCLUSIONS
The results of the tests conducted in this study so far has ruled out “unintentional” technical factors such as honest mistake, errors, inexperience of estimators, project complexity etc as being mainly responsible for cost underestimation. The ranking of factors using their relative importance revealed that the main factors responsible for cost underestimation are “intentional factors”; that is, deliberately understating project costs so as to be awarded the contract, and
Licensed under Creative Common Page 12 Given that there are strong incentives and weak disincentives for underestimating project costs; it is recommended that, to solve the problem of cost underestimation, strong disincentives for intentionally understating project costs should be introduced. This could be in the form of penalties, fines, or even legal prosecution.
REFERENCES
Akintoye, A. (2000). Analysis of factors influencing project cost estimating practice, Construction Management and Economics,18, 77 – 89.
Creedy, D. G. (2006). Risks factors leading to cost overrun in the delivery of highway construction projects, PhD thesis, Queensland University of Technology, Australia
Flyvbjerg, B. (2009). Survival of the unfittest: why the worst infrastructure gets built, and what we can do about it, Oxford Review of Economic Policy, 25(3), 344 – 367.
Flyvbjerg, B., Skamris-Holm, M. K., & Buhl, S. L. (2002). Underestimating Costs in Public Works Projects: Error or Lie? Journal of the American Planning Association, 68(3), 279–95.
Flyvbjerg, B., Skamris-Holm, M. K. & Buhl, S. L. (2005). How (In)accurate Are Demand Forecasts in Public Works Projects? The Case of Transportation, Journal of the American Planning Association, 71(2), 131–46.
Gilovich, T., Griffin, D. & Kahneman, D. (2002). Heuristics and Biases: The Psychology of Intuitive Judgment, Cambridge: Cambridge University Press.
Hartgen, D. T., Bowman, B. V., & Horner, W. M. (1997). Baseline market forecasts for state highway construction engineering, maintenance and administration programs 1997–2001, University of North Carolina, Charlotte, N.C: Centre for Interdisciplinary Transportation Studies, Transportation Publication, No. 151.
Hester, W. T., Kuprenas, J. A. & and Chang, T. C. (1991). Construction changes and Change Orders: Their Magnitude and Impacts. Berkeley, USA: University of California.
Hirschman, H. O. (1991). The principle of the hiding hand, The Public Interest, 1991(6), pp 10 – 23. Kahneman, D. & Tversky, A. (1979). Intuitive Prediction: Biases and Corrective Procedures. Makridakis, S. & Wheelwright, S. C. (Eds.), Studies in the Management Sciences: Forecasting, Vol. 12.
Lovallo, D. & Kahneman, D. (2003). Delusions of Success: How Optimism Undermines Executives’ Decisions, Harvard Business Review, pp 56–63, July 2003
Mackie, P. & Preston, J. (1998). Twenty-one sources of error and bias in transport project appraisal, Transport Policy,5(1), 1-7.
Merewitz, L. (1973). Cost overruns in public works. W. Niskanen, A. C. Hansen, R. H. Havemann, R. Turvey, & R. Zeckhauser (Eds.), Benefit cost and policy analysis, pp. 277-295, Chicago: Aldine.
Morris, P. W. G. & Hough, G. H. (1987). The Anatomy of Major Projects: A Study of the Reality of Project Management, New York: John Wiley and Sons.
Pickrell, D. H. (1990). Urban rail transit projects: Forecast versus actual ridership and cost. Washington, DC: U.S. Department of Transportation.
Sawyer, J. E. (1952). Entrepreneurial Error and Economic Growth, Explorations in Entrepreneurial History, 4(5), 199 - 200
Wachs, M. (1990). Ethics and Advocacy in Forecasting for Public Policy, Business and Professional Ethics Journal, 9(1-2), 141–57