Vitamin D During Pregnancy and Infancy and Infant
Serum 25-Hydroxyvitamin D Concentration
WHAT’S KNOWN ON THIS SUBJECT: A serum 25-hydroxyvitamin D (25(OH)D) concentration of 20 ng/mL meets the requirements of at least 97.5% of the population older than 1 year. A
recommended dietary intake to achieve this serum 25(OH)D concentration has not been established during infancy.
WHAT THIS STUDY ADDS: Daily maternal (during pregnancy) and then infant vitamin supplementation with 1000/400 IU or 2000/800 IU increases the proportion of infants with 25(OH)D$20 ng/mL during infancy with the higher dose sustaining this increase for longer.
abstract
OBJECTIVE: To determine the vitamin D dose necessary to achieve
serum 25-hydroxyvitamin D (25(OH)D) concentration $20 ng/mL
during infancy.
METHODS:A randomized, double-blind, placebo-controlled trial in New
Zealand. Pregnant mothers, from 27 weeks’ gestation to birth, and
then their infants, from birth to age 6 months, were randomly assigned to 1 of 3 mother/infant groups: placebo/placebo, vitamin
D3 1000/400 IU, or vitamin D3 2000/800 IU. Serum 25(OH)D and
calcium concentrations were measured at enrollment, 36 weeks’
gestation, in cord blood, and in infants at 2, 4, and 6 months of age.
RESULTS:Two-hundred-and-sixty pregnant women were randomized.
At enrollment, the proportions with serum 25(OH)D $20 ng/mL for
placebo, lower-dose, and higher-dose groups were 54%, 64%, and
55%, respectively. The proportion with 25(OH)D $20 ng/mL was
larger in both intervention groups at 36 weeks’ gestation (50%,
91%, 89%,P, .001). In comparison with placebo, the proportion of
infants with 25(OH)D $20 ng/mL was larger in both intervention
groups to age 4 months: cord blood (22%, 72%, 71%, P, .001), 2
months (50%, 82%, 92%,P , .001), and 4 months (66%, 87%, 87%,
P= .004), but only in the higher-dose group at age 6 months (74%,
82%, 89%,P = .07; higher dose versus placebo P= .03, lower dose
versus placeboP= .21).
CONCLUSIONS:Daily vitamin D supplementation during pregnancy and then infancy with 1000/400 IU or 2000/800 IU increases the proportion
of infants with 25(OH)D$20 ng/mL, with the higher dose sustaining
this increase for longer.Pediatrics2014;133:e143–e153
AUTHORS:Cameron C. Grant, MBChB, PhD,aAlistair W.
Stewart, BSc,bRobert Scragg, MBBS, PhD,bTania Milne,a
Judy Rowden,aAlec Ekeroma, MBBS,cClare Wall, PhD,d
Edwin A. Mitchell, MBBS, DSc,aSue Crengle, MBChB, PhD,e
Adrian Trenholme, MB, BChir,fJulian Crane, MBBS,gand
Carlos A. Camargo Jr, MD, DrPHh
aPaediatrics: Child and Youth Health,bEpidemiology and Biostatistics,cObstetrics and Gynaecology,dNutrition, and eTe Kupenga Hauora Maori, University of Auckland, Auckland, New Zealand;fWomen and Children’s Health, Middlemore Hospital, Auckland, New Zealand;gMedicine, University of Otago, Wellington, New Zealand; andhEmergency Medicine, Massachusetts General Hospital, Harvard Medical School, Boston, Massachusetts
KEY WORDS
vitamin D, 25-hydroxyvitamin D, pregnancy, infancy, supplementation
ABBREVIATIONS
25(OH)D—25-hydroxyvitamin D NZ—New Zealand
RDI—recommended dietary intake
Dr Grant conceived and designed the study, developed the data collection instruments, analyzed and interpreted the data, and completed thefirst andfinal drafts of the manuscript; Mr Stewart conceived and designed the study, analyzed and interpreted the data, reviewed and revised the manuscript, and approved thefinal manuscript as submitted; Dr Robert Scragg conceived and designed the study, developed the data collection instruments, critically reviewed the manuscript, and approved thefinal manuscript as submitted; Ms Milne and Ms Rowden developed the recruitment and retention strategy for the study, designed the data collection instruments, coordinated the collection of the data, and approved thefinal manuscript as submitted; Dr Ekeroma conceived and designed the study, developed the data collection instruments, and approved the
final manuscript as submitted; Drs Wall and Crengle developed the data collection instruments, critically reviewed the manuscript, and approved thefinal manuscript as submitted; Dr Mitchell conceived and designed the study, developed the data collection instruments, reviewed and revised the manuscript, and approved thefinal manuscript as submitted; Dr Trenholme supervised the collection of safety data, critically reviewed the manuscript, and approved thefinal manuscript as submitted; Dr Crane developed the data collection instruments, reviewed and revised the manuscript, and approved thefinal manuscript as submitted; and Dr Camargo conceived and designed the study, developed the data collection instruments, analyzed and interpreted the data, reviewed and revised the manuscript, and approved thefinal manuscript as submitted.
The Institute of Medicine, in 2011, de-termined that serum 25-hydroxyvitamin
D (25(OH)D) concentrations$20 ng/mL
meet the requirements of at least 97.5%
of the population .1 year old.1 The
recommended dietary intake (RDI)
during pregnancy was defined as 600
IU per day, but data were insufficient to
allow an RDI to be defined for infants.
Instead, an adequate intake of 400 IU per day was established, with this
consid-ered sufficient to maintain serum 25
(OH)D in the range of 16 to 20 ng/mL.1
Vitamin D status at birth and during early infancy, when breast milk is the pre-dominant source of nutrition, is
de-termined by maternal vitamin D status.2,3
Contemporary population- and primary
care–based studies of pregnant women
have shown a high prevalence of serum
25(OH)D,20 ng/mL in Asia (70%–96%),4–6
Australia (10%–47%),7–10 Europe (15%–
44%),11,12 the United Kingdom (49%–
75%),13–15 India (74%),16 and the United
States (37%).17Although less completely
studied at the population level, in primary
care–based studies from the United
States, serum 25(OH)D ,20 ng/mL is
present in 11% to 12% of infants.18,19
It is difficult to meet the vitamin D RDI
from dietary sources alone. For this reason, in some countries, including the United States, vitamin D is added to an
increasing range of food products.1,20
Determining the vitamin D intake that achieves a desired serum 25(OH)D
concentration in this setting is difficult.
In many countries though, vitamin D
fortification of foods is not mandated,
dietary sources of vitamin D are few, and routine vitamin D supplementation
is not recommended.21Such countries,
for example New Zealand (NZ), provide an opportunity to determine the re-lationship between vitamin D intake
and serum 25(OH)D concentration.22,23
In 2010, we commenced enrollment of pregnant women in NZ into a randomized trial of vitamin D supplementation dur-ing pregnancy and infancy. We aimed to
determine the vitamin D dose during late pregnancy and early infancy that safely and effectively increases serum 25(OH)D
concentrations to$20 ng/mL in thefirst
6 months of infancy.
METHODS
Trial Design
We performed a randomized, double-blind, placebo-controlled multiarm parallel study. Pregnant mothers, from
enrollment at 27 weeks’ gestation to
birth, and then their infants, from birth to age 6 months, were randomly and equally assigned, to 1 of 3 groups: pla-cebo, or lower-dose or higher-dose
vi-tamin D3. Woman/infant pairs received
a once-daily oral dose of placebo/
placebo, vitamin D3 1000 IU/400 IU, or
vitamin D32000 IU/800 IU.
Ethical approval was obtained from the regional NZ Ministry of Health ethics committee and written informed consent from all participating women. Registra-tion was with the Australian NZ Clinical Trials Registry (ACTRN12610000483055).
Participants
Women were recruited from a community-based primary care maternity clinic in Auckland (latitude 36°S) from April 2010 to July 2011. Women were eligible if their estimated gestation was 26 to 30 weeks and they had a singleton preg-nancy. We excluded women taking
vita-min D supplementation .200 IU per
day, those with a history of renal stones or hypercalcemia, or any serious preg-nancy complication at enrollment.
Interventions
Each participant was instructed to take 1 drop per day of study medicine. For pregnant women, 1 drop contained placebo or 1000 IU or 2000 IU of vitamin
D3; for infants, 1 drop contained
pla-cebo or 400 IU or 800 IU of vitamin D3.
Pregnant women took 1 drop per day of study medicine from enrollment until
childbirth. They were instructed to then stop taking their study medicine and to start giving their infant 1 drop per day of the infant study medicine until the in-fant was 6 months old.
Infants admitted to the NICU did not start study medicine until they had discontinued prescribed vitamin D supplements. For those born pre-maturely, vitamin D supplement was prescribed during their NICU stay and for 3 months after hospital discharge. Infants in the NICU received 160 IU per day while receiving parenteral nutrition and 464 IU per day once orally fed.
Outcomes
The primary end points at study initiation were the proportion of infants achieving
a serum 25(OH)D concentration$30 ng/mL
during thefirst 6 months of infancy and
the number of mothers and infants with hypercalcemia at any measurement point. The 25(OH)D cutoff of 30 ng/mL was chosen because at the time of study initiation this was considered to
represent optimal vitamin D status.24,25
Urinary calcium was not used as a safety measure because physiologic hyper-calciuria occurs normally during
preg-nancy,26 and urinary calcium excretion
during infancy is widely variable.27
Sample Size
Sample size calculations were based on the primary study protocol objective of achieving a serum 25(OH)D concen-tration of 30 ng/mL. In healthy adults, serum 25(OH)D increases by approxi-mately 0.7 ng/mL for every 100 IU per
day of vitamin D3ingested.28
In NZ, the mean 25(OH)D concentration in women of childbearing age and in newborns is approximately 20 ng/mL
(interquartile range: women 14–27
ng/mL; newborns 12–31 ng/mL).23,29
33 ng/mL. We anticipated that the ac-tual increase could be smaller because
of the vitamin D demands of the fetus.25
We estimated that a difference in 25 (OH)D concentration of 3 ng/mL be-tween placebo and lower-dose vitamin D and 6 ng/mL between placebo and higher-dose vitamin D could be
detec-ted (80% power,a= 0.05) with 70 in
each group. We aimed to enroll 260 to have 210 infants complete the study.
Randomization and Blinding
Allocation to the 3 study arms was by restricted randomization within blocks of variable size using a computer-generated randomization list. The allo-cation sequence was concealed from research staff involved in recruitment. The study statistician randomly allo-cated a treatment to each participant and labeled identical study medicine bottles such that study staff and par-ticipants were unaware of the treatment status.
Study medicine bottles were sequen-tially numbered with an identical numbering code used for each mother-infant pair. Bottles of study medicine were prepared by the Ddrops Company (Woodbridge, Ontario, Canada) with the study medicine bottles for the 3 groups being identical in color, shape, and volume and the study medicine identi-cal in color, consistency, and taste.
Data Collection
Face-to-face interviews were completed
with women at enrollment; at 36 weeks’
gestation; and when their infant was 2, 4, and 6 months old. Data collected de-scribed demographics, adherence, sup-plement use, and infant feeding. Mothers were phoned at 2-weekly intervals to check adherence.
Venous (women and umbilical cord) and capillary (infant) blood samples were collected. Serum calcium concentration was measured and then samples were
stored at–80°C until study completion.
Serum 25(OH)D concentration was
measured using isotope-dilution liquid
chromatography–tandem mass
spec-trometry in a Vitamin D External Quality
Assurance Scheme–certified
labora-tory.30,31Total serum calcium was
mea-sured using a colorimetric assay on an Abbott Diagnostic Architect instrument (Abbott Park, IL). Hypercalcemia was
defined as an adjusted serum calcium
concentration .10.4 mg/dL (women),
.11.6 mg/dL (cord blood), and.11.2
mg/dL (infants).32,33
Statistical Methods
Analyses were performed on an
intention-to-treat basis. The x2 test,
t test, and analysis of variance were
used for between-group comparisons. The treatment effect at 36 weeks in the mothers was assessed using linear regression in a model that included enrollment 25(OH)D concentration. The treatment effect in the infants was assessed using a linear mixed model with stage (cord [birth], and 2, 4, and 6 months of age) as a repeated measure using an unstructured covariance ma-trix. Interaction between stage and
treatment was assessed first and on
finding an interaction, each stage was
analyzed separately using linear re-gression. The 3 treatment groups were compared using the 2 hypothesized, orthogonal contrasts: placebo versus vitamin D supplementation and 400 IU versus 800 IU supplementation. All comparisons used 2-sided tests at
a .05 level of significance. The null
hy-pothesis forall analyses was that there is no difference between the study groups.
RESULTS
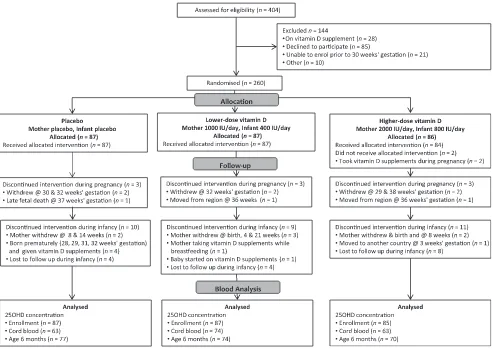
Of 404 pregnant women assessed, 260
were randomized to placebo (n= 87),
lower-dose vitamin D3 (n = 87), or
higher-dose vitamin D3(n= 86) (Fig 1).
Serum 25(OH)D concentration was measured on 259 women at
enroll-ment; 228 (88%) women at 36 weeks’
gestation; 200 (77%) cord blood sam-ples; and 198 (76%), 189 (73%), and 221 (85%) infants at 2, 4, and 6 months of age, respectively.
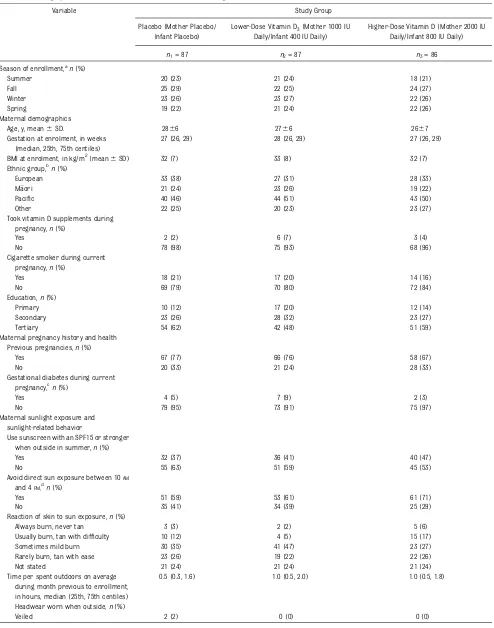
Table 1 shows the characteristics of en-rolled women. The proportions enen-rolled during summer, fall, winter, and spring were 0.23, 0.27, 0.26, and 0.24 respectively. At enrollment, 57% of the women were
obese (BMI$30 kg/m2).34 At 36 weeks’
gestation, 11 (5%) of the women were taking vitamin D supplements containing between 100 and 500 IU per dose. Table 2 shows the characteristics of
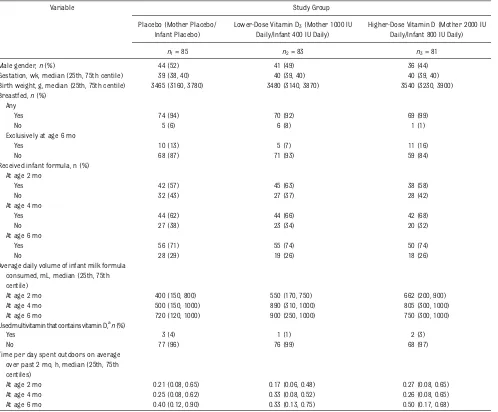
en-rolled infants. Ninety-five percent were
breastfed, with 26 (12%) exclusively breastfed at age 6 months. The proportion of infants receiving milk formula
in-creased from age 2 to 6 months (P= .002),
as did the median daily volume consumed
(600 mL to 750 mL,P= .001). Formula milk
volume consumed did not differ between
study groups at age 2 (P= .25), 4 (P= .30),
or 6 months (P= .34). Six infants, 5 of
whom were born prematurely, received supplementary vitamin D.
The hours per day each infant spent outdoors increased from age 2 to 6
months (median 0.23 vs 0.40 hours,P=
.001) but did not differ between study
groups at age 2 (P= .18), 4 (P= .39), or
6 months (P= .55).
Reported compliance did not differ between groups (Table 3). The pro-portion of infants given 1 drop of study medicine each day decreased during infancy (2 months 90%, 4 months 90%,
6 months 78%, 2 vs 6 months,P,.001).
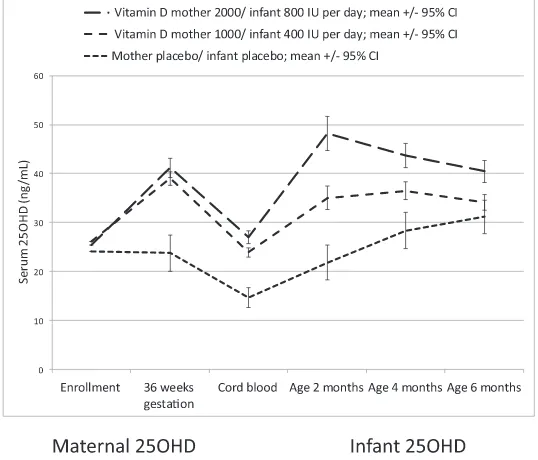
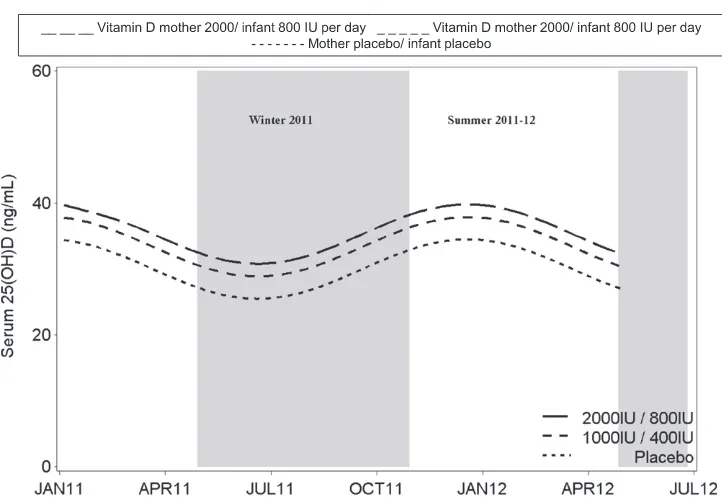
Maternal serum 25(OH)D concentra-tions increased from enrollment to 36
weeks’gestation to a similar extent in
the 1000 IU and 2000 IU groups while remaining unchanged in the placebo group (Fig 2). In a regression of cord blood 25(OH)D concentration on ma-ternal 36-week gestation 25(OH)D con-centration, adjusted for treatment
group, the modelR2was 0.79 (P,.001)
Median 25(OH)D concentrations at age 2 months in all 3 groups were higher than the cord blood 25(OH)D concentrations. The 25(OH)D concentrations in the 3 groups converged with increasing in-fant age with 25(OH)D concentrations increasing in the placebo group and decreasing in the higher-dose inter-vention group (Fig 2).
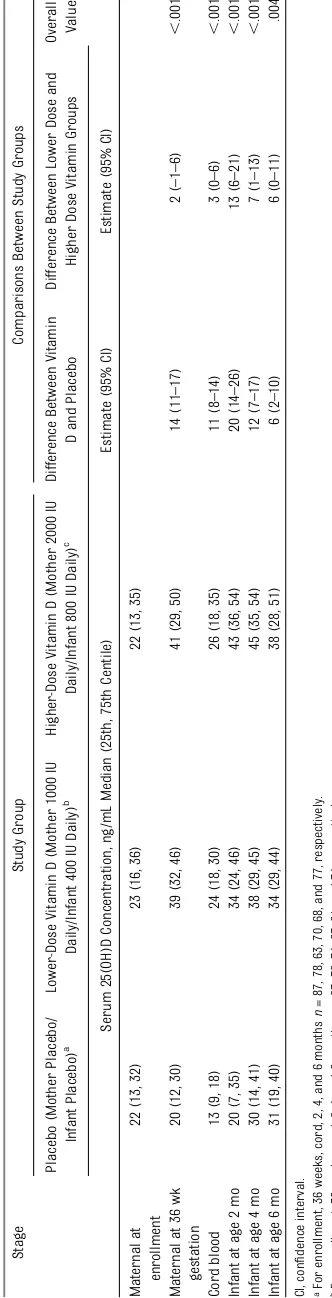
Maternal 25(OH)D concentrations at 36 weeks in the 3 treatment groups
dif-fered (P , .001, Table 4). Using the
linear mixed model, there was an in-teraction between age (cord, 2, 4, and 6
months) and treatment group (P ,
.001). At all ages, the order of the esti-mates was the same, with the higher-dose group having the highest levels and the placebo group the lowest
lev-els. Each stage showed a significant
difference across treatment groups
(P , .01). Table 4 shows estimated
differences between groups and their
95% confidence intervals for the 2
hy-pothesized contrasts.
The proportion of women with 25(OH)D
$30 ng/mL or $20 ng/mL differed
among the 3 groups at all postenroll-ment measurepostenroll-ment points (Table 5). In the placebo group, the proportion of
infants with 25(OH)D $30 ng/mL
in-creased from 33% at age 2 months to
57% at age 6 months (P = .006). The
proportion of infants with 25(OH)D
$30 ng/mL did not differ from age 2 to
6 months in the 400 IU (64%–74%,P=
.19) or the 800 IU group (79%–73%,P=
.44). In the placebo group, the
pro-portion of infants with 25(OH)D $20
ng/mL increased from 50% at age 2
months to 74% at age 6 months (P=
.003). The proportion of infants with 25
(OH)D$20 ng/mL did not differ from
age 2 to 6 months in the 400 IU (82%–
82%,P= .96) or the 800 IU group (92%–
89%,P= .54). Exclusion of women with
gestational diabetes (n= 13), who took
vitamin D supplements (n = 11) or
whose infants took vitamin D
supple-ments (n = 7) made no difference to
these comparisons with the exception
that the proportion with 25(OH)D$20
ng/mL did not differ between groups at age 6 months (Supplementary Table 6). Based upon the 25(OH)D concentrations at 6 months of age, seasonal variation in vitamin D status was evident with seasonal variation being comparable in all 3 groups (Fig 3). After adjustment for season, the 25(OH)D concentration in
FIGURE 1
TABLE 1 Demographics and Clinical Characteristics of Enrolled Pregnant Women
Variable Study Group
Placebo (Mother Placebo/ Infant Placebo)
Lower-Dose Vitamin D3(Mother 1000 IU Daily/Infant 400 IU Daily)
Higher-Dose Vitamin D (Mother 2000 IU Daily/Infant 800 IU Daily)
n1= 87 n2= 87 n3= 86
Season of enrollment,a
n(%)
Summer 20 (23) 21 (24) 18 (21)
Fall 25 (29) 22 (25) 24 (27)
Winter 23 (26) 23 (27) 22 (26)
Spring 19 (22) 21 (24) 22 (26)
Maternal demographics
Age, y, mean6SD. 2866 2766 2667
Gestation at enrolment, in weeks (median, 25th, 75th centiles)
27 (26, 29) 28 (26, 29) 27 (26, 29)
BMI at enrolment, in kg/m2(mean6SD) 32 (7) 33 (8) 32 (7)
Ethnic group,bn(%)
European 33 (38) 27 (31) 28 (33)
Maori 21 (24) 23 (26) 19 (22)
Pacific 40 (46) 44 (51) 43 (50)
Other 22 (25) 20 (23) 23 (27)
Took vitamin D supplements during pregnancy,n(%)
Yes 2 (2) 6 (7) 3 (4)
No 78 (98) 75 (93) 68 (96)
Cigarette smoker during current pregnancy,n(%)
Yes 18 (21) 17 (20) 14 (16)
No 69 (79) 70 (80) 72 (84)
Education,n(%)
Primary 10 (12) 17 (20) 12 (14)
Secondary 23 (26) 28 (32) 23 (27)
Tertiary 54 (62) 42 (48) 51 (59)
Maternal pregnancy history and health Previous pregnancies,n(%)
Yes 67 (77) 66 (76) 58 (67)
No 20 (33) 21 (24) 28 (33)
Gestational diabetes during current pregnancy,cn(%)
Yes 4 (5) 7 (9) 2 (3)
No 79 (95) 73 (91) 75 (97)
Maternal sunlight exposure and sunlight-related behavior
Use sunscreen with an SPF15 or stronger when outside in summer,n(%)
Yes 32 (37) 36 (41) 40 (47)
No 55 (63) 51 (59) 45 (53)
Avoid direct sun exposure between 10AM
and 4PM,dn(%)
Yes 51 (59) 53 (61) 61 (71)
No 35 (41) 34 (39) 25 (29)
Reaction of skin to sun exposure,n(%)
Always burn, never tan 3 (3) 2 (2) 5 (6)
Usually burn, tan with difficulty 10 (12) 4 (5) 15 (17)
Sometimes mild burn 30 (35) 41 (47) 23 (27)
Rarely burn, tan with ease 23 (26) 19 (22) 22 (26)
Not stated 21 (24) 21 (24) 21 (24)
Time per spent outdoors on average during month previous to enrollment, in hours, median (25th, 75th centiles)
0.5 (0.3, 1.6) 1.0 (0.5, 2.0) 1.0 (0.5, 1.8)
Headwear worn when outside,n(%)
the placebo group at age 6 months was lower than that in the intervention
groups (P = .025) but did not differ
between intervention groups (P= .40).
Serum calcium was not elevated in any participant, nor did mean serum cal-cium concentration differ between study groups at any measurement point
(Supplementary Table 7). At age 2 months, 1 infant in the 400-IU group (130 ng/mL) and 4 infants in the 800-IU group (104, 128, 130, 134 ng/mL)
TABLE 1 Continued
Variable Study Group
Placebo (Mother Placebo/ Infant Placebo)
Lower-Dose Vitamin D3(Mother 1000 IU Daily/Infant 400 IU Daily)
Higher-Dose Vitamin D (Mother 2000 IU Daily/Infant 800 IU Daily)
n1= 87 n2= 87 n3= 86
Hat 9 (11) 12 (14) 13 (15)
No head covering 55 (63) 53 (61) 51 (59)
Not stated 21 (24) 22 (25) 22 (26)
aSummer (December to February), Fall (March to May), Winter (June to August), Spring (September to November)
bEthnic groups are those used for the national census. Maori is New Zealand’s indigenous population. Ethnicity was defined by the participants. More than 1 ethnic group could be identified;
therefore, percentages do not add to 100.
cAt either enrollment or 36-week gestation interviewn
1= 83,n2= 80,n3= 77.
dIncludes using protective clothing and/or remaining under a shade cover (not stated by 1 mother).
TABLE 2 Demographics and Clinical Characteristics of Enrolled Infants
Variable Study Group
Placebo (Mother Placebo/ Infant Placebo)
Lower-Dose Vitamin D3(Mother 1000 IU Daily/Infant 400 IU Daily)
Higher-Dose Vitamin D (Mother 2000 IU Daily/Infant 800 IU Daily)
n1= 85 n2= 83 n3= 81
Male gender,n(%) 44 (52) 41 (49) 36 (44)
Gestation, wk, median (25th, 75th centile) 39 (38, 40) 40 (39, 40) 40 (39, 40)
Birth weight, g, median (25th, 75th centile) 3465 (3160, 3780) 3480 (3140, 3870) 3540 (3230, 3900) Breastfed,n(%)
Any
Yes 74 (94) 70 (92) 69 (99)
No 5 (6) 6 (8) 1 (1)
Exclusively at age 6 mo
Yes 10 (13) 5 (7) 11 (16)
No 68 (87) 71 (93) 59 (84)
Received infant formula, n (%) At age 2 mo
Yes 42 (57) 45 (63) 38 (58)
No 32 (43) 27 (37) 28 (42)
At age 4 mo
Yes 44 (62) 44 (66) 42 (68)
No 27 (38) 23 (34) 20 (32)
At age 6 mo
Yes 56 (71) 55 (74) 50 (74)
No 28 (29) 19 (26) 18 (26)
Average daily volume of infant milk formula consumed, mL, median (25th, 75th centile)
At age 2 mo 400 (150, 800) 550 (170, 750) 662 (200, 900)
At age 4 mo 500 (150, 1000) 890 (310, 1000) 805 (300, 1000)
At age 6 mo 720 (120, 1000) 900 (250, 1000) 750 (300, 1000)
Used multivitamin that contains vitamin D,an(%)
Yes 3 (4) 1 (1) 2 (3)
No 77 (96) 76 (99) 68 (97)
Time per day spent outdoors on average over past 2 mo, h, median (25th, 75th centiles)
At age 2 mo 0.21 (0.08, 0.65) 0.17 (0.06, 0.48) 0.27 (0.08, 0.65)
At age 4 mo 0.25 (0.08, 0.62) 0.33 (0.08, 0.52) 0.26 (0.08, 0.65)
At age 6 mo 0.40 (0.12, 0.90) 0.33 (0.13, 0.75) 0.50 (0.17, 0.68)
had a serum 25(OH)D concentration
$100 ng/mL.
DISCUSSION
Vitamin D supplementation of pregnant
women, from 27 weeks’gestation until
childbirth, and then their infants, from birth until age 6 months, results in 71%
to 79% of women, at 36 weeks’
gesta-tion, and 73% to 74% of infants at age 6 months achieving serum 25(OH)D
con-centrations$30 ng/mL when a woman/
infant dosing regimen of either vitamin
D31000 IU/400 IU, or vitamin D3 2000
IU/800 IU is used. Ninety percent of
women, at 36 weeks’gestation, and 82%
to 92% of infants, to age 6 months, achieve serum 25(OH)D concentrations
$20 ng/mL when either of these dosing
regimens are used. In comparison with placebo, the proportion of infants achieving a serum 25(OH)D
concen-tration$20 ng/mL was greater for the
higher-dose group to age 6 months and for the lower-dose group to age 4 months.
Neither vitamin D dosing regimen caused hypercalcemia. In particular, hypercalcemia did not occur in the 5 infants who at age 2 months had serum
25(OH)D concentrations $100 ng/mL.
These findings are consistent with
data from other contemporary preg-nancy and infancy studies of vitamin D
supplementation. Separate studies
have shown that vitamin D 4000 IU per day during pregnancy and 1200 IU per day during infancy does not cause
hy-percalcemia.35,36Vitamin D 1600 IU per
day from age 2 weeks to 3 months does
not cause hypercalcemia despite
resulting in serum 25(OH)D
concen-trations up to 92 ng/mL.37
Serum 25OHD concentrations at
enroll-ment (4–80 ng/mL) spanned the
expec-ted range seen in populations without
supplementation.38 Recruitment was
evenly distributed across seasons and the recruited sample included a di-versity of skin pigmentation types. Only 5% of the women and 3% of the infants took vitamin D supplements during the study; these few were distributed evenly across the study arms.
Our intervention ceased at age 6 months. Therefore, we cannot comment on the vitamin D dose required during later infancy. With increasing intake of infant formula, dietary intake of vitamin D is likely to increase and, hence, re-quirement for vitamin D supplementa-tion may be less critical than earlier in infancy.
TABLE 3 Reported Compliance With Study Medicinea
Variable Study Group P
Value Placebo (Mother
Placebo/Infant Placebo)
Lower-Dose Vitamin D3 (Mother 1000 IU Daily/ Infant 400 IU Daily)
Higher-Dose Vitamin D (Mother 2000 IU Daily/ Infant 800 IU Daily)
n1= 87 n2= 87 n3= 86
n(%) n(%) n(%)
Took 1 drop daily at 36 wk gestation
.66
Yes 77 (96) 77 (95) 66 (93)
No 3 (4) 4 (5) 5 (7)
Gave 1 drop daily to infant
Age 2 mo
Yes 67 (92) 64 (89) 58 (91) .84
No 6 (8) 8 (11) 6 (9)
Age 4 mo
Yes 67 (94) 58 (87) 54 (87) .25
No 4 (6) 9 (13) 8 (13)
Age 6 mo
Yes 65 (83) 57 (75) 52 (74) .33
No 13 (17) 19 (25) 18 (26)
aReported by 220 (95%) of 232 of the women at 36 weeks’gestation and by them for 189 (90%) of 209, 179 (90%) of 200, and
174 (78%) of 224 of the infants at 2, 4, and 6 months of age, respectively.
FIGURE 2
Serum 25(OH)D concentration increased during infancy in our placebo group. This was also observed in a study of exclusively breastfed infants born
dur-ing winter in Ioannina, Greece (39°N).39
In our sample, the increased serum 25 (OH)D concentration during infancy was probably multifactorial, but we suspect was largely due to increased intake of vitamin D from milk formula. In NZ,
in-fant formula is fortified with 360 IU/L of
vitamin D.40Therefore by age 6 months,
infants randomized to the placebo group were, on average, receiving 260 IU per day of vitamin D.
Serum 25(OH)D concentrations de-creased during infancy in the 800-IU per day group. Although decreasing com-pliance may have contributed to this, it is likely also due to the vitamin D dose per
kilogram of body weight decreasing.41A
similar pattern has been observed in other infant supplementation trials and suggests that a vitamin D dose per ki-logram may be necessary in this age
group.36,42,43
Our study is thefirst randomized
con-trolled trial of vitamin D supplementa-tion during infancy that commenced supplementation before birth. By doing
so,∼90% of the pregnant women
ran-domized to vitamin D achieved a serum
25(OH)D concentration $20 ng/mL.
Consistent with other reports, there was a linear positive association be-tween the cord 25(OH)D and maternal 36-week gestation 25(OH)D
concentra-tion.10,35,44In our study, the cord 25(OH)
D concentration was, on average, 13.8 ng/mL lower than the maternal con-centration. Although this also has been
observed previously,44 cord blood 25
(OH)D concentrations in other
pop-ulations have been similar to45 or
higher than maternal late-pregnancy
serum 25(OH)D concentrations.10 For
neonates to be born with adequate vi-tamin D status requires their mothers
to be vitamin D sufficient during
TABLE 5 Maternal and Infant 25(OH)D Concentrations by Study Group Assignment and Proportion With 25(OH)D$20 ng/mL and$30 ng/mL
Study Group Comparisons Between Study Groups
Placebo (Mother Placebo/Infant
Placebo)a
Lower-Dose Vitamin D (Mother 1000 IU Daily/ Infant 400 IU Daily)b
Higher-Dose Vitamin D (Mother 2000 IU Daily/ Infant 800 IU Daily)c
PValue (All 3 Groups)
PValue (Lower-Dose Vitamin D Versus Placebo)
PValue (Higher-Dose Vitamin D Versus Placebo)
PValue (Higher-Dose Vitamin D
Lower-Dose Vitamin D)
Serum 25(OH)D concentration $20 ng/mL,n(%) Maternal at
enrollment
47 (54) 56 (64) 47 (55)
Maternal at 36 wk gestation
39 (50) 71 (91) 64 (89) ,.001 ,.001 ,.001 .66
Cord blood 14 (22) 53 (72) 45 (71) ,.001 ,.001 ,.001 .98
Infant at age 2 mo 35 (50) 55 (82) 56 (92) ,.001 ,.001 ,.001 .11
Infant at age 4 mo 45 (66) 53 (87) 52 (87) .004 .006 .007 .97
Infant at age 6 mo 57 (74) 61 (82) 62 (89) .07 .21 .03 .30
Serum 25(OH)D concentration $30 ng/mL,n(%) Maternal at
enrollment
26 (30) 32 (37) 31 (36)
Maternal at 36 wk gestation
21 (27) 62 (79) 51 (71) ,.001 ,.001 ,.001 .22
Cord blood 3 (5) 18 (24) 25 (40) ,.001 .002 ,.001 .05
Infant at age 2 mo 24 (33) 43 (64) 48 (79) ,.001 ,.001 ,.001 .07
Infant at age 4 mo 34 (50) 43 (70) 48 (80) .001 .02 ,.001 .23
Infant at age 6 mo 44 (57) 55 (74) 51 (73) .04 .03 .05 .84
aFor enrollment, 36 weeks, cord, 2, 4, and 6 monthsn= 87, 78, 63, 70, 68, and 77, respectively. bFor enrollment, 36 weeks, cord, 2, 4, and 6 monthsn= 87, 78, 74, 67, 61, and 74, respectively. cFor enrollment, 36 weeks, cord, 2, 4, and 6 monthsn= 85, 72, 63, 61, 60, and 70, respectively.
FIGURE 3
Among infants randomized to 400 IU per day, the median serum 25(OH)D con-centration at age 2 (33.5 ng/mL) and 6 months (34.4 ng/mL) approximated that achieved in the 3 other clinical trials reporting comparable data for infants receiving 400 IU per day from the
first weeks of life. These trials
en-rolled infants in Cincinnati, Ohio (39°N) (25[OH]D 2 months 37 ng/mL, 6 months
33 ng/mL),47Madison, Wisconsin (43°N)
(2 months 30 ng/mL, 6 months 24 ng/mL),43
and Montreal, Quebec (46°N) (3 months,
31 ng/mL).36
At age 2 months, serum 25(OH)D
con-centrations$20 ng/mL were achieved
in 82% of infants in the 400-IU per day group and 92% in the 800-IU per day group. In comparison, 97% of breastfed infants living in Montreal and ran-domized at age 1 month to vitamin D 400, 800, 1200, or 1600 IU per day had
a serum 25(OH)D concentration at age
3 months$20 ng/mL, as did almost all
infants in Finland randomized at age 2 weeks to 400, 1200, or 1600 IU per day.36,37 The lower percentages in our study are possibly due to differences in the enrolled populations. In the
Cana-dian study.85% of mothers had
com-pleted tertiary education. The mothers of the Finnish infants were considered more health-orientated than the general
population.36,37 In comparison, our
sample of mothers was less well edu-cated (57% tertiary education) and comparable demographically to the
re-gion from which they were recruited.48
CONCLUSIONS
If the objective of vitamin D supplemen-tation is to achieve a serum 25(OH)D
concentration $20 ng/mL in 97.5% of
infants, then it seems likely that this
requires both maternal vitamin D sup-plementation during pregnancy and high compliance with daily dosing regi-mens. For serum 25(OH)D concentration to be maintained throughout infancy, it is likely to also require dose adjustment to meet the demands created by rapid growth during infancy. Given the global variation in serum 25(OH)D concentra-tion during pregnancy, recommended infant vitamin D supplementation in dif-ferent countries will need to take into account maternal pregnancy vitamin D status in each country.
ACKNOWLEDGMENTS
The authors acknowledge the contribu-tions made to the Pregnancy and Infancy Vitamin D trial by Debbie Raroa and Carol Taylor, by the staff at Lead Maternity Carer Services, and by Dr Jocelyn Neutze
at Kidz First Children’s Hospital.
REFERENCES
1. Institute of Medicine. Dietary Reference Intakes for Calcium and Vitamin D. Washington, DC: The National Academies Press; 2011
2. Dawodu A, Wagner CL. Mother-child vitamin D deficiency: an international perspective.
Arch Dis Child. 2007;92(9):737–740
3. Seth A, Marwaha RK, Singla B, et al. Vitamin D nutritional status of exclusively breast fed infants and their mothers. J Pediatr Endocrinol Metab. 2009;22(3):241–246
4. Jiang L, Xu J, Pan S, Xie E, Hu Z, Shen H. High prevalence of hypovitaminosis D among pregnant women in southeast China.Acta Paediatr. 2012;101(4):e192–e194
5. Tao M, Shao H, Gu J, Zhen Z. Vitamin D status of pregnant women in Shanghai, China.J Matern Fetal Neonatal Med. 2012;25(3):237–239
6. Shibata M, Suzuki A, Sekiya T, et al. High prevalence of hypovitaminosis D in preg-nant Japanese women with threatened premature delivery.J Bone Miner Metab. 2011;29(5):615–620
7. McLeod DS, Scott KA, Lust KM, McIntyre HD. Routine screening for vitamin D deficiency in early pregnancy. Med J Aust. 2011;195 (7):384–385
8. Perampalam S, Ganda K, Chow KA, et al. Vi-tamin D status and its predictive factors in pregnancy in 2 Australian populations.Aust N Z J Obstet Gynaecol. 2011;51(4):353–359
9. Teale GR, Cunningham CE. Vitamin D defi -ciency is common among pregnant women in rural Victoria.Aust N Z J Obstet Gynae-col. 2010;50(3):259–261
10. Bowyer L, Catling-Paull C, Diamond T, Homer C, Davis G, Craig ME. Vitamin D, PTH and calcium levels in pregnant women and their neonates.Clin Endocrinol (Oxf). 2009;70(3): 372–377
11. Sääf M, Fernell E, Kristiansson F, Barnevik Olsson M, Gustafsson SA, Bågenholm G. Severe vitamin D deficiency in pregnant women of Somali origin living in Sweden.
Acta Paediatr. 2011;100(4):612–614
12. Leffelaar ER, Vrijkotte TG, van Eijsden M. Maternal early pregnancy vitamin D status in relation to fetal and neonatal growth: results of the multi-ethnic Amsterdam Born Children and their Development cohort.Br J Nutr. 2010;104(1):108–117
13. O’Riordan MN, Kiely M, Higgins JR, Cashman KD. Prevalence of suboptimal vitamin D status during pregnancy.Ir Med J. 2008;101 (8):240, 242–243
14. Holmes VA, Barnes MS, Alexander HD, McFaul P, Wallace JM. Vitamin D deficiency and in-sufficiency in pregnant women: a longitudi-nal study.Br J Nutr. 2009;102(6):876–881
15. Gale CR, Robinson SM, Harvey NC, et al; Prin-cess Anne Hospital Study Group. Maternal
vitamin D status during pregnancy and child outcomes.Eur J Clin Nutr. 2008;62(1):68–77
16. Das V, Agarwal A, Bhatia V, et al. Evaluation of vitamin D status and need for supple-mentation in pregnant women of a rural area of North India.Int J Gynaecol Obstet. 2009;107(suppl 2):S151
17. Looker AC, Johnson CL, Lacher DA, Pfeiffer CM, Schleicher RL, Sempos CT. Vitamin D status: United States, 2001-2006.NCHS Data Brief. 2011(59):1–8
18. Gordon CM, Feldman HA, Sinclair L, et al. Prevalence of vitamin D deficiency among healthy infants and toddlers.Arch Pediatr Adolesc Med. 2008;162(6):505–512
19. Liang L, Chantry C, Styne DM, Stephensen CB. Prevalence and risk factors for vitamin D deficiency among healthy infants and young children in Sacramento, California. Eur J Pediatr. 2010;169(11):1337–1344
20. Yetley EA. Assessing the vitamin D status of the US population.Am J Clin Nutr. 2008;88 (2):558S–564S
21. Calvo MS, Whiting SJ, Barton CN. Vitamin D intake: a global perspective of current status.J Nutr. 2005;135(2):310–316
23. Camargo CA Jr, Ingham T, Wickens K, et al; New Zealand Asthma and Allergy Cohort Study Group. Vitamin D status of newborns in New Zealand.Br J Nutr. 2010;104(7):1051–1057
24. Bischoff-Ferrari HA, Giovannucci E, Willett WC, Dietrich T, Dawson-Hughes B. Estimation of optimal serum concentrations of 25-hydroxyvitamin D for multiple health out-comes [published correcton appears inAm J Clin Nutr. 2006;84(5):1253].Am J Clin Nutr. 2006;84(1):18–28
25. First Nations Inuit and Métis Health Commit-tee Canadian Paediatric Society (CPS). Vita-min D supplementation: recommendations for Canadian mothers and infants. Paediatr Child Health (Oxford). 2007;12(7):583–598
26. Gertner JM, Coustan DR, Kliger AS, Mallette LE, Ravin N, Broadus AE. Pregnancy as state of physiologic absorptive hypercalciuria.
Am J Med. 1986;81(3):451–456
27. Matos V, van Melle G, Boulat O, Markert M, Bachmann C, Guignard JP. Urinary phosphate/ creatinine, calcium/creatinine, and magnesium/ creatinine ratios in a healthy pediatric population.J Pediatr. 1997;131(2):252–257
28. Heaney RP, Davies KM, Chen TC, Holick MF, Barger-Lux MJ. Human serum 25-hydroxycholecalciferol response to extended oral dosing with cholecalciferol.Am J Clin Nutr. 2003;77(1):204–210
29. Rockell JE, Skeaff CM, Williams SM, Green TJ. Serum 25-hydroxyvitamin D concentrations of New Zealanders aged 15 years and older.
Osteoporos Int. 2006;17(9):1382–1389
30. Maunsell Z, Wright DJ, Rainbow SJ. Routine isotope-dilution liquid chromatography-tandem mass spectrometry assay for simul-taneous measurement of the 25-hydroxy metabolites of vitamins D2 and D3.Clin Chem. 2005;51(9):1683–1690
31. Lewis JG, Elder PA. Serum 25-OH vitamin D2 and D3 are stable under exaggerated con-ditions.Clin Chem. 2008;54(11):1931–1932
32. Kovacs CS, Kronenberg HM. Maternal-fetal calcium and bone metabolism during pregnancy, puerperium, and lactation.
Endocr Rev. 1997;18(6):832–872
33. Loughead JL, Mimouni F, Tsang RC. Serum ionized calcium concentrations in normal neonates.Am J Dis Child. 1988;142(5):516– 518
34. World Health Organization.Global Database on Body Mass Index. Geneva: World Health Organization; 2007
35. Dawodu A, Saadi HF, Bekdache G, Javed Y, Altaye M, Hollis BW. Randomized controlled trial (RCT) of vitamin D supplementation in pregnancy in a population with endemic vitamin D deficiency. J Clin Endocrinol Metab. 2013;98(6):2337–2346
36. Gallo S, Comeau K, Vanstone C, et al. Effect of different dosages of oral vitamin D supple-mentation on vitamin D status in healthy, breastfed infants: a randomized trial.JAMA. 2013;309(17):1785–1792
37. Holmlund-Suila E, Viljakainen H, Hytinantti T, Lamberg-Allardt C, Andersson S, Mäkitie O. High-dose vitamin D intervention in infants
—effects on vitamin D status, calcium ho-meostasis, and bone strength.J Clin Endo-crinol Metab. 2012;97(11):4139–4147
38. Jones G. Pharmacokinetics of vitamin D tox-icity.Am J Clin Nutr. 2008;88(2):582S–586S
39. Challa A, NtourntoufiA, Cholevas V, Bitsori M, Galanakis E, Andronikou S. Breastfeed-ing and vitamin D status in Greece durBreastfeed-ing the first 6 months of life. Eur J Pediatr. 2005;164(12):724–729
40. Ministry of Health.Companion Statement on Vitamin D and Sun Exposure in Pregnancy
and Infancy in New Zealand. Wellington, NZ: Ministry of Health; 2013
41. Pludowski P, Socha P, Karczmarewicz E, et al. Vitamin D supplementation and status in infants: a prospective cohort observa-tional study.J Pediatr Gastroenterol Nutr. 2011;53(1):93–99
42. Greer FR, Ho M, Dodson D, Tsang RC. Lack of 25-hydroxyvitamin D and 1,25-dihydroxyvitamin D in human milk.J Pediatr. 1981;99(2):233–235
43. Greer FR, Marshall S. Bone mineral content, serum vitamin D metabolite concentrations, and ultraviolet B light exposure in infants fed human milk with and without vitamin D2 supplements.J Pediatr. 1989;114(2):204–212
44. Wieland P, Fischer JA, Trechsel U, et al. Perinatal parathyroid hormone, vitamin D metabolites, and calcitonin in man. Am J Physiol. 1980;239(5):E385–E390
45. Novakovic B, Galati JC, Chen A, Morley R, Craig JM, Saffery R. Maternal vitamin D predominates over genetic factors in de-termining neonatal circulating vitamin D concentrations.Am J Clin Nutr. 2012;96(1): 188–195
46. Kovacs CS. Vitamin D in pregnancy and lactation: maternal, fetal, and neonatal outcomes from human and animal studies.
Am J Clin Nutr. 2008;88(2):520S–528S
47. Greer FR, Searcy JE, Levin RS, Steichen JJ, Asch PS, Tsang RC. Bone mineral content and serum 25-hydroxyvitamin D concen-tration in breast-fed infants with and without supplemental vitamin D.J Pediatr. 1981;98(5):696–701
48. Craig E, Anderson P, Jackson C.The Health Status of Children and Young People in Counties Manukau. Dunedin, NZ: New Zealand Child and Youth Epidemiology Service; 2008
(Continued fromfirst page)
Dr Grant and Mr Stewart had full access to all the data in the study and take responsibility for the integrity of the data and the accuracy of the data analysis.
This trial has been registered with the Australian New Zealand Clinical Trials Registry, identifier ACTRN12610000483055. www.pediatrics.org/cgi/doi/10.1542/peds.2013-2602
doi:10.1542/peds.2013-2602
Accepted for publication Oct 29, 2013
Address correspondence to Cameron Grant, MBChB, PhD, Department of Paediatrics: Child and Youth Health, Faculty of Medical and Health Sciences, University of Auckland, Private Bag 92019, Wellesley St, Auckland 1142, New Zealand. E-mail: cc.grant@auckland.ac.nz
PEDIATRICS (ISSN Numbers: Print, 0031-4005; Online, 1098-4275).
Copyright © 2014 by the American Academy of Pediatrics
FINANCIAL DISCLOSURE:The authors have indicated they have nofinancial relationships relevant to this article to disclose.
FUNDING:The pregnancy and infancy vitamin study was funded by the Health Research Council of New Zealand, grant number 09/215R. Dr Mitchell is supported by Cure Kids. The funder played no role in the design and conduct of the study; collection, management, analysis, and interpretation of the data; and preparation, review, or approval of the manuscript. Study medicine was prepared by the Ddrops Company (Woodbridge, Ontario, Canada).
DOI: 10.1542/peds.2013-2602 originally published online December 16, 2013;
2014;133;e143
Pediatrics
Julian Crane and Carlos A. Camargo Jr
Alec Ekeroma, Clare Wall, Edwin A. Mitchell, Sue Crengle, Adrian Trenholme,
Cameron C. Grant, Alistair W. Stewart, Robert Scragg, Tania Milne, Judy Rowden,
D Concentration
Vitamin D During Pregnancy and Infancy and Infant Serum 25-Hydroxyvitamin
Services
Updated Information &
http://pediatrics.aappublications.org/content/133/1/e143 including high resolution figures, can be found at:
References
http://pediatrics.aappublications.org/content/133/1/e143#BIBL This article cites 42 articles, 10 of which you can access for free at:
Subspecialty Collections
http://www.aappublications.org/cgi/collection/nutrition_sub
Nutrition
http://www.aappublications.org/cgi/collection/blood_disorders_sub
Blood Disorders
_sub
http://www.aappublications.org/cgi/collection/hematology:oncology
Hematology/Oncology
following collection(s):
This article, along with others on similar topics, appears in the
Permissions & Licensing
http://www.aappublications.org/site/misc/Permissions.xhtml in its entirety can be found online at:
Information about reproducing this article in parts (figures, tables) or
Reprints
DOI: 10.1542/peds.2013-2602 originally published online December 16, 2013;
2014;133;e143
Pediatrics
Julian Crane and Carlos A. Camargo Jr
Alec Ekeroma, Clare Wall, Edwin A. Mitchell, Sue Crengle, Adrian Trenholme,
Cameron C. Grant, Alistair W. Stewart, Robert Scragg, Tania Milne, Judy Rowden,
http://pediatrics.aappublications.org/content/133/1/e143
located on the World Wide Web at:
The online version of this article, along with updated information and services, is
http://pediatrics.aappublications.org/content/suppl/2013/12/11/peds.2013-2602.DCSupplemental Data Supplement at:
by the American Academy of Pediatrics. All rights reserved. Print ISSN: 1073-0397.