Customer Satisfaction:
A Structural Equation Modeling Analysis
Pardis mohajerani
School of Management, Sharif University of Technology International Campus, Iran
ABSTRACT
The aim of this paper is to investigate the determinants and consequences of customer satisfaction in hotel industry in Iran. A Confirmatory Factor Analysis (CFA) and Structural Equation Modeling have been utilized with information provided by a survey conducted in Iran (Kish Island).Results indicate that perceived value has a significant impact on customer satisfaction in hotel industry. Moreover, there is an strong positive relationship between image and perceived quality, image and perceived value, and also perceived quality and Perceived value. Based on the Results, no direct relationship has been detected between perceived quality and customer satisfaction, and also between customer expectation and customer satisfaction in hotel industry. In addition, Results showed that increased customer satisfaction will lead to an increase in customer loyalty. However, there is no strong negative relationship between customer satisfaction and complaining behavior. Findings provide more evidence on important determinants and results of customer satisfaction. Moreover this study is among the first studies conducted in hotel industry in Iran-Kish Island.
Keywords:Customer Satisfaction, Hotel Industry, Structural Equation Modeling, Iran.
1. INTRODUCTION
Hotel industry is one of the essential substructures of tourism industry. a large number of studies have been devoted to study the effective factors regarding customer satisfaction. According to recent studies, certain factors have direct and significant impact on customer satisfaction. According to different situations, time, and individuals, more research on complicated factors of customer satisfaction is essential. Therefore, this study aims to identify the drivers and consequences of customer satisfaction and also their relationship and also to utilize them as substantial substructures of hotel industry which leads to improvement in tourism industry in Iran. This research may help hotel managers to find out about the customer needs and to improve customer satisfaction and customer loyalty in order to raise the repurchasing intention. Achieving this purpose, a Structural Equation Modeling (SEM) approach is applied. The survey data is gathered from 285 Iranian customers.
2. LITRITURE REVIEW
2.1 Customer Satisfaction Definition
There are various ways to define Customer Satisfaction. Anderson et al. (1994) viewed customer satisfaction as customers overall experience while buying or consuming products or services. Baker and Crompton (2000) suggested that Customer Satisfaction is a personal experience derived from differences between personal expectations and actual receives.
Anderson et al. (1997) pointed out that companies should consider customer satisfaction and productivity together in order to gain business growth, positive word-of-mouth and increase overall profitability and image. Boshoff and Gray (2004) Stated that products and Services do not contain customer satisfaction inherently but, instead, customer satisfaction is included in perception of every customer about the product and service attributes.
According to Anton (1996) customer satisfaction is customer’s state of mind when his/her expectations met or exceeds the perception and result in post- purchase decision of loyalty. Fornell (1992) added that favorable word-of-mouth and repurchasing are the results of customer satisfaction.
2. 2 Social Sciences Theories of Customer Satisfaction 2.2.1 The Need Fulfillment Model of Satisfaction
Customers will satisfy a need by purchasing products. There are two reasons which force customers to attempt to satisfy a need. The first reason is restoration which gives the customer a sense of relief. The second one is enhancement which leads to feel pleasure. Oliver (1997) divided need fulfillment attributes into three parts:
ISSN: 1839 - 0846
(2) Higher- need fulfillment attributes which are known as nonviolent satisfiers and they will satisfy the customer when present but will not cause dissatisfaction if absent.
(3) Bivalent satisfiers which affect satisfaction and dissatisfaction similarly depending on their presence or absence.
2.2.2 The Three Factor Theory
Matzler and Sauerwein (2002) distinguished three factors of satisfaction.
Basic factors (dissatisfiers) are minimum requirements that lead to dissatisfaction if not fulfilled, but by fulfilling them customer satisfaction will not be created. In thsese kind of factors low performance has greater effect on overall satisfaction than high performance. The relationship between factor- level performance and overall satisfaction is symmetrical.
Excitement factors (satisfiers) are factors by whose delivering the service provider could increase satisfaction but don’t lead to dissatisfaction if they are not delivered Excitement factors are not in expectation list of customers; instead they could surprise costumers and generate delight for them. The relationship between factor- level performance and overall satisfaction is symmetric.
Performance factors (hybrids) could bring about satisfaction if performance is high and dissatisfaction, if performance is low. There is a linear and symmetric relation ship between performance and overall satisfaction.
2.2.3 Expectancy- Disconfirmation Theory
Brooks (1995) defined this theory as comparison of expectations and performance and using a better- than, worse- than heuristic. Positive disconfirmation will occur if the product and service is better than expected and negative disconfirmation will happen if the product and service is worse than expected. The more the positive disconfirmation, the more the customer satisfaction (Liljander and Strandvik, 1997).
Two concepts are involved in disconfirmation theory: assimilation effects and contrast effects.
According to assimilation theory a consumer’s perception about the product’s performance will be drawn toward his/ her expectations and customer satisfaction will be determined by customer’s level of expectation. However, under contrast effect, there would be exaggeration in perceiving the results. It means that a favorable result will be perceived as more favorable one and an unfavorable result will be perceived as less favorable. Positive disconfirmation will cause customer satisfaction and future purchase decisions. But negative disconfirmation will lead to searching for another product to satisfy our need.
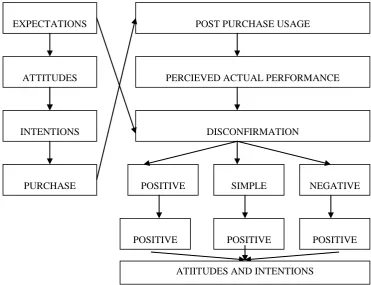
Figure 1. Expectancy-Disconfrmation Model ( Brooks , 1995).
EXPECTATIONS
ATTITUDES
INTENTIONS
PURCHASE
POST PURCHASE USAGE
PERCIEVED ACTUAL PERFORMANCE
DISCONFIRMATION
SIMPLE
POSITIVE NEGATIVE
POSITIVE POSITIVE POSITIVE
There are two different methods for applying expectancy- disconfirmation model. The first method is called inferred method which calculated by subtracting of performance scores and expectation scores. The second method is known as direct measurement of disconfirmation. In this method the judgmental scale will be used and the differences between performance and Expectation will be announced by the participants.
2.3 Hypotheses
Lea and Bang (2004), Gallarza and Gil-saura (2006) have found out that perceived value and customer satisfaction are related item and perceived value has influenced customer satisfaction positively. Sparks et al. (2007) also indicated that perceived value has a significant and positive impact on customer satisfaction. The SCSB (Swedish Customer Satisfaction Barometer), ACSI (American Customer Satisfaction Index), and ECSI (European Customer Satisfaction Index) have considered perceived value as a latent variable of customer satisfaction.
Mc Dougall and levesque (2000) found out that perceived value is one of the predictors of customer satisfaction.
H1: Perceived value will influence positively customer satisfaction in hotel industry.
Knowledge of customer expectation is essential while it provides understanding of how the customer defines quality of service and products, and also it leads to development of customer satisfaction indexes (Pizam and Ellisa, 1994). On the other hand, the ECSI (European Customer Satisfaction Index) and ACSI (American Customer Satisfaction Index) and SCSB (Swedish Customer Satisfaction Barometer) have mentioned customer expectation as a factor that has a direct effect on customer satisfaction.
H2: Customer expectation will influence positively customer satisfaction in hotel industry.
Eskildesen et al. (2004) and Oliver (1988) have indicated that service quality has a positive association with customer satisfaction, According to ACSI (American Customer Satisfaction Index) and ECSI (European Customer Satisfaction Index), service quality has a significant and direct impact on customer satisfaction.
H3: Perceived quality will influence positively customer satisfaction in hotel industry.
Fornell et al. (1996) and Jhonson et al. (2001) believed that perceived quality and perceived value are related variables.
This relationship also has been included in ACSI and ECSI models. Additionally, these customer satisfaction models have proved that there is a relation ship between image and perceived value. On the other hand, Zeithaml and Bitner (1996) have considered image as a factor which have the ability to influence perception of goods or services.
H4: There is a relationship between image and perceived value.
H5: There is a relationship between perceived value and perceived quality.
H6: There is a relationship between image and perceived quality.
Taylor and Baker (1994) and File and Prince (1992) have indicated that future purchase intention and positive word-of-mouth of customers are related to their degree of satisfaction. SCSB, ACSI, and ECSI have included customer loyalty as the consequence of customer satisfaction. MC Dougall and Levesqve (2000) have mentioned that customer satisfaction has a direct relationship with the repurchase intentions.
H7: Customer satisfaction will influence positively customer loyalty.
Increased customer satisfaction will leads to a decrease in complaining behavior (Fornell et al. 1996). SCSB and ACSI model have also mentioned this negative relationship.
ISSN: 1839 - 0846
Figure2. Proposed Model
3. METHODOLOGY AND MEASURES 3.1 Data Collection
The Data are collated from a survey conducted in Kish Island, Iran. Kish Island is chosen due to Nemours valid reasons. Many tourism resources and festivals are the main reasons which stimulate travel is this Island every years.
Kish Island located in south of Iran and This will lead travels to come to this Island in winter because of its low temperature in this season.(Mohajerani and Miremadi, 2010).
The final sample includes 285 Customers of three different hotels of three-star, four-star, and five-star with a confidence level of 95 percent and with the measured P-value of 75% for customers whose satisfaction rate proved to be above average.
n= 2
2
e
pq
z
0.75
0.25 28505
.
0
)
96
.
1
(
2 2
n
n
The questionnaire is designed to analyze customer satisfaction perceived value, perceived quality, image, customer expectation, customer loyalty, and Complaining behavior. The questionnaire also contains questions on Socio-demographic characteristics (i.e. sex, Age, Salary, and Marriage).
The sample was selected using proportional simple random sampling- international Kish airport was selected. For distributing the questionnaire in a large scale among the customers of domestic flights who were leaving the Island. The researcher chose three days and four hours a day randomly and asked every five travelers who entered the departure hall to participate in the study (Mohajerani and Miremadi, 2010). The questionnaire format was validated using a pilot survey. The final percentage of sample per age group was: 49 percent of respondents aged from 20-30 years old, 7 percent under 20 years old, 25 percent aged from 31 to 40 years old, 13 percent aged from 41 to 50 years old, and 6 percent of respondents with more than 50 years old. Most respondents were men (55.4 percent. 42 percent of respondents received a monthly income above 8.000.000 Rials and the majority of respondents were married (62.5percent).
3.2 Variable Definition (Measures)
The researcher decided to use the questions from existing surveys where validity was already determined. However, due to slight adaptation, the researcher further asked a panel of experts to review the questions and content.
Perceived
Quality Customer
Loyalty
Complaining Behavior Customer
Satisfaction Perceived
Value
Image
Customer Expectation
H3
H7
H8
H2
H1
H5
H4
The questions in the survey were designed to gather information on customer satisfaction from hotels. The questionnaire contains forty statements in total which is represented by seven following areas: perceived quality, perceived value, customer satisfaction, customer expectation, image, customer loyalty, complaining behavior. Each item has its own sub-items and the number of related questions which are measured by five-point-likert type scales anchored at 1 (strongly disagree) and 5 (strongly agree). Customer satisfaction was measure by three-item scale which was validated by Juhl et al. (2002).
The questions covered their satisfaction rate in general, their satisfaction rate in comparison with their expectations, and their satisfaction rate in comparison with their ideal imaginary hotel.
Perceived quality is measured by twelve-item scale which is classified in three groups of out come quality, physical quality, interaction quality and was validated by Pollack (2009). Perceived value is measured by five-item scale which is classified in three groups of reputation for quality, value for money, and prestige and it was validated by Nasution and Movondo (2008).
Image is measured by eight- item scale which took in to account both cognitive image and affective image and it is adopted from two studies conducted by Bosque and Martin (2008), Turkyilmaz and Ozkan (2007). Customer expectation was measured by three-item scale which comprises of three factors, Expectation for overall quality, Expectation for product quality and expectation for service quality and it was validate by Turkylimaz and Ozkan (2007).
Customer loyalty was measured by six-item scale which took into account positive word of mouth, willingness to pay more, and switching behavior and this scale was adopted from several studies conducted by juhl et al. (2002), Hsu (2008), Turkylmaz and Ozkan (2007), Johnson et al. (1998), kandampully and suhartunto (2003). Complaining behavior is measured by Three-item scale which is classified in three groups of complaining to other customers, complaining to other hotels, and complaining to hotel staff and it was validated by yu and dean (2000).
4. RESULT AND ANALYSIS
In the present study, the hypotheses are tested by Amos 18. The research applies Structural Equation Modeling (SEM) technique, which is relatively an strong method for analyzing the relationship between dependent and independent variables in customer satisfaction model.
At first, in order to access the measurement models, a Confirmatory Factor Analysis (CFA) is used. In the second phase, Structural Equation Modeling is applied to examine the general fit of the proposed model with data and also to identify the overall relationships among these constructs (Magistris and Gracia, 2008)
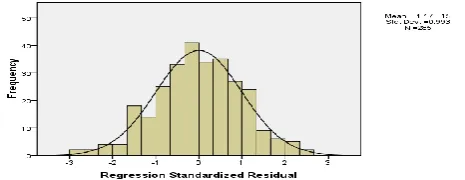
After assessing the normality of population, Maximum likelihood (ML) method of estimation is used to avoid the missing value. According to figure 3 the normality of the population has been approved while the actual distribution of the residuals is bell-shaped and similar to the normal distribution.
Figure 3. Normality Histogram
4.1 Testing the Measurement Models
A Confirmatory Factor Analysis is done to determine the latent factors of each construct. Magistris and Gracia (2008) believed that “the adequacy of the measurement model is evaluated by:
Overall fit of model with the data;
ISSN: 1839 - 0846
In this study measurement models were validated separately for perceived quality, perceived value, image, customer expectation, customer satisfaction, customer loyalty, and complaining behavior. Modification indices are applied to select indicators of each constructs. The number of indicators of each contact is presented in table 1. To assess the measurement models, several fit indexes are used. Results of measurement models with more that three question are presented in the following table.
Table 1: Results for Measurement Models
Measures Acceptable Perceived
quality Perceived value Image
Customer loyalty Absolute Fit Measures
2
20.552 6.291 25.054 5.203df 15 3 16 2
p p>0.05 0.152 0.098 0.069 0.07
RMR Close to zero 0.01 0.02 0.04 0.03
GFI Clos to 1 0.98 0.99 0.97 0.99
AGFI >0.90 0.95 0.95 0.95 0.95
Incremental Fit Measures
TLI >0.85 0.99 0.97 0.98 0.976
NFI >0.85 0.98 0.98 0.97 0.987
IFI >0.85 0.99 0.99 0.98 0.992
CFI >0.85 0.99 0.99 0.98 0.992
RFI >0.85 0.97 0.96 0.94 0.962
Parsimonious Measures
df
/
2
1-5 1.37 0.062 1.566 2.601RMSEA <0.08 0.03 0.00 0.04 0.07
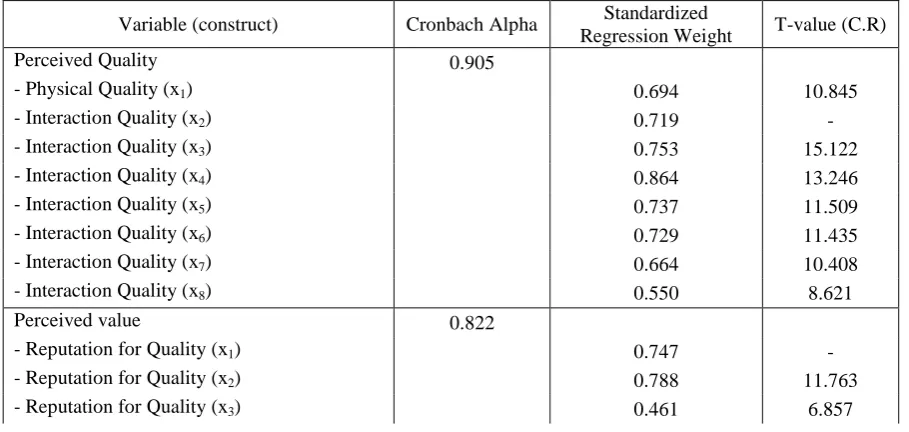
Considering all of these fit indexes it is obvious that there is a satisfactory fit between the proposed model and data. Consistency of measurement is called reliability. In table 2, results indicate that the alpha value exceeds the recommended level of 0.7 for each measurement model. On the other hand, the remaining indicators of each construct are significant at the 0.001 significant level and their standardized regression weights exceeds 0.5 which indicates a strong relation between the indicators and the latent variable. T-value (C.R) of indicators of each construct exceeds the critical values at 5 percent significant level (1.96). So we can conclude that all variables are significant in their specified constructs. Therefore, the fit of the all measurement models is confirmed.
Table 2: Results for Measurement Models
Variable (construct) Cronbach Alpha Standardized
Regression Weight T-value (C.R)
Perceived Quality 0.905
- Physical Quality (x1) 0.694 10.845
- Interaction Quality (x2) 0.719 -
- Interaction Quality (x3) 0.753 15.122
- Interaction Quality (x4) 0.864 13.246
- Interaction Quality (x5) 0.737 11.509
- Interaction Quality (x6) 0.729 11.435
- Interaction Quality (x7) 0.664 10.408
- Interaction Quality (x8) 0.550 8.621
Perceived value 0.822
- Reputation for Quality (x1) 0.747 -
- Reputation for Quality (x2) 0.788 11.763
- Value for Money (x4) 0.625 11.714
- Prestige (x5) 0.814 12.350
Image 0.847
- Cognitive Image (x1) 0.713 -
- Cognitive Image (x2) 0.501 7.881
- Cognitive Image (x3) 0.514 7.937
- Cognitive Image (x4) 0.581 8.781
- Cognitive Image (x5) 0.541 8.469
- Cognitive Image (x6) 0.612 9.449
- Affective Image (x7) 0.815 11.984
- Affective Image (x8) 0.887 12.069
Customer Expectation 0.817
- Overall Quality (x1) 0.538 -
- Product Quality (x2) 1 8.615
- Service Quality (x3) 0.799 9.779
Customer Satisfaction 0.921
- Overall (x1) 0.889 -
- Comparison with other Hotels (x2) 0.871 20.414
- Comparison with Ideal (x3) 0.925 22.279
Customer Loyalty 0.793
- Positive Word of Mouth (x1) 0.542 -
- Positive Word of Mouth (x2) 0.928 9.186
- Positive Word of Mouth (x3) 0.802 9.172
- Willingness to Pay More (x4) 0.554 7.364
Complaining Behavior 0.70
- Complaining to other Hotels (x1) 0.733 -
- Complaining to other Hotels (x2) 0.653 2.497
- Complaining to other Hotels (x3) 0.220 2.431
4.2 Testing the Structural Model
Hypotheses were tested by applying Structural Equation Modeling (SEM) technique which connects endogenous and exogenous variables. Maximum likelihood (ML) procedure is used to estimate the structural coefficients.
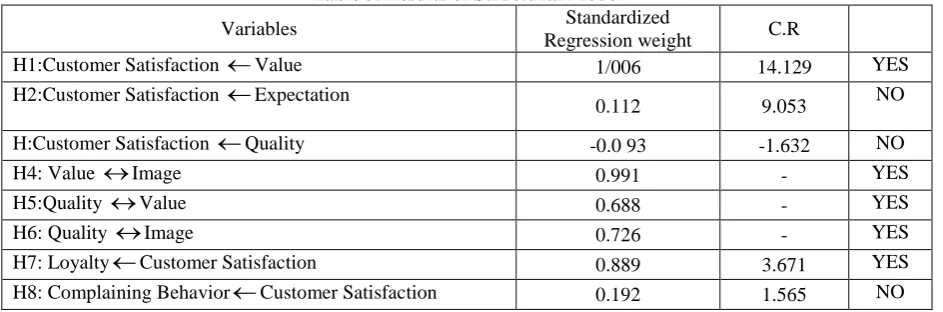
Table 3: presents the Standardized Regression Weight, T-ratio (C.R) and their significant level after adaptation of modification indexes. Standardized structural coefficient estimates of all variables are above 0.5 and t-ratio (C.R) is above 1.96 threshold at 0.05 significant level which indicates that all variables are significantly different from zero.
Table 3. Results of Structural Model
Variables Standardized
Regression weight C.R
H1:Customer Satisfaction
Value 1/006 14.129 YESH2:Customer Satisfaction
Expectation0.112 9.053 NO
H:Customer Satisfaction
Quality -0.0 93 -1.632 NOH4: Value
Image 0.991 - YESH5:Quality
Value
0.688 - YESH6: Quality
Image 0.726 - YESH7: Loyalty
Customer Satisfaction 0.889 3.671 YESISSN: 1839 - 0846
The assessment of the overall fit of the proposed model is presented in Table 4.
Table 4: Model Goodness- of- Fit
Measures Acceptable Estimated Model
Absolute Fit Measures
2
(CMIN) 847.165df 470
RMR Close to zero 0.10
GFI Close to 1 0.852
AGFI > 0.85 0.850
Incremental Fit Measures
TLI > 0.85 0.926
NFI > 0.85 0.865
IFI > 0.85 0.935
CFI > 0.85 0.934
RFI > 0.85 0.851
Parsimonious Fit Measure
df
/
2
1-5 1.802RMSEA < 0.08 0.053
Magistris and Gracia (2008) indicated that “Absolute fit measures determine the degree at which the overall model (Structural and Measurement Model) predicts the observed covariance or correlation matrix”. After applying modification indexes, GFI and AGFI value become close to 1 and RMR value becomes close to zero which are acceptable results. Additionally, RMSEA is in the acceptable range which indicates a good fit between model and empirical covariance matrix. TLI, NFI, IFI, RFI and CFI are calculated in order to having the comparison to a baseline model. The results which are above 0.85, indicate that the proposed model is
acceptable. Moreover, the results indicate that the model is parsimonious because
2/
df
is in the range, suggested by Arabuckle and wothke (2004).According to the findings, it can be inferred that the proposed model is not completely reasonable while four hypotheses have been verified and three hypotheses have been rejected. Results are presented in the next section.
4.3 Hypotheses Verification
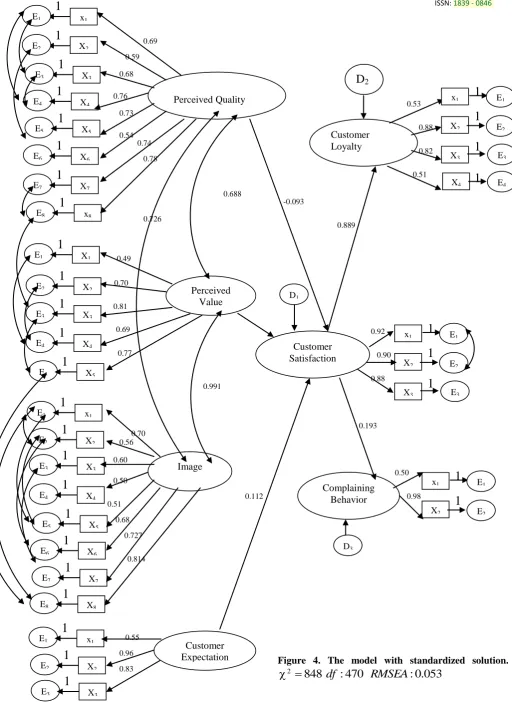
The final Structural Equation Model for customer satisfaction is shown in figure 4 latent variables are shown as ellipses; causal relations are shown with single headed arrows and standardized correlation between two variables with two- headed arrows.
Standardized Regression Weights are (between 0 and 1) are placed on the arrows in both measurement models and structural model.
The positive and strong standardized value between perceived value and customer satisfaction, customer satisfaction and loyalty, perceived value and image, perceived quality and value, perceived quality and image (1/006, 0.889, 0.991, 0.688, 0.726, respectively) indicate that the H1,H4, H5, H6, H7, stated in the proposed
1
1
1
E1 E2 E3 E4 x1 X2 X3 X41
E5 X5
1
E6 X6
1
E7 X7
1
E8 x8
1
E1 X1
1
E2 X2
1
E3 X3
1
E4 X4
1
E5 X5
1
E1 x1
1
E2 X2
1
E3 X3
1
E4 X4
1
E5 X5
1
E6 X6
1
E7 X7
1
E8 X8
1
E1 x1
1
E2 X2
1
E3 X3
1
Perceived Quality Perceived Value Image Customer Expectation Customer LoyaltyD
2X4 E4
x1 X2 X3 E1 E2 E3
1
1
1
1
Customer Satisfaction D1X3 E3
x1 X2 E1 E2
1
1
1
Complaining Behavior x1 X2 E1 E21
1
D3 0.69 0.59 0.76 0.68 0.73 0.54 0.74 0.78 0.49 0.70 0.81 0.69 0.77 0.53 0.88 0.82 0.51 0.726 0.688 -0.093 0.889 0.92 0.90 0.88 0.193 0.50 0.98 0.112 0.70 0.56 0.50 0.60 0.814 0.727 0.68 0.51 0.55 0.83 0.96 0.991Figure 4. The model with standardized solution.
ISSN: 1839 - 0846
5. CONCLUSION
This research aims to investigate the drivers and consequences of customer satisfaction in hotel industry in Iran. Results provide evidence on the customer satisfaction determinants and give information to hotel managers to improve this industry in Iran.
From the statistical results, it is confirmed that perceived value and customer satisfaction has a direct and positive relationship.
Moreover, results indicated that perceived value and image, perceived value and perceived quality, and perceived quality and image have a relationship and by improving one of them, the other one will become higher. In contrary to the literature review, customer expectation and perci9eved quality are not identified as determinant factors of customer satisfaction. In addition, it is found out that increased customer satisfaction will cause customer loyalty and consequently customer repurchase intention. Finally, the relationship between customer satisfaction and complaining behavior is not significant enough.
REFERENCES
1. Anderson, E.W., Fornell, C. And Lehmann, D. R. (1994). Customer Satisfaction, Market Share, and Profitability: Findings from Sweden. Journal of Marketing, 58, 53-66.
2. Baker, D. A. And Crompton, J. L. (2000). Quality Satisfaction And Behavioral Intentions. Annals Of Tourism Research, 27 (3) ,785-804
3. Anderson, E.W, Fornell, C. And Rust, R.T. (1997). Customer Satisfaction, Productivity, and Profitability: Differences between Goods and Services. Marketing Science, 16 (2), 129-145.
4. Boshoff, C. And Gray, B. (2004). The Relationships Between Service Quality, Customer Satisfaction And Buying Intentions In The Private Hospital Industry. South African Journal Of Business Management, 35(4), 27–37.
5. Anton, J. (1996). Customer Relationship Management: Making Hard Decisions With Soft Numbers, Upper Saddle River, New Jersey: Prentice Hall, Inc.
6. Fornell, C. (1992). A National Customer Satisfaction Barometer: The Swedish Experience. Journal of Marketing, 56(1), 1–21.
7. Oliver, R. L. (1997). Satisfaction A Behavioral Perspective Of The Consumer, New York:Mcgraw-Hill. 8. Matzler, K., Sauerwein, E. And Heischmidt, K. (2003). Importance-Performance Analysis Revisited: The
Role Of The Factor Structure Of Customer Satisfaction. The Service Industries Journal, 23(2), 112 – 129. 9. Brookes, D. and Stodin, N. (1995). The New Service Relationship, Canadian Business Review.
10. Liljander, V. and Strandvik, T., (1997). Emotions In Service Satisfaction. International Journal of Service Industry Management, 8 (2), 148-69.
11. Lee, C.S. and Bang S.B. (2004). The Effects Of Shopping Value On Online Purchasing Intention: Focus On Product Attribute Importance As Intervening Variables, Korean Marketing Research, 19 (2), 41–69. 12. Gallarza, M.G. and Gil-Saura, I.G. (2006). Value Dimensions, Perceived Value, Satisfaction and Loyalty:
An Investigation of University Students’ Travel Behavior, Tourism Management, 27,437-452.
13. Sparks, B.A., Butcher, K. and Pan, G. (2007). Understanding Customer-Derived Value In The Timeshare Industry, Cornell Hotel And Restaurant Administration Quarterly, 48 (1), 28–45.
14. Mcdougall, G.H.G. and Leveque T. (2000). Customer Satisfaction with Services: Putting Perceived Value into the Equation. Journal of Services Marketing, 14 (5), 392–410.
15. Pizam, A. and Ellis, T. (1999). Customer Satisfaction and Its Measurement in Hospitality Enterprises. International Journal of Contemporary Hospitality Management, 11(7), 326-339.
16. Eskildsen, J., Kristensen, K., Juhl, H.T. and Ostergaard, P. (2004). The Drivers of Customer Satisfaction and Loyalty. The Case of Denmark 2000–2002. Total Quality Management, 15(5–6), 859–868.
17. Oliver, R.L. (1980). A Cognitive Model of the Antecedents and Consequences of Satisfaction Decisions. Journal Of Marketing Research, 17(4), 460–469.
18. Fornell, C., Johnson, M. D., Anderson, E., Cha, W. J. and Bryant, B. E. (1996). The American Customer Satisfaction Index: Nature, Purpose,And Findings. Journal of Marketing, 60, 607–618.
19. Johnson, M. D., Gustafsson, A., Andreassen ,T. W., Lervik, L. and Cha J. (2001). The Evolution and Future of National Customer Satisfaction Index Models. Journal Of Economic Psychology, 22 (2), 217– 245.
20. Zeithaml, V.A. and Bitner, M.J. (1996). Services Marketing, Mcgraw-Hill, New York, Ny.
21. Taylor, S. A. and Baker, T. L. (1994). An Assessment of The Relationship Between Service Quality And Customer Satisfaction In The Formation Of Consumers’ Purchase Intentions. Journal of Retailing, 70(2), 163–178.
23. Mohajerani, P. and Miremadi, A.R. (2012). The Effective Aspect of Customer Satisfaction In Hotel Industry In Kish Island (Modeling). International Journal of Marketing Studies (Ijms), 4(2), 134-152. 24. Juhl, H.J., Kristensen, K. And Østergaard, P. (2002). Customer Satisfaction in European Food Retailing.
Journal of Retailing and Consumer Services, 9(6), 327–334.
25. Pollack, B. L. (2009). Linking the Hierarchical Service Quality Model to Customer Satisfaction And Loyalty. Journal of Services Marketing, 23(1), 42–50.
26. Nasution, H. N. and Mavondo, F. T. (2008). Customer Value In The Hotel Industry: What Managers Believe They Deliver And What Customer Experience, International Journal of Hospitality Management, 27(2), 204-213.
27. Bosque, I. and Martin, H. (2008). Tourist Satisfaction A Cognitive-Affective Model, Annals of Tourism Research, 35, 551–573.
28. Trkyılmaz, A. and Ozkan, C. (2007). Development of a Customer Satisfaction Index Model an Application to the Turkish Mobile Phone Sector. Industrial Management & Data Systems, 107(5), 672-687.
29. Hsu, S.H. (2008). Developing an Index For Online Customer Satisfaction: Adaptation Of American Customer Satisfaction Index, Expert Systems With Applications, 34, 3033–3042.
30. Johnson, M.S. and Garbarino, E. (1998). The Different Roles of Satisfaction, Trust, And Commitment In Customer Relationships, Journal Of Marketing, 63, 70-87.
31. Kandampully, J. and Suhartanto, D. (2003). The Role of Customer Satisfaction And Image In Gaining Customer Loyalty In The Hotel Industry. Journal of Hospitality & Leisure Marketing, 10, 54-63.
32. Yu, Y. and Dean, A. (2001). The Contribution of Emotional Satisfaction to Consumer Loyalty. International Journal of Service Industry Management, 12(3), 234-250.