A Methodology for Implementing the Analytic Hierarchy
Process to Students’ Academic Performance
Olufemi Sunday Adeoye
Department of Computer ScienceUniversity of Uyo Nigeria
Robinson Samuel Akpan
Department of Computer ScienceUniversity of Uyo Nigeria
ABSTRACT
Several tools exist for determining the dominant factor affecting students’ academic performance. Among the tools that have been used so far are correlation regression analysis, linear regression analysis, t-test, ANOVA, content analysis technique, and chi-square. This research deployed the use of analytical hierarchy process (AHP) to determine the dominant factor influencing students’ academic performance. The AHP is done by evaluating the normalized weights of four criteria suggested by the data collected through questionnaires administered to students of the University of Uyo, Nigeria. The result of the study revealed that student-based factor with the eigenvector (priority) of 55.9% is the dominant factor among the four.
General Terms
Soft Computing
Keywords
Methodology,Analytic hierarchy process, students’ academic performance, institution-based factor, parental-based factor, environmental-based factor, student-based factor
1.
INTRODUCTION
Education stakeholders have long been interested in exploring variables contributing effectively to the academic performance of students. These variables are both internal and external to the school environment. The factors have been categorized into four. They are student-based factors,
parent-based
factors, institution-based factors, and environmental-based factors. Generally these factors include home environment, study habits, learning skills, gender, parents occupation, class attendance, competence in language, parents level of education, parents income, influence of lecturers, social economic status, boredom, motivation, attitude, self-esteem, stress, workload, active learning, health status, time spent on task, extra-curriculum activities, peer influence, effective time management, self-efficacy, class size, and marital status.
The analytic hierarchy process (AHP) is a general theory of measurement which is derived by making pair wise comparisons using numerical judgments from an absolute scale of numbers. It is a multi-criteria decision making, originally developed by mathematician Thomas L. Saaty, and is a tool with numerous applications in areas of planning and management [10]. AHP suggest that decision makers from all disciplines can take advantage of the methodology if they can learn it without having to struggle with the mathematical jargon, no matter how simple it can be for an OR professional [3]. The analytic hierarchy process is a multi-criteria decision analysis (MCDA) tool that has proven to simplify complex decision analysis because it allows for the quantification of
subjective criteria to be synthesized together with qualitative criteria in a simple, powerful and structured manner [11]. In addition, the consistency of judgements on the criteria can be measured [9]. The AHP technique has gained wide spread application by the international science and engineering communities as a robust and flexible MCDA tool for dealing with complex decision problems [7]. Schools, colleges and universities have no worth without students. Students are the most essential assets for any educational institute. According to Cambridge Dictionary a student is a person who is learning at a college or university. The social and economic development of the country is directly dependent on the quality of graduate produce by tertiary institutions. The students’ academic performance plays an important role in the quality of leadership and manpower for the country thus responsible for the country’s economic and social development [2].
Academic performance refers to what the students have learned or what skills the student has learned and is measured through assessment such as test, examinations performance assessment and portfolio assessment [5]. Academic success has a great influence on a student’s self-esteem, motivation and perseverance in higher education. So poor academic performance or high level of failure may result in unacceptable levels of attrition, reduced graduate throughput and increased cost of education. The descriptive assessment information will usually be translated through grading system such as grade point average (GPA) and course grade. The performance of students especially at the tertiary level is not only a pointer to the effectiveness or otherwise of schools but a major determinant of the future of youths in particular and the nation in general, creating the conditions that foster student’s success in tertiary institution.
2.
AIM AND OBJECTIVES OF THE
STUDY
The aim of this study is to deploy analytic hierarchy process to determine the dominant factor affecting students’ academic performance. The objectives are:
1. To collect students data through questionnaire.
2. To design and implement a framework for the use of AHP in determining students’ academic performance.
3. To investigate the dominant factor affecting students’ academic performance.
3.
REVIEW OF RELATED
LITERATURE
performance of undergraduate students. This work investigates the relationship between admission points, parents’ social economic status, school background and academic performance. According to Jack and Norman [4], correlation research describes an existing relationship between variables. The study took the quantitative approach because it was based on variables measured with numbers and analyzed with statistical procedures. In the work of Nasir et al [8] a well-defined questionnaire for data collection was used and statistical techniques which include simple linear regression analysis were used as a methodology. A sample of private colleges was taken where these variables were recognized and response was clear and understandable. A sample of 300 students was taken from a group of colleges. A hypothesis was formed on students profile developed on the bases of information collected through questionnaire and simple linear regression analysis were used to test the hypothesis. The computed and approved degree results of the students containing the age, gender and final cumulative grade point average (FCGPA) which reflects the overall academic performance of each student was collected from the Departmental records. The students aged 25 years and below were considered to be within the age range for undergraduate programme while those above 25 years were outside the range. Linear regression analysis, ANOVA and Chi Square were used to analyze data at 0.05 level of significance. Akessa and Dhufera [1] also made used of self-administered questionnaire to collect data from students before the actual data analysis, questionnaires were checked for completeness and consistency. Data were analyzed using descriptive statistical techniques such as frequency distributions and percentages. Chi-square test and regression analysis were established and explain the relationship between the Academic performance and the independent variables. Results of the analysis were presented using tables and graphs. The Statistical Software Package for Social Sciences (SPSS) version 20 is used to generate descriptive statistics such as frequency and percentage to present a sample demographic profile of respondents. The study in Noble et al [12] found that academic activities of students, perceptions of their adapting strategies and background qualities (for example family pay, direction from parents, number of negative circumstances in the house, and parents’ level of education) were indirectly connected to their compound scores, during academic achievement in secondary school. Direction is a component through which a student knows how to progress his study approach and study schedule and is directly corresponding to academic accomplishment. The students who are appropriately guided by their guardians have done well in the examinations. The direction from the educator also influences performance of students [13]. Raychaduri et al [14] examined that various studies have been concluded to recognize those variables which influence academic performance of the students. The academic performance of the students also rely on various socioeconomic variables like students’ participations in the class, family pay, and teacher-student ratio, presence of qualified teachers in school and gender of the student [13]. Several studies have also been done on the impart of peer influence on student performance. Studies revealed that peer influence has more influential effects than family [16].
4.
STUDENTS’ ACADEMIC
PERFORMANCE
All students are required to maintain a satisfactory academic record and meet the obligations of the courses in which they study. Academic performance is defined as the outcome of education or the extent to which a student, teacher or institution has achieved their educational goals. Academic performance may also refers to what the students have learned or what skills the student has gained and is measured through assessment like standardized test, performance assessment and portfolio assessment [5]. People always consider grades first when evaluating academic performance. These include schools that rank students by their GPA, awarding special designations such as valedictorian and salutatorian for those who graduate first or second in their class. Scholarship organizations and universities also start by looking at grades, as do some employers, especially when hiring recent graduates. Grades don’t always reflects a person’s knowledge or intelligence Some students don’t perform well in a classroom setting but are very intelligent and earn high marks on Intelligent Quotient (IQ) tests, standardized testing or university entrance exams. The ability to master diverse set of skills illustrates intelligence, curiosity and persistence, qualities attractive to universities and employers. Some colleges will admit and even award scholarships to students who earn average grades but display a pattern of achievement by consistently learning new skills. While some may not graduate top of their classes they may hold leadership positions in several students groups or score high on standardized test, however several factors affect students’ academic performance.
4.1
Factors Affecting Students’ Academic
Performance
The factors identified as affecting students’ academic performance according to literature reviewed in this study have been classified under four main categories. They are institution-based factor, parental-based factor, environmental-based factor, and student-environmental-based factor. Extended list of these factors are home environment, study habit, learning skills, gender, parents occupation, class attendance, competence in language, parents level of education, parents income, influence of lecturers, social economic status, boredom, motivation, attitude, self-esteem, stress, workload, active learning, time spent on task, extra-curriculum activities, peer influence, help seeking effective time management tools, self-efficacy, class size, and marital status.
5.
PROPOSED SYSTEM
ARCHITECTURE
Due to the constraints inherit in the existing system it motivates us to develop new system using AHP that determine the most preferable method that influences the students’ academic performance. The structure is represented in figure 1.0 and it has the following major components:
i. Analytical Hierarchy Process(AHP)
ii. User Interface
Fig 1: System Architecture of Students’ Academic Performance using AHP
6.
RESEARCH METHODOLOGY
In this study several factors affecting students’ academic performance were discovered from literature, questionnaires were administered to sizable number of students based on the factors, assign weights to the factors and rank them based on their order of priority. The data captured are stored in the firebase database and processed using AHP. We the put the comparison matrix into MATLAB in order to confirm if the result of numerical computation of eigenvalue and eigenvector compared to the approximation values obtained from the calculation.
The Analytic Hierarchy Process gets its input from the database, it analyzes the parameters by computing the vector based on criteria weights, ranking the options and also checking the consistency then produces an output i.e. the criteria with the highest weight. The AHP stores it output to the database. This is done by following this algorithm.
6.1
Computing the vector of criteria weights
In other to compute the weights for the different criteria, the AHP starts creating a pair wise comparison matrix A. The matrix A is an n×n real matrix, where n is the number of evaluation criteria considered. The relative importance between two criteria is measured according to a numerical scale from 1,3,5,7 and 9. It is also possible to assign intermediate values which do not correspond to a precise interpretation. The values in the matrix A are by construction pair wise consistent. On the other hand, the ratings may in general show slight inconsistencies. Once the matrix A is built, it is possible to derive from A the normalized pair wise comparison matrix Anorm by making equal to 1 the sum of the entries on each column, i.e. each entry ajk of the matrix Anorm is computed as
(1)
Finally, the criteria weight vector w (that is an m-dimensional column vector) is built by averaging the entries on each row of Anorm, i.e.
(2)
6.2
Ranking the options
Once the weight vector w has been computed, the AHP obtains a vector v of global scores by multiplying S and w, i.e.
v = S · w (3)
Where w = weight vector and S = the score matrix
The ith entry vi of v represents the global score assigned by the AHP to the ith option. As the final step, the option ranking is accomplished by ordering the global scores in decreasing order.
6.3
Checking the Consistency
The result of the pair wise comparison contain some inconsistency which AHP invoke an effective technique to check the consistency of the evaluations made by the decision maker in each of the pair wise comparison matrix involved in the process. This technique relies on the computation of a suitable consistency index, in matrix A the Consistency Index
(CI) is obtained by first computing the scalar x as the average of the elements of the vector whose jth element is the ratio of the jth element of the vector A.w to the corresponding element of the vector w. Then,
ג (4)
Where: CI is the consistency index
λ is the eigenvalue
m is the number of comparison
We obtained point for consistent decision when CI=0, but small values of inconsistency is tolerated. That is if
(5)
Then, the inconsistencies are tolerable, and a reliable result may be expected from the AHP. In the equation (7) RI is the
Random Index, i.e. the consistency index when the entries of A are completely random. The values of RI are constant. AHP
CI
RESULT RI DATABASE USER
7.
CONCEPTUAL DESIGN OF AHP
MODEL
Figure 2 shows the conceptual design of AHP based systems for use in the selection of the dominant factor, the objective or
goal is the first level, the criteria are found in the second level, while the alternative are found in the third level.
Fig 2: Conceptual Design of AHP model
The dataset obtained for the proposed system is tabulated as
Table 1: Criteria Rating from Questionnaire
Factors Strong Weak
Institution Based Factor 27.25 27.75 Parental Based Factor 18.25 36.75 Environmental Based
Factor
31.9 19.6
Student Based Factor 34.0 21.0
Using Saaty Scale, the relative importance between the three criteria is measured according to a numerical scale from 1 to 9, as shown below
Table 2: AHP numerical scale
Value of ajk Interpretation
1 j and k are equally important 3 j is slightly more important than k
5 j is more important than k
7 j is strongly more important than k
9 j is absolutely more important than k
A matrix can be formed from the four comparisons above. The diagonal elements of the matrix are always 1 and we only need to fill up the upper triangular matrix. How to fill up the upper triangular matrix is using the following rules:
1. If the judgment value is on the left side of 1, we put the actual judgment value.
2. If the judgment value is on the right side of 1, we put the reciprocal value.
To fill the lower triangular matrix, we use the reciprocal values of the upper diagonal. If aij is the element of row i
column j of the matrix, then the lower diagonal is filled using this formula
6
From the table above derive the Criteria Comparison Matrix. From the four comparisons, it will be a 4 by 4 matrix.
Table 3: Criteria Comparison Matrix
SBF EBF IBF PBF
SBF 1 3 5 7
EBF 1/3 1 3 5
IBF 1/5 1/3 1 3
PBF 1/7 1/5 1/3 1
Step 1: First, find the sum of each column in the criteria comparison matrix i.e. We sum each column of the reciprocal matrix as shown below;
Col 1 = 1 + 1/3 + 1/5 + 1/7 = 1.676 Col 2 = 3 + 1 + 1/3 + 1/5 = 4.533 Col 3 = 5 + 3 + 1+ 1/3 = 9.333 Col 4 = 7 + 5 + 3 + 1 = 16.00
3
1/3
5
1/5 1/3 3
1/7 7 5 1/5
1/3
3
Figure 3: A graphical Representation of Dominance Selection of the most dominant factor affecting students’ academic performance
Parent-based factor Environmental-based factor Student-based factor Institution-based factor
Student 1 Student 2 Student 3 Student n
SBF EBF
Table 4: Criteria Comparison Matrix 2
SBF EBF IBF PBF
SBF 1 3 5 7
EBF 1/3 1 3 5
IBF 1/5 1/3 1 3
PBF 1/7 1/5 1/3 1
Total 1.676 4.533 9.333 16.00
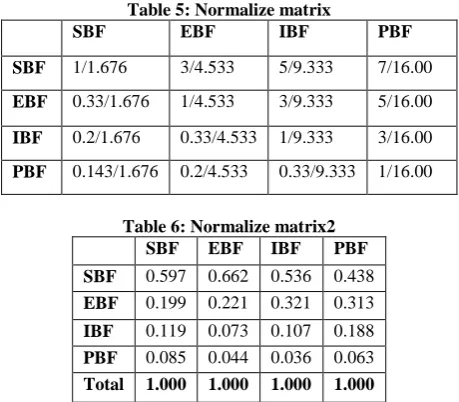
Step 2: Then divide each element of the matrix with the sum of its column, to have the normalized relative weight. The sum of each column is 1.
Table 5: Normalize matrix
SBF EBF IBF PBF
SBF 1/1.676 3/4.533 5/9.333 7/16.00
EBF 0.33/1.676 1/4.533 3/9.333 5/16.00
IBF 0.2/1.676 0.33/4.533 1/9.333 3/16.00
PBF 0.143/1.676 0.2/4.533 0.33/9.333 1/16.00
Table 6: Normalize matrix2
SBF EBF IBF PBF
SBF 0.597 0.662 0.536 0.438 EBF 0.199 0.221 0.321 0.313
IBF 0.119 0.073 0.107 0.188 PBF 0.085 0.044 0.036 0.063 Total 1.000 1.000 1.000 1.000
Step 3: The normalized principal eigenvector (w vector) can be obtained by averaging across the rows. The normalized principal eigenvector is also called priority vector. Since it is normalized, the sum of all elements in priority vector is 1. The priority vector shows relative weights among the things that we compare.
Row1 = (0.597 + 0.662 + 0.536 + 0.438)/4 = 0.5583 Row2 = (0.199 + 0.221 + 0.321 + 0.313)/4 = 0.2635 Row3 = (0.119 + 0.073 + 0.107 + 0.188)/4 = 0.1218 Row4 = (0.085 + 0.044 + 0.036 + 0.063)/4 = 0.0570
Table 7: Priority Vector
Aside from the relative weight, one can also check the consistency of our result. To do that, first obtain the Principal eigenvalue. The principal eigenvalue is obtained from the summation of products between each element of eigenvector and the sum of columns of the reciprocal matrix.
λmax = 1.673 (0.5585) + 4.53(0.2638) + 9.33(0.122) +
16.00(0.0567)
λmax = 0.934 + 1.195 + 1.138 + 0.907
λmax = 4.174
8.
CHECKING OF CONSISTENCY
USING MATLAB
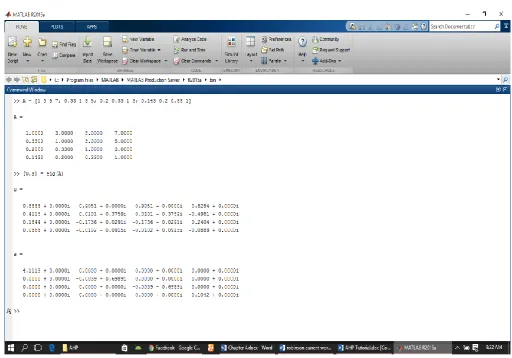
By putting the comparison matrix into MATLAB to see how different is the result of numerical computation of eigenvalue and eigenvector compared to the approximation values obtained from the calculation, four eigenvectors concatenated into four columns of matrix, w were obtained. The corresponding eigenvalues are the diagonal of matrix, s.
8.1
Result from MATLAB Environment
>> A = [1 3 5 7; 0.33 1 3 5; 0.2 0.33 1 3; 0.143 0.2 0.33 1] A =
1.0000 3.0000 5.0000 7.0000 0.3300 1.0000 3.0000 5.0000 0.2000 0.3300 1.0000 3.0000 0.1430 0.2000 0.3300 1.0000 >> [w,s]= eig(A)
w =
0.8883 + 0.0000i 0.9051 + 0.0000i 0.9051 + 0.0000i 0.8284 + 0.0000i
0.4115 + 0.0000i 0.0101 + 0.3759i 0.0101 0.3759i -0.4981 + 0.0000i
0.1844 + 0.0000i -0.1736 + 0.0291i -0.1736 - 0.0291i 0.2404 + 0.0000i
0.0868 + 0.0000i 0.0102 0.0915i 0.0102 + 0.0915i -0.0889 + 0.0000i
s =
4.1119 + 0.0000i 0.0000 + 0.0000i 0.0000 + 0.0000i 0.0000 + 0.0000i
0.0000 + 0.0000i -0.0039 + 0.6989i 0.0000 + 0.0000i 0.0000 + 0.0000i
0.0000 + 0.0000i 0.0000 + 0.0000i -0.0039 - 0.6989i 0.0000 + 0.0000i
0.0000 + 0.0000i 0.0000 + 0.0000i 0.0000 + 0.0000i -0.1042 + 0.0000i
SBF EBF IBF PBF Eigenvector
SBF 0.597 0.662 0.536 0.438 0.558
EBF 0.199 0.221 0.321 0.313 0.264
IBF 0.119 0.073 0.107 0.188 0.122
PBF 0.085 0.044 0.036 0.063 0.057
Fig 4: Result of numerical computation of eigenvalue and eigenvector in MATLAB command window.
The largest eigenvalue is called the Principal eigenvalue, that is s = 4.1119 which is very close to our approximation λmax =
4.17. The principal eigenvector is the eigenvector that corresponds to the highest eigenvalue.
The sum is 1.571 and the normalized principal Eigenvector is
This result is also very close to our approximation
Thus the approximation is quite good. The sum of Eigenvector is not one but when an Eigenvector normalized, then you gets a priority vector. The sum of priority vector is one.
8.2
Checking for Consistency
Saaty proved that for consistent reciprocal matrix, the largest Eigenvalue is equal to the number of comparisons, or λmax = n.
Then he gave a measure of consistency, called Consistency Index as deviation or degree of consistency using the following formula
ג
7
Where n is the number of comparison; in this case 4 and λmax
is the Eigenvalue
CI = 0.058
After obtaining the consistency Index we use this index by comparing it with the appropriate one. The appropriate Consistency index is called Random Consistency Index (RI).
Saaty, proposed what is called Consistency Ratio, which is a comparison between Consistency Index and Random Consistency Index, or in formula
8
Where RI = 0.9 for four comparison
CR = 0.058/0.9 = 0.06
8.3
Result Discussions for Analytic
Hierarchy Process (AHP)
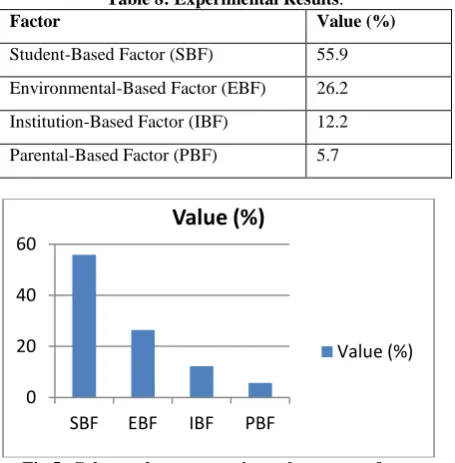
priority of 5.7%. So the most dominant or important factors that affect student academic performances are in Student-Based Factor, followed by Environmental-based factor, Institutional-based factor and Parental-based factor. From Saaty theory, if the value of Consistency Ratio is smaller or equal to 10%, the inconsistency is acceptable. If the Consistency Ratio is greater than 10%, then the subjective judgment need to be revised. Since our CR is 0.06 (less than 10%), it therefore means that our subjective evaluation about the factors that affects Students’ Academic Performance is consistent.
Table 8: Experimental Results.
Factor Value (%)
Student-Based Factor (SBF) 55.9
Environmental-Based Factor (EBF) 26.2
Institution-Based Factor (IBF) 12.2
Parental-Based Factor (PBF) 5.7
Fig 5: Column chart comparing values across factors
9.
CONCLUSION
Evaluating the factors that affects student academic performance is important as it helps to improve the academic performance and overall success of the student. Various methods used in analyzing the factors that affects student academic performance have been considered in the course of this research work. This work examines and use Analytic Hierarchy Process (AHP) model for selecting the most suitable factor or criteria that affects students’ academic performance. The AHP is done by evaluating the normalized weights of four criteria suggested by the data collected from the questionnaire which was given to the student. Then the normalized weight of each criterion is calculated under each of these four criteria. Finally, the aggregate score is computed and the factors are ranked accordingly. The result of this work revealed that attention should be on students if their academic performance must improve.
10.
REFERENCES
[1] Akessa, G.M, Dhufera, A.G. (2015). Factors that Influences Students Academic Performance. Journal of Education and Practice.
[2] Ali, N., Jusoff, K., Ali, S., Mokhtar, N., & Salamat, A.S.A. (2009). The Factors Influencing Students’ Performance at University Technology, Malaysia. International Journal of Education.
[3] Enrique Mu and Milagros Pereyra-Rojas (2017).
Practical Decision Making: An Introduction to the Analytic Hierarchy Process (AHP) Using Super Decisions v2. Springer.
[4] Jack R. Fraenkel and Norman E. Wallen (1996), Research Pathways: Writing Professional Papers, Theses, and Dissertations in Workforce Education.
[5] John W. Santrock (2006). Educational Psychology, McGraw-Hill.
[6] Kyoshaba Martha (2009). Factors Affecting Academic Performance of Undergraduate Students at Uganda Christian University.
[7] Mertens, Karel (2015). Marginal Tax Rates and Income: New Time Series Evidence, National Bureau of Economic Research Working Paper 19171.
[8] Nasir Naqvi, Baba Shiv, Antoine Bechara (2006), the Role of Emotion in Decision Making.
[9] Saaty, T. L. (2012). Decision Making for Leaders: The Analytic Hierarchy Process for Decisions in a complex World. Third revised edition. Pittsburgh; RWS Publications.
[10]Saaty, T.L., 1980. “The Analytic Hierarchy Process.” McGraw-Hill, New York.
[11]Yavuz, M. (2015). Equipment Selection based on the AHP and Yager’s Method. Journal of South African Inst. Min. Metall. 115, 425 – 443.
[12]Noble J. P., Roberts, W. L., and Sawyer R. L. (2006). Student Achievement Behaviour, Perception and other Factors Affecting ACT scores. ACT Research Report Series, 2006-1. ACT Inc.
[13]Singh S. P., Savita Malik (2006). Factors Affecting Performance of Students. Indian Journal of Research.
[14]Raychaduri, A., Debnath, M., Sen, S., and Majumder, B. G. (2010). Factors Affecting Students’ Academic Performance. A case study in Agartala Municipal Council Area. Bandladesh e-journal of Sociology. 7(2). 34-41.
[15]Gonzales, N. A., Cauce, A. M., Friedman, R. J., and Mason, C. A., (1996). Family Peer, and Neighbourhood Influences on Academic Achievement Among African-American Adolescents: One-year Prospective Effects. American Journal of Community Psychology. 24(3). 365-387.
[16]Goethals, G. R. (2001). Peer Effects, Gender, and Intellectual Performance among Students at a Highly Selective College: A Social Comparison of Abilities Analysis. Williams Project on the Economics of Higher Education, 1-20.
[17]Hanushek, E. A., Kain J. F., Markman, J. M. and Rivkin, S. G. (2003). Does Peer Ability Affect Student Achievement? Journal of Applied Econometrics, 18(5), 527-544.
0 20 40 60
SBF EBF IBF PBF