Asian J. Med. Biol. Res. 2015, 1 (2), 271-284; doi: 10.3329/ajmbr.v1i2.25622
Asian Journal of
Medical and Biological Research
ISSN 2411-4472 (Print) 2412-5571 (Online)www.ebupress.com/journal/ajmbr Article
Morpho-physiological and yield performance of grain sorghum genotypes
Shepon Chandra Ghosh1, Soleh Akram2, S.M. Ahsan3, Abdulla-Al-Asif4*and Sayeed Shahriyar5
1
Department of Crop Botany, Faculty of Agriculture, Bangladesh Agricultural University, Mymensingh-2202, Bangladesh
2
Department of Genetics and Plant Breeding, Faculty of Agriculture, Bangladesh Agricultural University, Mymensingh-2202, Bangladesh
3
Department of Horticulture, Faculty of Agriculture, Patuakhali Science and Technology University, Bangladesh
4
Department of Aquaculture, Faculty of Fisheries, Bangladesh Agricultural University, Mymensingh-2202, Bangladesh
5
Department of Biotechnology, Faculty of Agriculture, Bangladesh Agricultural University, Mymensingh-2202, Bangladesh
*Corresponding author: Abdulla-Al-Asif, Department of Aquaculture, Faculty of Fisheries, Bangladesh Agricultural University, Mymensingh-2202, Bangladesh. Mobile: +8801716838294; E-mail: [email protected]
Received: 26 July 2015/Accepted: 10 September 2015/ Published: 30 September 2015
Abstract: A pot experiment was carried out at the grill house of the Department of Crop Botany, Bangladesh
Agricultural University, Mymensingh during the period from December 2013 to April 2014 to study the growth, morpho-physiological, yield and yield contributing characters of twenty sorghum genotypes. The experiment was consisted of twenty genotypes of sorghum viz., BD 700, BD 701, BD 702, BD703, BD704, BD705, BD706, BD707, BD708, BD709, BD710, BD712, BD720, BD721, BD722, BD725, BD726, BD727, BD728 and BD729. The experiment was laid out in a Completely Randomized Design with three replications. The collected data were analyzed statistically and the means were adjudged by Duncan’s multiple range test at 1% level of probability. Among the genotypes, BD 725 showed significantly the best performance on growth, yield and morpho– physiological characters compare to other genotypes at harvest, while BD728 was less efficient among those parameters. As a result, highest plant height (251.20 cm), panicle plant–1 (2.83), highest 1000–grain weight (27.10 g), highest grain yield (3.58 t ha–1), straw yield (16.05 t ha–1) and biological yield (19.64 t ha–1) was recorded from BD 725 at harvest. However, number of leaves, leaf area plant–1 and Leaf area index had also significantly highest (18.33 and 5542.0 cm2 and 2.81, respectively) in BD 725 at 90 days after sowing. BD 725 further recorded the highest growth of cumulative growth rate (32.54 g m–2 day–1) at the stage between 60–90 days after sowing thereafter they decreased. All the above growth, yield and morpho–physiological characters were less effective in BD728. On the basis of these results, BD 725 was found outstanding for plant growth, yield and morpho–physiological characters of sorghum.
Keywords: sorghum genotypes; growth performance, yield performance; genetic makeup; regional adaptability
1. Introduction
Sorghum (Sorghum bicolor Lenius.) is a self-pollinated diploid (2n=2x=20) C4 grass with a high photosynthetic
producing countries include Australia, Brazil, Argentina, China, Burkina Faso, Mali, Egypt, Niger, Tanzania, Chad and Cameroon. Grain is mostly used as food (55%), in the form of flat breads and porridges (thick or thin) in Asia and Africa, and as feed (33%) in the Americas. Its Stover is an increasingly important source of dry season fodder for livestock, especially in Asia (ICRISAT, 2014). In Bangladesh, 254 tons of sorghum grains are produced annually from about 187 ha of land and average yield is 1.36 tons per hectare (FAOSTAT, 2014). Sorghum is a principal source of energy, protein, vitamins and minerals for millions of the poorest people in the regions where it is cultivated. The protein content (11.3%) is nearly equal and is comparable to that of wheat and maize. Average starch content of the seeds 69.50 % and is relatively rich in iron, phosphorous and vitamin B-complex (ICRISAT, 2014).
Sorghum has potential uses (six F) such as, food (grain), feed (grain and biomass), fuel (ethanol production), fiber (paper), fermentation (methane production) and fertilizer (utilization of organic byproducts), thus it is an important crop in semi-arid and arid regions of the world. Sorghum is a crop for semi-arid regions in tropical and sub-tropical areas where moisture is a limiting factor for crop growth. It can be grown successfully throughout the country both under irrigated and rain-fed conditions. It has the potential of producing high green fodder yields (Ghasemi et al., 2012). Sorghum grain is the staple food of poor and the most food-insecure people, living mainly in the semiarid tropics (Ali et al., 2009; Bibi et al., 2010). It performs better under adverse soil and weather conditions as compared to other crops (Ejeta and Knoll, 2007). However, sorghum grown in arid and semi-arid regions is influenced by water stress at terminal growth stages like anthesis and postanthesis which renders the most adverse effect on yield in sorghum (Prasad et al., 2008).
In Bangladesh, it is also a cereal crop and ranks fifth among cereal crops (Ahmed et al., 2002). The crop is drought tolerant and moderately salt tolerant (Amiruzzaman et al., 1997) and it is the crop par excellence for dry areas (Arunachalam and Ram, 1967). However, sorghum has considerable further potential to be used as a human food as grain and in sorghum syrup or sorghum molasses and alcoholic beverage source as well as biofuels (Hill et al., 2009, Searchinger et al., 2008). The grains can also be popped in a similar fashion to popcorn (Fargione et al., 2008). In developing countries like Bangladesh the commercial processing of the locally grown grain into value-added food and beverage products is an important driver for economic development. In Bangladesh, this crop is traditionally grown in the northern district and in the Chittagong Hill Tracts. Traditionally sorghum cultivation districts of Bangladesh are Jamalpur, Kushtia, Pabna, Rajshahi, Sherpur, Meherpur, Bagerhat etc. Sorghum grain is mainly used for human food and feed for cattle. Moreover seeds are used for pop corn and preparing delicious food in our country. As the crop has potentiality to grow under adverse condition, minimum input and care, so its cultivation can be extended in dry and saline areas. Many practical applications were found to improve the production of several grain crops by exploiting a variation among genotypes in the quantity and quality of food output (Rai, et al., 2004). Yield performance of sorghum depends on the varietal characteristics and on regional adoptability. On the basis of the above aspects the present study was conducted to investigate the growth and yield performance of twenty high yielding grain sorghum genotypes at Bangladesh Agricultural University, Mymensingh (Agro Ecological Zone- 9).
2. Materials and Methods
This study was conducted to assess the morpho-physiological and yield performance of grain sorghum genotypes during the period from December 2013 to April 2014. A pot experiment was carried out at the grill house of the Department of Crop Botany, Bangladesh Agricultural University, Mymensingh. Geographically the experimental area is located at 24°75' North latitude and 90°50' East longitudes at the elevation of 18 m above the sea level.
2.1. Soil condition
The soil of the experiment was collected from the Crop Botany Field Laboratory of Bangladesh Agricultural University, Mymensingh. The collected soil belongs under the agro-ecological zone of Old Brahmaputra Floodplain (Agro Ecological Zone- 9).
2.2. Climate and weather
2.3. Experimental materials
The seeds of twenty sorghum genotypes were used as the planting materials for this experiment. The twenty sorghum genotypes are as follows:
V1 : BD 700 V11 : BD 710
V2 : BD 701 V12 : BD 712
V3 : BD 702 V13 : BD 720
V4 : BD 703 V14 : BD 721
V5 : BD 704 V15 : BD 722
V6 : BD 705 V16 : BD 726
V7 : BD 706 V17 : BD 727
V8 : BD 707 V18 : BD 728
V9 : BD 708 V19 : BD 725
V10: BD 709 V20 : BD 729
2.4. Preparation of pots
In this experiment Poly Venyl Chloride pots were used. The diameter of each pot was 21 cm and height was 26 cm. Soils were collected from Crop Botany Field Laboratory of Bangladesh Agricultural University, Mymensingh. The collected soil was well pulverized and dried in the sun. Plant propagules and inert materials were removed from this soil. The dry soil was thoroughly mixed with manure and fertilizers before filling the pots. The pots of the experiment were filled with 9 kg of soils.
2.5. Fertilizer application
Fertilizer application in pots is given below in Table 1.
Table1. Fertilizer application in pots.
Fertilizers Rates( kg ha-1) Amounts pot-1(g)
Urea 190 2.09
TSP 90 0.99
MP 90 0.99
Gypsum 50 0.55
ZnSO4 8 0.0879
Boron 25 0.275
The weight of 1 ha soil at the depth of 15 cm was considered 3 × 10⁶ kg of soil. According to the above rate fertilizers were calculated as per kg of soil (BINA, 1999). For pot soil required fertilizers were three times than field soil. So, total amount of Urea (2.09g), TSP (0.99 g), MP (0.99 g), Gypsum (0.55 g), ZnSO4 (0.0879 g) and Boron (0.275 g) were mixed with sundry soil in each pot thoroughly.
2.6. Experimental design and sowing of seeds
The single-factor experiment was laid out in a Completely Randomized Design with three replications. As there were 20 genotypes, the total number of pots used in this study was 60 (20 × 3). Seeds were sown on 15th December 2013. Ten seeds were sown in each pot and plants were thinned to two plants per pot at 30 days interval. The field layout of the experiment is shown in.
2.7. Harvesting, threshing and drying
The plants were uprooted carefully for data collection. The crop of each experimental pot was harvested separately at full maturity on 25th April to 30th April 2014. The harvested crop of each pot was bundled separately, tagged properly. The bundles were dried in sunshine and brought to a clean floor. Seeds and other plant parts were collected for each pot and were recorded data separately.
2.8. Collection of data
and straw yields were recorded pot wise on oven dry basis. The data on the following parameters were recorded:
Growth and morpho-physiological characters-
Plant height (cm), Number of leaves per plant, Leaf area (cm2), Leaf Area Index, Crop Growth Rate (g m–2 day–
1
), Total dry matter (g).
Yield and yield contributing characters at harvest-
Panicle length (cm), Panicle/plant, 1000-grain weight (g), Grain wt. /plant (gm), Grain yield (t ha-1), Straw yield (t ha-1), Biological yield (t ha-1).
2.8.1. Plant height
Plant height was measured in centimeter by a meter scale at 30 days after interval from 30 days after sowing up to harvest from the ground surface to the top of the main shoot and the mean height was expressed in cm.
2.8.2. Number of leaves per plant
Number of leaves per plant was counted at 30, 60, 90 days after sowing and at harvest. The leaves were counted and recorded from each plant.
2.8.3. Total dry matter
The plant parts such as shoot including leaves and roots were detached and were kept separately in oven at 80±2O C for 72 hours. The oven dried samples were weighed for dry matter production. The total dry matter production was calculated from the summation of shoots and roots.
2.8.4. Leaf area plant–1
Leaf area plant–1 was calculated by the following formula– Leaf area= Length of leaf (cm) × width of leaf (cm)
2.8.5. Leaf Area Index (LAI)
Leaf area index was measured by dividing leaf area per plant with surface area (cm2) covered by the plant. Leaf Area Index are measured by following equation.
Leaf Area Index =
2.8.6. Crop Growth Rate
The crop growth rate values at different growth stages were calculated using the following formula–
CGR =
GA
1
×
1 2
1 2
T
-T
W
-W
g m–2 day–1
Where, W1 = Total dry matter production at previous sampling date
W2 = Total dry matter production at current sampling date
T1 = Date of previous sampling
T2 = Date of current sampling
GA = Ground area (m2)
2.8.7. No. of panicle plant–1
Number of panicle plant–1 was counted at the time of harvest.
2.8.8. 1000–grain weight (g)
One thousand cleaned dried grains were counted randomly from each sample and weighed by using a digital electric balance at the stage the grain retained 12% moisture and the mean weight were expressed in gram.
2.8.9. Grain yield (t ha–1)
After harvesting, the grains were removed from the separated panicle and then dried in sun for 2–3 days. Finally, grain weights were taken on individual pot basis at moisture content of 12% and then converted into t ha–1.
Leaf area per plant (cm2)
2.8.10. Biological yield (t ha–1)
The biological yield was calculated with the following formula– Biological yield= Grain yield + Straw yield
2.9. Statistical analysis
The collected data were analyzed statistically following the analysis of variance (ANOVA) technique and the mean differences were adjudged by Duncan’s Multiple Range Test (DMRT) using the statistical computer package program, MSTAT-C.
3.Results
3.1. Plant height
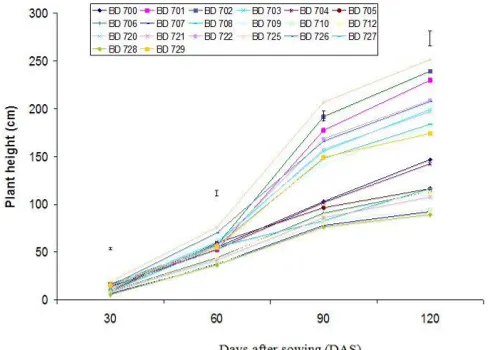
The effect of twenty sorghum genotypes on plant height at 30, 60, 90 and 120 days after sowing was significant at 1% level. Results showed that plant height increased with age. At 30 days after sowing the maximum height of sorghum plant was recorded from the variety BD 725 (18.84 cm) and minimum from the variety BD 707 (5.28 cm), where all other genotypes recorded plant height ranges from 5.58 cm to 16.35 cm. At 60 days after sowing highest plant height (76.11 cm) was recorded from BD 725 and lowest (36.04 cm) from BD 710. At 90 days after sowing highest plant height (206.8 cm) was recorded from BD 725 and lowest (76.02 cm) from BD 728. At maturity twenty sorghum genotypes showed different plant heights ranging from 89.15 cm to 251.2 cm. The highest plant height was recorded in BD 725 (251.2 cm) and lowest plant height was recorded in BD 728 (89.15 cm), at 120 Days. All other genotypes recorded intermediate plant height, ranged from 92.30 to 239.2 cm. Effect of sorghum genotypes on plant height at different days after sowing are shown in Figure 1.
Figure 1. Effect of sorghum genotypes on plant height at different days after sowing where vertical bar indicates least significant differences at 1% level of probability.
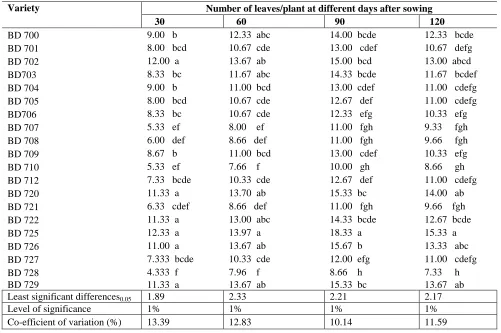
3.2. Number of leaves plant–1
Table 2. Effect of sorghum genotypes on number of leaves plant-1 at different days after sowing.
Variety Number of leaves/plant at different days after sowing
30 60 90 120
BD 700 9.00 b 12.33 abc 14.00 bcde 12.33 bcde
BD 701 8.00 bcd 10.67 cde 13.00 cdef 10.67 defg
BD 702 12.00 a 13.67 ab 15.00 bcd 13.00 abcd
BD703 8.33 bc 11.67 abc 14.33 bcde 11.67 bcdef
BD 704 9.00 b 11.00 bcd 13.00 cdef 11.00 cdefg
BD 705 8.00 bcd 10.67 cde 12.67 def 11.00 cdefg
BD706 8.33 bc 10.67 cde 12.33 efg 10.33 efg
BD 707 5.33 ef 8.00 ef 11.00 fgh 9.33 fgh
BD 708 6.00 def 8.66 def 11.00 fgh 9.66 fgh
BD 709 8.67 b 11.00 bcd 13.00 cdef 10.33 efg
BD 710 5.33 ef 7.66 f 10.00 gh 8.66 gh
BD 712 7.33 bcde 10.33 cde 12.67 def 11.00 cdefg
BD 720 11.33 a 13.70 ab 15.33 bc 14.00 ab
BD 721 6.33 cdef 8.66 def 11.00 fgh 9.66 fgh
BD 722 11.33 a 13.00 abc 14.33 bcde 12.67 bcde
BD 725 12.33 a 13.97 a 18.33 a 15.33 a
BD 726 11.00 a 13.67 ab 15.67 b 13.33 abc
BD 727 7.333 bcde 10.33 cde 12.00 efg 11.00 cdefg
BD 728 4.333 f 7.96 f 8.66 h 7.33 h
BD 729 11.33 a 13.67 ab 15.33 bc 13.67 ab
Least significant differences0.05 1.89 2.33 2.21 2.17
Level of significance 1% 1% 1% 1%
Co-efficient of variation (%) 13.39 12.83 10.14 11.59
3.3. Leaf area
Statistical analysis of the data revealed that differences in average leaf area of different genotypes were significant at 1% level. The Maximum average leaf area plant–1 at 30, 60, 90 and 120 days after sowing (830.70 cm2, 1637.00 cm2, 5542.00 cm2 and 4992.00 cm2, respectively) was obtained from variety BD 725. On the other hand, minimum average leaf area plant–1 at 30, 60, 90 and 120 days after sowing (357.20 cm2, 619.0 cm2, 1157.00 cm2 and 593.90 cm2 respectively) was obtained from variety BD 728. Effect of sorghum genotypes on leaf area at different days after sowing are shown in Figure 2.
3.4. Total dry matter
A significant variation (at 1% level) was found due to the effect of twenty genotypes of sorghum in respect of total dry matter at all growth stages. The highest total dry matter at 30, 60, 90 and 120 days after sowing (7.30 g, 66.19 g, 197.30 g and 269.0 g respectively) was obtained from variety BD 725. The lowest total dry matter was found at 30 days after sowing in BD 728 (3.34 g), at 60 days after sowing in BD 706 (35.98 g), at 90 and 120 days after sowing in BD 728 (89.34 g and 117.80 g, respectively). Effect of sorghum genotypes on total dry matter at different days after sowing are shown in Figure 3.
Figure 3. Effect of sorghum genotypes on total dry matter at different days after sowing here vertical bar indicates least significant differences at 1% level of probability.
Table 3. Effect of sorghum genotypes on Leaf area index at different days after sowing.
Variety Leaf area index at different days after sowing
30 60 90 120
BD 700 0.05 ghi 0.43 cde 1.54 e 1.43 e
BD 701 0.08 abcd 0.45 cd 1.94 d 1.78 d
BD 702 0.06 efg 0.36 ef 2.25 bc 2.05 c
BD 703 0.08 bcd 0.36 ef 1.89 d 1.71 d
BD 704 0.04 ghi 0.46 cd 1.10 g 1.03 g
BD 705 0.04 ghi 0.50 c 1.08 g 1.00 g
BD 706 0.03 ij 0.34 ef 1.60 e 1.38 ef
BD 707 0.03 ij 0.36 ef 1.05 g 1.01 g
BD 708 0.04 ghi 0.38 def 1.37 f 1.27 f
BD 709 0.07 cde 0.43 cde 1.62 e 1.52 e
BD 710 0.04 hij 0.36 ef 1.05 g 0.99 g
BD 712 0.05 efgh 0.42 cde 1.26 f 1.10 g
BD 720 0.08 cd 0.490 c 2.23 bc 2.07 c
BD 721 0.05 fghi 0.40 def 1.09 g 0.99 g
BD 722 0.08 cd 0.42 cde 2.37 b 2.22 b
BD 725 0.09 abc 0.69 a 2.81 a 2.62 a
BD 726 0.05 efgh 0.62 ab 2.20 c 2.09 bc
BD 727 0.07 def 0.60 b 2.16 c 2.06 c
BD 728 0.02 j 0.32 f 1.07 g 0.966 g
BD 729 0.08 cd 0.68 ab 1.90 d 1.68 d
Least significant differences0.05 0.016 0.07 0.14 0.13
Level of significance 1% 1% 1% 1%
3.5. Responses of genotypes on growth characters of sorghum 3.5.1. Leaf area index
The effect of variety on leaf Area Index at 30, 60, 90 and 120 days after sowing was significant at1% level. The highest leaf area index was observed at 30, 60, 90 and 120 days after sowing in BD 725 (0.09, 0.69, 2.81 and 2.62, respectively). In contrast, the lowest Leaf area index was observed at 30 and 60 days after sowing in BD 728 (0.23 and 0.32, respectively), at 90 days after sowing in BD 707 (1.05) which was statically identical with BD 728 (1.00), BD 710 (1.06) and BD 721 (1.09), respectively. At harvest the lowest leaf area index was observed in BD 728 (0.96) which was statically identical with BD 707 (1.01), BD 710 (0.99), BD 705 (1.00) and BD 704 (1.03) respectively. It is observed from the data that leaf area index increased up to 90 days after sowing and decreased thereafter and the genotypes differed significantly at all the stages. Here Table 3 has shown that effect of sorghum genotypes on Leaf area index at different days after sowing.
3.5.2. Crop growth rate
The effect of variety on crop growth rate at, 30-60, 60-90 and 90-120 days after sowing was significant at 1% level. The highest crop growth rate was observed at 30-60, 60-90 and 90-120 days after sowing in BD 725 (5.15 gm-2day-1, 32.54 gm-2day-1 and 22.90 gm-2day-1 respectively). However, the lowest crop growth rate was observed at 30-60, 60-90 and 90-120 days after sowing in BD 728 (2.35 g m-2 day-1, 15.26 g m-2 day-1 and 10.08 g m-2 day-1, respectively). Effect of sorghum genotypes on Crop growth rate at different days after sowing are shown in Figure 4.
Figure 4. Effect of sorghum genotypes on Crop growth rate at different days after sowing where vertical bar indicates least significant differences at 1% level of probability.
3.6. Responses of genotypes on yield and yield contributing characters of sorghum
3.6.1. Number of panicle plant-1
The effect of variety on panicle number plant-1 at 120 days after sowing was significant at 1% level. At 120 days after sowing the maximum number of panicle plant-1 was found in BD 725 (2.83) which was statically identical with BD 722 (2.75) and the minimum number of panicle was noticed in BD 728 (1.00). All other genotypes showed intermediate values in panicle number plant-1, ranged from 1.167 to 2.550.
3.6.2. Panicle length
Figure 5. Effect of sorghum genotypes on panicle length at harvest where vertical bar indicates least significant differences at 1% level of probability.
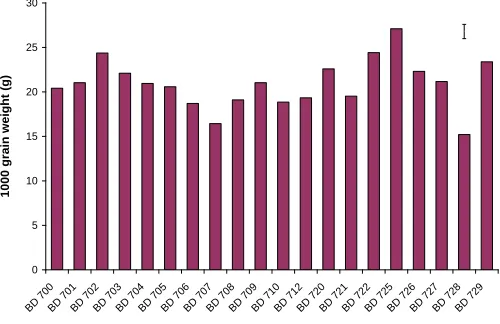
3.6.3. 1000–grain weight
The effect of variety on 1000 grain weight was significant at 1% level. The highest 1000 grain weight was observed at 120 days after sowing in BD 725 (27.10 g). However, the lowest 1000 grain weight was observed at 120 days after sowing in BD 728 (15.20 g) which was statically with BD 707 (16.43 g). All other genotypes showed intermediate values in 1000 grain weight, ranged from 18.70 g to 24.41 g. Effect of sorghum genotypes on 1000–grain weight at harvest are shown in Figure 6.
Figure 6. Effect of sorghum genotypes on 1000–grain weight at harvest where vertical bar indicates least significant differences at 1% level of probability.
3.6.4. Grain weight plant-1
The effect of variety on grain weight plant-1 was significant at 1% level. The data on grain weight plant-1 indicated that the variety BD 725 showed the best performance in terms of grain weight (44.83 g) at harvest in compared to all other genotypes. On the other hand, the minimum grain weight plant-1 was recorded from BD 728 (30.27 g) at harvest. All other genotypes showed intermediate values in grain weight plant-1, ranged from 31.47 g to 42.15 g (Table 7).
3.6.5. Grain yield
The effect of variety on grain yield was significant at 1% level. The highest grain yield was observed at 120 days after sowing in BD 725 (3.58 t ha-1). However, the lowest grain yield was observed at 120 days after sowing in BD 728 (2.42 t ha-1). All other genotypes showed intermediate values in grain yield, ranged from 2.51 t ha-1 to 3.43 t ha-1. Effect of sorghum genotypes on grain yield at harvest are shown in Figure 7.
0 5 10 15 20 25 30 35
BD 700BD 701BD 702BD 703BD 704BD 705BD 706BD 707BD 708BD 709BD 710BD 712BD 720BD 721BD 722BD 725BD 726BD 727BD 728BD 729 Variety
Panicle
length (cm)
0 5 10 15 20 25 30
BD 700BD 701BD 702BD 703BD 704BD 705BD 706BD 707BD 708BD 709BD 710BD 712BD 720BD 721BD 722BD 725BD 726BD 727BD 728BD 729
Variety
10
00
Figure 7. Effect of sorghum genotypes on grain yield at harvest here vertical bar indicates least significant differences at 1% level of probability.
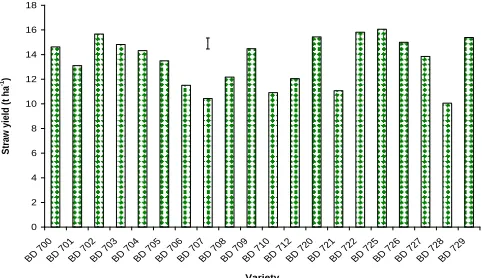
3.6.6. Straw yield
The effect of variety on straw yieldwas significant at 1% level. The results indicate that the highest straw yield (16.05 t ha–1) was observed in BD 725 which was statistically similar with BD 722 (15.81 t ha–1) and BD 702 (15.67 t ha–1) respectively. However, the lowest straw yield was observed at 120 days after sowing in BD 728 (10.05 t ha-1). All other genotypes showed intermediate values in straw yield, ranged from 10.43 t ha-1 to 15.81 t ha-1. Effect of sorghum genotypes on straw yield at harvest are shown in Figure 8.
Figure 8. Effect of sorghum genotypes on straw yield at harvest here vertical bar indicates least significant differences at 1% level of probability.
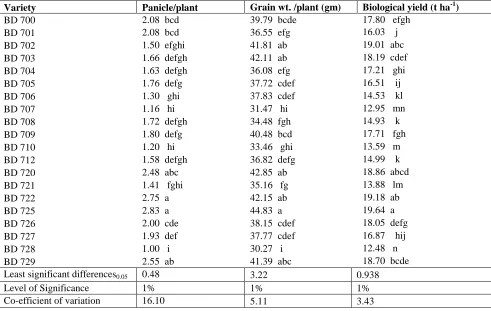
3.6.7. Biological yield
The effect of variety on biological yield was significant at 1% level. The results indicate that the highest biological yield (19.64 t ha–1) was observed in BD 725. On the other hand, the lowest biological yield was observed at 120 days after sowing in BD 728 12.48 t ha-1. All other genotypes showed intermediate values in biological yield, ranged from 12.95 t ha-1 to 19.18 t ha-1. Effect of sorghum genotypes on Panicle/plant, grain wt. /plant and biological yield at harvest are shown in Table 4.
0.00 0.50 1.00 1.50 2.00 2.50 3.00 3.50 4.00 4.50
BD 700BD 701BD 702BD 703BD 704BD 705BD 706BD 707BD 708BD 709BD 710BD 712BD 720BD 721BD 722BD 725BD 726BD 727BD 728BD 729
Variety
Grai
n yie
ld (t
ha
-1)
0 2 4 6 8 10 12 14 16 18
BD 700BD 701BD 702BD 703BD 704BD 705BD 706BD 707BD 708BD 709BD 710BD 712BD 720BD 721BD 722BD 725BD 726BD 727BD 728BD 729
Variety
Stra
w yie
ld (t
ha
Table 4. Effect of sorghum genotypes on Panicle/plant, grain wt. /plant and biological yieldat harvest.
Variety Panicle/plant Grain wt. /plant (gm) Biological yield (t ha-1)
BD 700 2.08 bcd 39.79 bcde 17.80 efgh
BD 701 2.08 bcd 36.55 efg 16.03 j
BD 702 1.50 efghi 41.81 ab 19.01 abc
BD 703 1.66 defgh 42.11 ab 18.19 cdef
BD 704 1.63 defgh 36.08 efg 17.21 ghi
BD 705 1.76 defg 37.72 cdef 16.51 ij
BD 706 1.30 ghi 37.83 cdef 14.53 kl
BD 707 1.16 hi 31.47 hi 12.95 mn
BD 708 1.72 defgh 34.48 fgh 14.93 k
BD 709 1.80 defg 40.48 bcd 17.71 fgh
BD 710 1.20 hi 33.46 ghi 13.59 m
BD 712 1.58 defgh 36.82 defg 14.99 k
BD 720 2.48 abc 42.85 ab 18.86 abcd
BD 721 1.41 fghi 35.16 fg 13.88 lm
BD 722 2.75 a 42.15 ab 19.18 ab
BD 725 2.83 a 44.83 a 19.64 a
BD 726 2.00 cde 38.15 cdef 18.05 defg
BD 727 1.93 def 37.77 cdef 16.87 hij
BD 728 1.00 i 30.27 i 12.48 n
BD 729 2.55 ab 41.39 abc 18.70 bcde
Least significant differences0.05 0.48 3.22 0.938
Level of Significance 1% 1% 1%
Co-efficient of variation 16.10 5.11 3.43
4. Discussion
The variation in plant height of sorghum was significant due to genetic makeup or characteristics. Plant height is one of the most important growth contributing characters for any corps which would be related on several factors like genetic makeup, nutrient availability, environmental or climatic condition, soil characteristics, regional adaptability etc. Similar findings were also obtained by Ghasemi et al. (2012) who reported that the different plant height of different sorghum varieties due to their genetic makeup and regional adaptability. Maximum number of leaves plant-1 at 30 days after sowing (12.33) was found in BD 725. At 60, 90 and 120 days after sowing maximum number of leaves plant-1 (13.97, 18.33 and 15.33 respectively) were obtained from BD 725. On the other hand, minimum number of leaves plant-1 was recorded at 30 days after sowing in BD 728 (4.33), 60 days after sowing in BD 710 (7.66), 90 and 120 days after sowing in BD 728 (8.66 and 7.33, respectively).The result coincides with the findings of Ayub et al. (2010) reported that eight sorghum cultivars/varieties had significant variation on number of leaves plant–1. The variation in number of leaves had been due to the difference in genetic makeup of the varieties. Similar findings were also found by Faridullah et al. (2009) who found that the significant variation in leaf production of sorghum occurred due to their genetic makeup.
The Maximum average leaf area plant–1 at 30, 60, 90 and 120 days after sowing 830.70 cm2, 1637.00 cm2, 5542.00 cm2 and 4992.00 cm2, respectively was obtained from variety BD 725. On the other hand, minimum average leaf area plant–1 at 30, 60, 90 and 120 days after sowing 357.20 cm2, 619.0 cm2, 1157.00 cm2 and 593.90 cm2 respectively was obtained from variety BD 728.These results revealed that the leaf area increased up to 90 DAS and thereafter decreased at harvest. The present result was harmonized with the findings of Saberi et al. (2011) who reported that the leaf area in speed feed was reduced to 1391 cm2 plant–1, while the reduction was lower in KFS4. Similar findings were also found by Faridullah et al. (2009) in leaf production which was occurred for the genetic difference of sorghum varieties and by Uzoma et al. (2010) for Millet varieties.
were also obtained by the many researchers such as Sarfraz et al. (2012) in sorghum, Al–Lahham, et al., (2013) in forage sorghum, Ayub et al. (2010) in forage sorghum, Channappagoudar et al. (2007) in sorghum genotypes. All the researchers showed that the genotypes differed significantly for growth characters.
The highest leaf area index was observed at 30, 60, 90 and 120 days after sowing in BD 725 (0.09, 0.69, 2.81 and 2.62, respectively). In contrast, the lowest Leaf area index was observed at 30 and 60 days after sowing in BD 728 (0.23 and 0.32, respectively), at 90 days after sowing in BD 707 (1.05). At harvest the lowest leaf area index was observed in BD 728 (0.96). Similar findings was also observed by Channappagoudar et al. (2007) who conducted an experiment with 22 rabi sorghum genotypes resulted in sorghum genotypes differed significantly for the growth characters. The high yielding genotypes had higher leaf area index which is appeared to be optimum for maximum grain yield.
The highest crop growth rate was observed at 30-60, 60-90 and 90-120 days after sowing in BD 725 (5.15 gm
-2
day-1, 32.54 gm-2day-1 and 22.90 gm-2day-1 respectively). However, the lowest crop growth rate was observed at 30-60, 60-90 and 90-120 days after sowing in BD 728 (2.35 g m-2 day-1, 15.26 g m-2 day-1 and 10.08 g m-2 day-1, respectively). The findings of Rao et al. (2003) were similar with this study where CGR had higher dry matter production at 30, 60 and 90 days after sowing.
At 120 days after sowing the maximum number of panicle plant-1 was found in BD 725 (2.83) and the minimum number of panicle was noticed in BD 728 (1.00). The variation in number of panicle plant-1 was found due to the variation of tiller production and also the genetic variations of the assigned sorghum genotypes.
The highest panicle length was observed at 120 days after sowing in BD 725 (29.22 cm). However, the lowest panicle length was observed at 120 days after sowing in BD 728 (14.89 cm). Panicle length was significantly influenced by the genotypic effect of sorghum at harvest. The findings of Shinde et al. (2010) were similar to this study.
The highest 1000 grain weight was observed at 120 days after sowing in BD 725 (27.10 g). However, the lowest 1000 grain weight was observed at 120 days after sowing in BD 728 (15.20 g). The variation in 1000– grain weight was found due to its genetic variation. Patil (2007) studied an experiment using eight sorghum genotypes and six sorghum hybrids and observed significant variations on thousand seed weight among the genotypes.
The data on grain weight plant-1 indicated that the variety BD 725 showed the best performance in terms of grain weight (44.83 g) at harvest in compared to all other genotypes. On the other hand, the minimum grain weightplant-1 was recorded from BD 728 (30.27 g) at harvest.
The highest grain yield was observed at 120 days after sowing in BD 725 (3.58 t ha-1). However, the lowest grain yield was observed at 120 days after sowing in BD 728 (2.42 t ha-1). Genotypic variations play an important role in determining the yield of crops and the potential of genotypes within genetic limits is set by its adaptability with the studied area. Al–Lahham, et al., (2013) reported that the variation in grain yield among the cultivars may be attributed to many factors including the availability of nutrient in the soil and the gene responsible for the nutrient uptake. Bucheyeki et al. (2010) also found the similar genetic variation on yield.
The results indicate that the highest straw yield (16.05 t ha–1) was observed in BD 725. However, the lowest straw yieldwas observed at 120 days after sowing in BD 728 (10.05 t ha-1). Similarly, Abdel–Motagally (2010) studied on grain sorghum under water use efficiency in water regimes where Shandawell–6 cultivar recorded the highest values of head length (32.28 cm) head weight (96.53 g) and straw yield (26.11 kg plot–1) while Giza–15 was the tallest cultivar (309.12 cm).
Highest biological yield (19.64 t ha–1) was observed in BD 725. On the other hand, the lowest biological yield was observed at 120 days after sowing in BD 728 (12.48 t ha-1). All other genotypes showed intermediate values in biological yield, ranged from 12.95 t ha-1 to 19.18 t ha-1. Biological yield data showed significant differences by the genotypic effect of sorghum at harvest.
5. Conclusions
Acknowledgments
I acknowledge National Science and Technology scholarship which is funded by Ministry of Science and Technology-Government of Peoples Republic of Bangladesh for contribution of financing the whole research project.
Conflict of interest
None to declare.
References
Abdel–Motagally FMM, 2010. Evaluation of water use efficiency under different water regimes in grain sorghum (Sorghum bicolor, L. Monech). World J. Agric. Sci., 6:499–505.
Ahmed AU, MA Sarker, JA Choudhury, N Ara and MM Ali, 2002. Genetic divergence analysis in chickpea. Bangladesh J. Agric. Res., 27:47–50.
Amiruzzaman M, MA Yousuf–Akond, MAZ Choudhury and MM Houque, 1997. Genetic divergence in grain sorghum (Sorghum bicolor (L.) Moench). Bangladesh J. Plant Breed. Genet., 10:45–49.
Ali MA, A Abbas, S Niaz, M Zulkiffal and S Ali, 2009. Morpho–physiological criteria for drought tolerance in sorghum (Sorghum bicolor) at seedling and post–anthesis stages. Int. J. Agric. Biol., 11:674–680.
Al–Lahham G, M Khaiti and Shehab, 2013. Promising Sudangrass (Sorghum Sudanese) line for high fodder yield production. J. App. Sci. Res., 8:2215–2220.
Arunachalam V and J Ram, 1967. Geographical diversity in relation to genetic divergence in cultivated sorghum. Ind. J. Genet., 27:369–376.
Ayub M, MA Nadeem, M Tahir, A Ghafoor, Z Ahmed and M Naeem, 2010. Comparative studies on the growth, forage yield and quality of sorghum (Sorghum bicolor L.) varieties under irrigated conditions of Faisalabad. Pak. J. Life Soc. Sci., 8:94–97.
Bibi A, HA Sadaqat, HM Akram and MI Mohammed, 2010. Physiological markers for screening sorghum (Sorghum bicolor) germplasm under water stress condition. Intl. J. Agric. Biol., 12:451–455.
Bucheyeki TL, EM Shenkalwa, TX Mapunda and LW Matata, 2010. Yield performance and adaptation of four sorghum cultivars in Igunga and Nzega districts of Tanzania. Communications in Biomet. and Crop Sci., 5:4–10.
Channappagoudar BB, NR Biradar, TD Bharamagoudar and CJ Rokhade, 2007. Morpho–physiological characters contributing for drought tolerance in sorghum under receding soil moisture conditions. Karnataka J. Agric. Sci., 20:719–723.
Ejeta G and JE Knoll, 2007. Marker–Assisted Selection in Sorghum. In: Varshney RK, and Tuberosa R (eds.) Genomic–Assisted Crop Improvement: Vol. 2: Genomics Applications in Crops Springer Publications. The Netherlands. pp. 187–205.
FAOSTAT (The Statistical Division of Food and Agriculture Organization of the United Nations). 2014: Available at http://faostat3.fao.org/home/ index.html#DOWNLOAD. Accessed on 16.05.2014.
Fargione J, J Hill, D Tilman, S Polasky and P Hawthorne, 2008. Land clearing and the biofuel carbon debt. Sci., 319:1235–1238.
Faridullah, A Alam, MI Uddin, H Sher and IAM Ahmed, 2009. Comparison of different cultivars of sorghum for green fodder, dry matter and some other morphological characters. Bangladesh J. Env. Sci., 16:109–115. Ghasemi A, MH Karim and MM Ghasemi, 2012. Green Fodder Yield Performance of Different Varieties of
Sorghum grown in an Arid Region. Intl. J. Agri. Crop Sci., 4:839–843.
Hill J, S Polasky, E Nelson, D Tilman, H Huo, L Ludwig, J Neuman, H Zheng and D Bonta, 2009. Climate change and health costs of air emissions from biofuels and glasoline. Proc. Natl. Aca. Sci., 106:2077–2082.
ICRISAT (International Crops Research Institute for the Semi- Arid Tropics) 2014: Available at http://www.icrisat.org/crop-sorghum.htm. Accessed on 16.05.2014.
Patil SL, 2007. Performance of sorghum varieties and hybrids during postrainy season under drought situations in Vertisols in Bellary, India. J. SAT Agril Res., 5:1–3 (Online available at ejournal.icrisat.org).
Prasad PVV, SR Pisipati, RN Mutava and MR Tuinstra 2008. Sensitivity of grain sorghum to high temperature stress during reproductive development. Crop Sci., 48:1911–1917.
Rao SS, PR More, VD Solunke, DV Kasalkar, DI Jirali, KN Pawar, BB Channappa Goudar and MS Shinde, 2003. Characterization and utilization of post rainy season sorghum land race germplasms for drought stress parameters in diverse environments. Proceedings of International Conference on Managing Natural Resources for Sustainable Agricultural Production in 21st Century, Feb. 14–18, 2000, New Delhi 2:770– 772.
Saberi AR, H Siti Aishah, RA Halim and AR Zaharah, 2011. Morphological responses of forage sorghums to salinity and irrigation frequency. African J. Biotech., 10:9647–9656.
Sarfraz M, N Ahmad, U Farooq, A Ali and K Hussain, 2012. Evaluation of sorghum varieties/lines for hydrocyanic acid and crude protein contents. J. Agric. Res., 50:39–47.
Searchinger T, R Heimlich, RA Houghton, F Dong, A Elobeid, J Fabiosa, S Tokgoz and T Yu, 2008. Use of US croplands for biofuels increases greenhouse gases through emissions from land–use change. Sci., 319:1238–1240.
Shinde DG, BD Biradar, PM Salimath, MY Kamatar, AR Hundekar and SK Deshpande, 2010. Studies on genetic variability among the derived lines of B x B, B x R and R x R crosses for yield attributing traits in rabi sorghum (Sorghum bicolor (L.) MOENCH). Electronic J. Plant Breed., 1:695–705.