Infogain Publication (Infogainpublication.com) ISSN: 2454-1311
Decision Making Uncertain Environment - A
Queuing Theory Approach
Bhupender Kumar Som
Associate Professor, JIMS, Rohini, New Delhi, India
Abstract— Consumer behavior is one of the most uncertain phenomenons. Customer impatience is one of those uncertain phenomenon’s which is a threat to any business. Customer impatience results in loss of customers and business. Stochastic modeling provides numerical measurement of necessary measures of performance in any business up-to a certain extent. In this paper a multi-server Markovian queuing system is developed with reverse balking and impatient customers. Reverse balking is a very new concept introduced in stochastic queuing models. While reneging is one of the most known phenomenon in queuing theory. Steady-state solution of the newly developed model is derived. Necessary measures of performance are obtained and numerical results are presented. Sensitivity analysis of the model is also performed. MATLAB and MS Excel are used as and when needed.
Keywords— Reverse balking, customer impatience, retention of customers, stochastic modeling, queuing theory.
I. INTRODUCTION AND LITERATURE REVIEW
In this era of globalization and liberalization managing business has become a challenging task. Consumer behavior is one of the most uncertain characteristics of business environment. Customers have become more selective. Brand switching is more frequent. Due to higher level of expectations, customers get more impatient with a particular firm. Customer impatience has also become a burning problem in the corporate world. Queuing theory offers various stochastic models that can be used in various service systems facing customer impatience. By adopting and applying these stochastic models strategy making becomes highly effective. The premier work on customer impatience in queuing theory appeared in [Haight, 1957, 1959], [Anker & Gafarian, 1963a, 1963b], [Bareer, 1957] etc. Since then a number of papers have appeared on this concept (reneging and balking). In these models, reneging
and balking is a function of system size/ queue length. Larger is the system size more is the reneging and similar is the case of balking. But, when it comes to sensitive businesses like investment, selection of a food court, selection of a service station etc. more number of customers with a particular firm become the attracting (investing) factor for more investing customers. Thus, the probability of joining in such a firm is high. Modeling such a system as a queuing system indicates that the probability of balking will be low when the system size is more and vice-versa, which is balking in the reverse sense (we call it Reverse Balking).
The concept of reverse balking is introduced by [Jain, et. al., 2014], they studied a single server Markovain queuing system with reverse balking. [Kumar et. al., 2014] further introduce notion of reverse reneging and applied it with reverse balking. [Kumar et. al., 2013, 2014] designed queuing systems for various environments and further optimized them for various parameters.
Infogain Publication (Infogainpublication.com) ISSN: 2454-1311 single-server queuing model by incorporating customer
impatience and reverse balking. He also performed economic analysis of the model. Extending the work of the paper.
Owing to the practically valid aspects of above mentioned concepts, sensitive businesses with customer impatience are formulated as queuing system in this paper. Consider any life insurance company, where the purchase of policy refers to the arrival of a customer in the queuing system (insurance firms), the processed claim refers to as the departure from the queuing system, where the claim processing department is a multi-server and finite system capacity (the number of policies it can accommodate). The claims are processed in order of their arrival (i.e. the queue discipline is FCFS). We incorporate the reverse balking and reneging into this model. The model is based in Markovian assumptions.
We present steady-state analysis of the stochastic models as described above and derive important measures which help in the management of sensitive businesses like investment business. Numerical examples are provided for more clarity. Rest of the paper is structured as follows: in section 2 assumptions under which the model is developed are presented; section 3 deals with the mathematical formulation; in section 4 steady state solution is derived; section 5 deals with measures of performance; Numerical illustrations and sensitivity analysis of the model is performed in section 6; conclusions and future work are provided in section7.
II. MODEL ASSUMPTIONS
1. The arrival to a queuing system (insurance firm) occur, one by one in accordance with a Poisson process with mean rateλ. The inter-arrival times are independently, identically and exponentially distributed with parameterλ.
2. There is a multi-server and the policy claims are processed in parallel. The service times are independently, identically and exponentially distributed with parameter µ such as = for <
. = for ≥ .
3. The capacity of the system is finite, say N.
4. The policy claims are processed in order of their arrival, i.e. the queue discipline is come, First-served.
5. (a) When the system is empty, the customers balk (do not purchase policy) with probability and may purchase with probability p’ (= 1 – q’).
(b) When there is at-least one customer in the system,
the customers balk with a probability 1 − and join
the system with probability . Such kind of balking
is referred to as reverse balking.
6. The policy holders keeping their policies in force after some time, say T may get impatient due to certain reasons and decide to surrender their services before completion (the customer wait up-to certain time T and may leave the system before getting service due to impatience). The reneging times (T) are independently, identically and exponentially distributed with parameterξ.
III. STOCHASTIC MODEL FORMULATION Differential difference equations of the model is given by:
= −λ ′ +µ
; n =0 (1)
=λ ′ − 1− 1 λ + µ + 2µ
; n =1 (2)
= − 1− 1 λ −
− 1 λ + µ + ! + 1 µ " #
2 ≤ < (3)
Infogain Publication (Infogainpublication.com) ISSN: 2454-1311
=λ − % µ + − ξ &
; n = N (5)
IV. STEADY- STATE SOLUTION
In steady state lim*→∞ = , lim*→∞ ′ = 0. Therefore the equations (1) to (5) become:
0 = −λ ′ +µ
; n =0 (6)
0 =λ ′ − 1− 1 λ + µ + 2µ
; n =1 (7)
0 = − 1− 1 λ −
− 1 λ + µ + ! + 1 µ " #
2 ≤ < (8)
0 = − 1− 1 λ −
− 1 λ + µ+ − ξ + % µ + ! + 1 − " ξ& # ≥ (9)
=λ − % µ + − ξ &
; n = N (10)
Steady-state solution of the model is obtained by solving (6) – (10) iteratively. Probability of n customers in the system can be given by:
=
. / / / 0 / / /
12 − 1− 1 ! 465
78
9 ′ , <
2 − 1− 1 ! 4 + : −5 ξ465
;
78 <8;
9 ′ , ≥
2 − 1− 2 ! 4 + : −5 ξ465
;
78 <8;
9 ′ , =
=
Using the normalization condition
1
1
N
n n
P
= =
∑
, we get
+ > + > 8; ;
8
+ = 1
= ?1 + 2 − 1− 1 ! 465
78
9 ′+ 2 − 1 !
− 1 4
5
+ : − ξ4
5 6 ;
78 <8;
9 ′+ 2 − 2 !
− 1 4
5
+ : − ξ4
5 6 ;
78 <8;
Infogain Publication (Infogainpublication.com) ISSN: 2454-1311
V. MEASURES OF PERFORMANCE
5.1 Expected System Size
A<= > 8
A<= > + > 8; ;
8
+
A<= > 2 − 1− 1 ! 465 78
9 ′ ;
8
+ > 2 − 1− 1 ! 4 + : −5 ξ465
;
78 <8;
9 ′ 8;
+ 2 − 1− 2 ! 4 + : −5 ξ465
;
78 <8;
9 ′
5.2 Average rate of reneging
B7= > − ξ 8;
B7= > − 2 − 1− 1 ! 4 + : −5 ξ465
;
78 <8;
9ξ ′CD+ 8;
− E 2 − 1− 2 ! 4 + : −5 ξ465
;
78 <8;
9ξ ′
5.3 Average rate of reverse balking
BF′= G′λ + > 1 − − 1 λ 8
BF′= G′λ + > 1 − −1 2 − 1 !
− 1 478 659 ′ + > 1 − − 1 λ 2 − 1− 1 ! 4 + : −5 ξ465
;
78 <8;
9 ′ 8;
;
8
VI. NUMERICAL ILLUSTRATION
In table -1, numerical results of all measures of performance are presented. Numerical results are obtained for various rates of service.
Table.1:
λ =10, ξ =0.1, q′ =0.8, c=3, N =15 Rate of Service
(µ)
Expected System Size (Ls)
Average Rate of Reneging (Rr)
Average Rate of Reverse Balking (Rb')
3.0 0.58730 0.00074 8.25796
3.1 0.56672 0.00060 8.25999
3.2 0.54789 0.00049 8.26106
3.3 0.53057 0.00040 8.26137
3.4 0.51455 0.00033 8.26110
Infogain Publication (Infogainpublication.com) ISSN: 2454-1311
3.7 0.47274 0.00020 8.25781
3.8 0.46051 0.00017 8.25616
3.9 0.44899 0.00015 8.25431
4.0 0.43811 0.00013 8.25232
4.1 0.42781 0.00011 8.25021
4.2 0.41804 0.00009 8.24801
4.3 0.40875 0.00008 8.24575
4.4 0.39991 0.00007 8.24343
4.5 0.39148 0.00006 8.24108
4.6 0.38343 0.00006 8.23870
4.7 0.37573 0.00005 8.23631
4.8 0.36836 0.00004 8.23392
4.9 0.36129 0.00004 8.23152
5.0 0.35451 0.00003 8.22914
An increasing rate of service ensures a large number of serviced customers leaving the system that leaves a negative impact on system size. This can be observed from table -1. Following figure shows change in system size with increasing rate of service.
Fig.1: Ls Vs 6.1 Sensitivity Analysis
In this section sensitivity analysis of the model is presented. Variations in required measures of performance are observed with respective variable. Results are presented through graphs for better insight
Table.2:
µ =3, ξ =0.1, q′ =0.8, c=3, N =15 Mean Arrival Rate
(λ)
Expected System Size (Ls)
Average Rate of Reneging (Rr)
Average Rate of Reverse Balking (Rb')
5 0.29905 0.00001 4.10322
6 0.35450 0.00003 4.93749
7 0.41003 0.00008 5.77227
8 0.46650 0.00018 6.60563
0.00000 0.10000 0.20000 0.30000 0.40000 0.50000 0.60000 0.70000
Infogain Publication (Infogainpublication.com) ISSN: 2454-1311
9 0.52505 0.00038 7.43524
10 0.58730 0.00074 8.25796
11 0.65557 0.00138 9.06939
12 0.73319 0.00250 9.86309
13 0.82493 0.00436 10.62960
14 0.93730 0.00738 11.35519
15 1.07892 0.01209 12.02055
16 1.26051 0.01922 12.59966
17 1.49435 0.02960 13.05966
18 1.79298 0.04416 13.36238
19 2.16673 0.06371 13.46872
20 2.62057 0.08878 13.34601
21 3.15088 0.11936 12.97729
22 3.74367 0.15476 12.36948
23 4.37553 0.19362 11.55642
24 5.01751 0.23411 10.59444
25 5.64072 0.27431 9.55130
From table -2 it is clearly visible that, with increase in average arrival rate, expected system size increases. An increasing expected system size leads to high confidence of customers with the firm and rate of reverse balking decreases therefore. Due to this more and more arriving customers join the particular firm. The insight can be observed from graph below. On other hand rate of reneging increases gradually as increasing number creates a dense network due to high system size that leads to high level of impatience.
Fig.2:Rb vs λ
Figure -1 clearly states that more and more arrivals cause an increase in system size due to which rate of reverse balking decreases.
0.00000 2.00000 4.00000 6.00000 8.00000 10.00000 12.00000 14.00000 16.00000
5 6 7 8 9 10 11 12 13 14 15 16 17 18 19 20 21 22 23 24 25
Infogain Publication (Infogainpublication.com) ISSN: 2454-1311 Table.3:
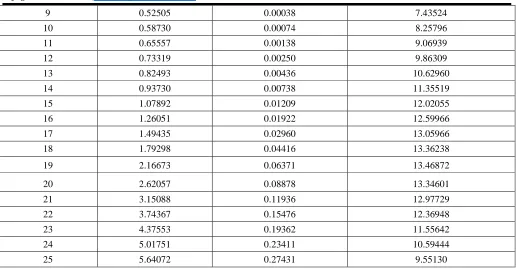
µ =3, λ =2, q′ =0.2, c=3, N =15 Rate of Reneging
(ξ)
Expected System Size (Ls)
Rate of Reneging (Rr)
0.05 0.354518 0.000018
0.06 0.354516 0.000021
0.07 0.354515 0.000024
0.08 0.354513 0.000028
0.09 0.354512 0.000031
0.1 0.354510 0.000035
0.11 0.354509 0.000038
0.12 0.354507 0.000041
0.13 0.354505 0.000045
0.14 0.354504 0.000048
0.15 0.354502 0.000052
From table -3, it can be observe that increasing rate of reneging causes decrease in expected system size and increase in average rate of reneging. This is because increasing rate of reneging states that more and more customers are moving out of the system without completing their service.
Fig.3: E vs Rr
Figure -3 represents increase in average rate of reneging with increase in reneging rate that is obvious.
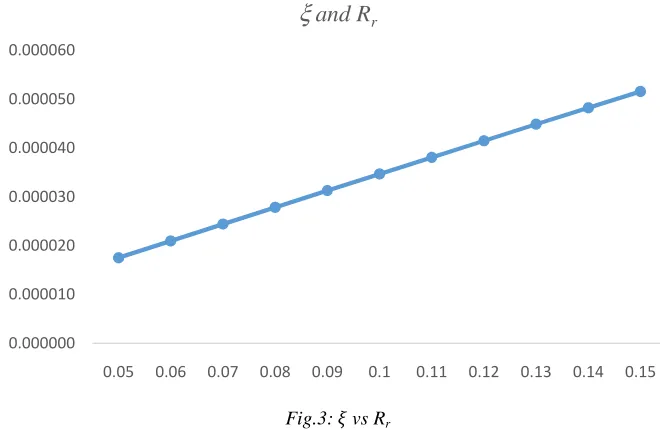
Table.4:
ξ =0.2, µ =3, λ =10, c=3, N =15 Probability of Reverse Balking
(q')
Expected System Size (Ls)
Average Rate of Reverse Balking (Rb')
0.1 1.01918 0.00128
0.000000 0.000010 0.000020 0.000030 0.000040 0.000050 0.000060
0.05 0.06 0.07 0.08 0.09 0.1 0.11 0.12 0.13 0.14 0.15
Infogain Publication (Infogainpublication.com) ISSN: 2454-1311
0.2 0.99310 0.00125
0.3 0.96146 0.00121
0.4 0.92229 0.00116
0.5 0.87253 0.00109
0.6 0.80719 0.00101
0.7 0.71763 0.00090
0.8 0.58730 0.00074
0.9 0.38018 0.00048
1.0 0.00000 0.00000
It can be observed from table -5, that with increase in probability of reverse balking when there were no customers in the system expected system size reduces and at q’ =1 (probability that an arriving customer does not join the system) expected system size drops to zero. And Rb′ = 10, states that all arriving customers reverse balked.
Fig.4: q’ vs Rb’
Figure -4, represents increasing rate of reverse balking w.r.t. increase in probability of reverse balking.
VII. CONCLUSION
In this paper a multi-server Mrkovian queuing system with reverse balking and reneging of customers is developed. Steady-state solution of the model is derived. Necessary measures of performance are obtained. Numerical results are obtained by writing and algorithm in MS Excel and MATLAB. Sensitivity analysis of the model is also performed. Measures of performance with relevant variables are studied.
The results are of immense use for making growth strategies. The model mentioned above can be tailor-made as per need and want for the firms operating in uncertain
business environment. In future cost-profit analysis of the model can be presented with optimization.
REFERENCES
[1] Ancker. Jr., C.J. and Gafarian. A.V., Some queuing
problems with balking and reneging I, Operations Research, 11, 1963, 88–100.
[2] Ancker. Jr., C.J. and Gafarian. A.V., Some queuing
problems with balking and reneging II, Operations Research, 11, 1963b, 928–937.
[3] Haight, F. A., Queuing with balking I, Biometriika, 44, 1957, 360-369.
0.00000 2.00000 4.00000 6.00000 8.00000 10.00000 12.00000
0.1 0.2 0.3 0.4 0.5 0.6 0.7 0.8 0.9 1.0
Infogain Publication (Infogainpublication.com) ISSN: 2454-1311 [4] Haight, F. A., Queuing with reneging, Metrila 2, 1959,
186-197.
[5] Kumar R, Som B K, Design of Service System for Insurance Busniess Facing Customer Impatience using Queuing Theory, OJAS- An International Journal of Research in Management, 2013, 2(1).
[6] Kumar R, Som B K , Optimization and Performance Analysis of Insurance Business – A Queuing Modeling Approach, International Journal of Mathematical Sciences and Engineering Applications, 2013, 7(4). [7] Kumar R, Som B K, Research paper; Profit
Optimization in Insurance Business Facing Customer Impatience, Global Journal of Pure and Applied Mathematics, 9 (1), 2013.
[8] Kumar R, Som B K, Modeling Insurance Business facing Customer Impatience using Queuing Theory, American Journal of Operational Research 3 (2A), 2013
[9] Jain N K, Kumar R, Som B K, An M/M/1/N Queuing System with Reverse Balking, American Journal of
Operational Research, 2014, 4(2), 17-20.
[10] Kumar R, Som B K, An M/M/1/N queuing system with reverse balking and reverse reneging, Advance Modeling and Optimization, 2014, 16(2), 339-353. [11] Kumar R, Som B K, Optimization of M/M/1/N
Feedback Queue with Retention of Reneged Customers, Operations Research and Decisions, 2014,
24(3)
[12] Kumar R, Som B K, Optimization of M/M/1/N queuing system with retention of reneged customers and discouraged arrivals, ISST Journal of Mathematics and Computing Systems, 2013 4(2).
[13] Kumar R, Som B K, Optimizing Service Rate and the Capacity of an M/M/1/N Queuing System with Retention of Reneged Customers, Indian Journal of Industrial and Applied Mathematics, 2014 5(1). [14] Kumar R, Som B K, Optimization of a Service System
Facing Customer Impatience, Presented in ICSSR Sponsored International Conference Titled, Shifting Paradigms in Applied Economics and Management: Course Correction organized by faculty of Management, Shri Mata Vaishno Devi, University, August, 2014.
[15]Kumar R, and Sahrma K S, An M/M/1/N queuing
model with retention of reneged customers and balking, American Journal of Operational Research, 2011, 1(1), 1-5
[16]Kumar R, and Sahrma K S, 2012, A Multi-server
Markovian queuing system with discouraged arrivals
and retention of reneged customers, International Journal of Operations Research, 2012, 9(4), 173 – 184.
[17]Kumar R, and Sahrma K S, A Markovian Feedback
queue with retention of reneged customers and balking, AMO – Advance modeling and optimization, 14(3), 681 – 668.
[18]Kumar R, and Sahrma K S, M/M/c/N queuing system
with renetion of reneged customers, International Journal of Operations Research, 2012a 17(3), 333 – 344.
[19]Som B K, System design and economic analysis of a