http://www.ejfa.info/
Plant Science
REGULAR ARTICLE
Chemical composition of three cultivars of Brazilian beans
Ornella Maria Porcu*and Danniella Xavier
Department of Chemistry, UTFPR/PR Câmpus Pato Branco, Via do Conhecimento Km 1, Bairro Fraron, Pato Branco – PR, Brazil
Abstract
Brazil is one of the largest producers and consumers of beans. The grains of beans fill the main dietary recommendations for good health because it provides essential nutrients. In this study, we selected different varieties of beans as IPR88 Uirapuru (Uirapuru), BRS Jalo (Jalo) and BRS Radiante (Cavalo), and compared the chemical composition of raw beans. The samples (10 Kg of each cultivar) were collected in 2012, February (Jalo and Cavalo: latitude -26º 8’ 46.78’’; longitude -52º 41’ 44.78’’) and March (Uirapuru: latitude -26º 7’ 30.79’’; longitude -52º 38’ 57.31’’) at Pato Branco, Paraná state, Brazil. The physicochemical parameters (lipids, crude protein, fixed mineral residue, humidity, carbohydrates), and minerals content followed the methods described by AOAC. All the analysis was made in triplicate. The mineral composition of the three cultivars studied presented values closed to each other, but IPR88 Uirapuru was distinguished by a greater protein value and a higher amount of calcium and phosphorus. The centesimal composition of the three varieties presented values closed to each other, distinguished BRS Jalo with higher content of fiber. The physical chemical composition showed that they become an excellent raw material for bakery industry and could be used for the development of specific food products.
Key words: Chemical characterization, Beans, Mineral Content, Essential nutrients, Food, Nutritional quality
Introduction
Beans are one of the well-known cultivated plants in Brazil. It is part of the daily diet of the population because its grains are rich in vegetable protein. Important vegetable in human nutrition, beans are widely consumed by fitting the main dietary recommendations for good health, including dietary fiber, starches and other complex carbohydrates, low consumption of fat and sodium (Costa and Rosa, 2010).
Despite of being famous for popular origins, beans have the respect due to their gastronomic possibilities and nutritional qualities. A source of iron, vitamin B, magnesium, potassium and folic acid, beans, when cooked with other ingredients that appraise its flavor conquer any palate (Bassinello, 2009).
There are a large number of varieties of beans. The common bean (Phaseolus vulgaris L.), for
example, is classified by its color: black, mulatto, white, yellow, red, purple, brindle, among others (Fernandes et al., 2012; Paiva et al., 2012).
Beans are very important for human consumption because of its nutrient sources, such as energy and protein. Besides other nutrients such as minerals, vitamins and some other functional known and little studied substances that will certainly bring great importance when discovered (Bassinello, 2009).
In its composition, beans have greater percentage of carbohydrates the main one is the starch. When referring to protein, its content is around 20%, representing more than double the protein found in cereals. The protein of beans is rich in essential amino acid lysine and low in methionine and cysteine. Cereals are low in lysine and high in sulfur amino acids (methionine and cysteine), what makes the traditional Brazilian diet, rice and beans, complete when thinking about essential amino acids (Bassinello, 2009; Borém et al., 2006).
The fatty acid composition of lipids in the common bean is quite variable, predominantly the
Received 03 April 2014; Revised 25 July 2014; Accepted 29 July 2014; Published Online 16 September 2014
*Corresponding Author Ornella Maria Porcu
Department of Chemistry, UTFPR/PR Câmpus Pato Branco, Via do Conhecimento Km 1, Bairro Fraron, Pato Branco – PR, Brazil
vitamins found in beans, the most important are the B complex, especially riboflavin, niacin and pantothenic acid (Yamaguishi, 2008; Rotman, 1984).
In the mineral composition of beans, there is greater value to potassium, phosphorus, iron, calcium, copper, zinc and magnesium, among others. The low amount of sodium found in beans receives great importance and adds great nutritional benefit to this vegetable. Studies with white, black and carioca beans samples revealed that the bioavailability of calcium is nutritionally significant, since a diet low in this mineral leads to early osteoporosis (Ferreira, 2010).
Considering the variation of nutrients and features from one variety of beans to another, this study aimed at characterizing the chemical composition of three different beans cultivars.
Materials and Methods Samples
Three different cultivars of beans were collected for analyzes. The BRS Jalo (Jalo) cultivar that has big cream-uniform colored grains; the BRS Radiant (Cavalo) that has great colorful grains. The samples were collected in early February 2012 (latitude -26°8 '46, 78'' and longitude -52 ° 41 '44.78''), and at the end of February of the year 2012.The IPR88 Uirapuru (Uirapuru) cultivar, which has smaller black colored grains, provided by the Agronomic Institute of Paraná (IAPAR), harvested in late February 2012 (latitude -26 ° 7 '30.79'' and longitude -52° 38' 57, 31'') and collected in early March of 2012, all in the municipal district of Pato Branco – PR.
Centesimal composition
Determining the chemical composition of the beans, the whole grain was used, being determined for the three different cultivars.
Through analytical determinations it was possible to quantify the humidity (920.151 of AOAC, 1997), content of lipids (948.22 of AOAC, 1997), protein (920.152 of AOAC, 1997) and fixed mineral residue (940.26 of AOAC, 1997) of food. The carbohydrate content was determined by difference thus closing the centesimal compositions. All analyzes were performed in triplicate.
The analyzed mineral profile for the three varieties of beans comprised the following minerals: sodium, iron, zinc, copper, magnesium, calcium, phosphorus, nickel, chromium and cadmium. Atomic absorption spectrometer (Analytic Jena, Modelo Nova A300) according to the n. 999.10 of AOAC (2000) method carried out the determination.
Color
The color analyses were determined directly in colorimeter Minolta Chroma Meter CR-400b, in quadruplicate. To that end, we used aliquots of the homogeneous sample and placed on the equipment. Results are interpreted by the CIELAB system, using the coordinates L*, a*, b*, ∆L*, ∆a*, ∆b* e ∆E.
Water activity, pH and Density
The reading of water activity (aw) happened in the Aqua Lab brand4TE model, version 4 device. For that, the sample, capsuled and placed in the water activity measurer where the vapor equilibrium happens, with the lid chamber closed. An infrared beam was emitted, thus determining the dew point of the sample, which is then translated into water activity.
For the determination of the pH of the samples, it was used a potentiometric device according to procedure described by Zimmermann et al. (2009) and n. 981.12 of AOAC (1997). The whole beans were ground in a blender, further diluted in 10 g of sample in 50 mL of distilled water. This mixture was homogenized on a magnetic stirrer for five minutes and left static for 10 minutes for sedimentation of the solid material. After this period, the pH was directly measured on the supernatant.
The density of the beans was determined according to Lanaro et al. (2011), which used a 500 mL graduated cylinder containing 250 mL of distilled water and a semi-analytical weighting machine (± 0.01 g). To this cylinder, 150 g of beans were added. The volume of water displaced by the beans was used to obtain the density through weight / volume ratio.
Results and Discussion
Figure 1.Three different cultivars of beans: (A) Jalo; (B) Cavalo; (C) Uirapuru.
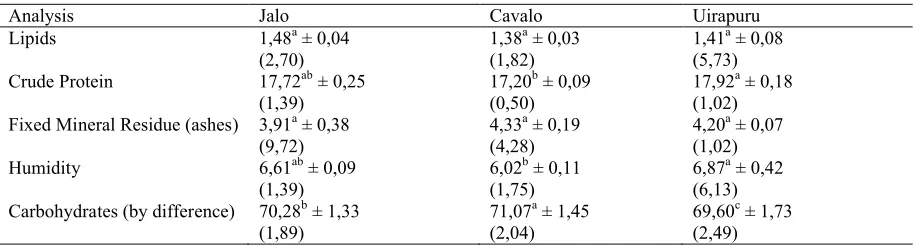
Table 1. Centesimal Composition of the three cultivars of beans.
Analysis Jalo Cavalo Uirapuru
Lipids 1,48a± 0,04
(2,70) 1,38
a± 0,03
(1,82) 1,41
a± 0,08 (5,73) Crude Protein 17,72ab± 0,25
(1,39) 17,20
b ± 0,09
(0,50) 17,92
a ± 0,18 (1,02) Fixed Mineral Residue (ashes) 3,91a± 0,38
(9,72) 4,33
a± 0,19
(4,28) 4,20
a± 0,07 (1,02)
Humidity 6,61ab± 0,09
(1,39)
6,02b± 0,11 (1,75)
6,87a± 0,42 (6,13) Carbohydrates (by difference) 70,28b± 1,33
(1,89) 71,07
a± 1,45
(2,04) 69,60
c± 1,73 (2,49)
Numbers presented as the average and standard deviation of three replicates, followed by the coefficient of variation. Notes: The averages followed by the same letter in rows are not statistically different from each other.
Tukey test applied at 5% level, using software version 7.6 beta Assistat (2011).
The obtained lipid content was close for each bean cultivar, with no statistical difference among the found numbers. The beans of the three cultivars showed a lower number of lipids than the one Yamaguishi (2008) found for black beans (1.82%) and Martinez (2011) found for the Carioca beans (1.61%). However, Pereira (2008) found lower numbers for other bean varieties, from 0.86 to 1.19% of lipids. Briguide (2002) also found a low lipid number (1.20%) for Carioca bean and Morgano et al. (1999) for black beans (1.40%). These comparisons highlight that the common bean (Phaseolus vulgaris L.) can vary the lipid content
for each different variety and cultivar, and confirm that the numbers found are within the limits found in the literature.
The Uirapuru bean cultivar presented higher protein level, and this difference was statistically significant in relation to Cavalo bean, which showed lower protein value. The numbers found for crude protein are under the majority found in the literature. Ribeiro et al. (2005) found for a cultivar of black beans 23.87% and Mesquita et al. (2006) numbers above 22.00%. However, Pereira (2008) determined values from 17.78 to 19.23% protein in the analyzed beans, which is close to the numbers
found for the three cultivars studied this in this research.
This difference in the amount of protein of beans can be attributed to bean cultivation factors (climate, soil, humidity), because the protein value is heavily influenced, since the three bean varieties studied were grown in a season with high temperatures and different climatic conditions.
To the numbers found for fixed mineral residue (ashes) there is a proximity to those found in the literature, values are from 3.80 to 4.48% (Mesquita et al., 2006). Briguide (2002) found for the common bean a number very close (4.40 %) to that found for Cavalo beans. The numbers of ash for the three cultivars did not differ significantly according to Tukey's test.
microorganisms can develop, resulting in less food deterioration. The time of planting and harvesting of these beans cultivars can be partially identified as a determining factor, due to the high temperature and low humidity in the soil.
The main carbohydrate found in beans is the starch. The three beans cultivars showed high levels of carbohydrates, which constitute the largest part of the composition of this food. However, among the three cultivars evaluated, the carbohydrate content in the Cavalo cultivar is superior to the others and shows significant difference from Jalo and Uirapuru cultivars.
Minerals
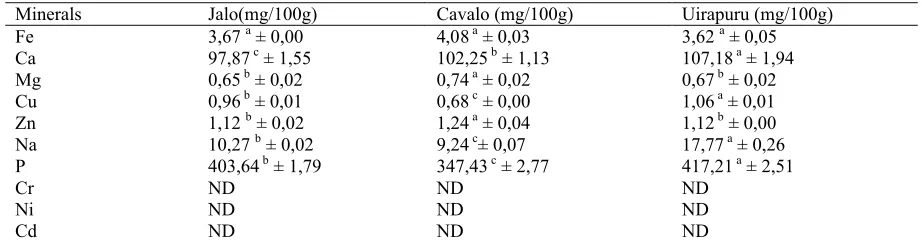
The concentration of mineral elements (mg/100g) analyzed from the three bean cultivars presented in Table 2.
The iron concentration ranged from 3.62 to 4.08 mg/100 g of sample in the studied cultivars. The Cavalo bean showed the highest content of iron (4.08 mg/100 g), however, it did not differ from other samples at 5% probability. Generally the numbers found for the element iron in beans are higher or equal the ones found in this study, and the IBGE says that the dry bean (Phaseolus vulgaris)
contains approximately 7.6 mg of iron per 100 g of sample (Pires et al., 2005).
In relation to the element calcium the numbers ranged from 97.87 to 107.18 (mg/100 g of beans). The Uirapuru variety showed a higher content of this element, significantly differing (p <0.05) from the other samples. Jalo cultivar offered lower calcium content. The values are very close to those presented in the Brazilian Table of Food Composition (TACO) (2011) for the varieties Jalo,
respectively, 98, 111 and 111 mg of calcium per 100 g of sample.
The values found for the magnesium contents were 0.65 to 0.74 (mg/100 g). The Cavalo variety showed higher content (0.74 mg/100 g) of this element, differing from the other two cultivars.
For copper, the numbers obtained ranged from 0.68 to 1.06 mg/100 g of beans. The Uirapuru cultivar presented a higher number of copper (1.06 mg/100 g) and was significantly different (p <0.05) from the other two, considering the Cavalo cultivar with smaller amount of copper (0.68 mg/100 g). Philippi (2002) shows amounts of 0.6 and 0.7 mg of copper to black beans and white beans, respectively. Taco (2011) shows amounts of 0.83 to 0.95 mg of calcium, close to the ones shown in Table 2.
Zinc concentration ranged from 1.12 (Jalo and Uirapuru) and 1.24 mg/100 g of sample (Cavalo), considering that the Cavalo cultivar differed from the other two by a higher content of that element at 5% probability. The values found are listed below by Philippi (2002), in which the black and white beans zinc content is 2.8 mg.
The level of sodium ranged from 9.24 to 17.77 (mg/100 g). The Uirapuru cultivar showed the highest sodium (17.77 mg/100 g) and the Cavalo cultivar showed the lowest number (9.24 mg/100 g), all cultivars showed statistical difference at 5% of probability. The numbers found are really below those determined by Morgano, Queiroz and Ferreira (1999), which for the black beans got 40 mg/100 g of the element sodium. However, the found numbers are close to those cited in TACO (2011) (14-25 mg) and cited by Philippi (2002) (12 mg).
Table 2.Mineral Composition of the different beans cultivars.
Minerals Jalo(mg/100g) Cavalo (mg/100g) Uirapuru (mg/100g)
Fe 3,67a± 0,00 4,08a± 0,03 3,62a± 0,05
Ca 97,87c± 1,55 102,25b± 1,13 107,18a± 1,94
Mg 0,65b± 0,02 0,74a± 0,02 0,67b± 0,02
Cu 0,96b± 0,01 0,68c± 0,00 1,06a± 0,01
Zn 1,12b± 0,02 1,24a± 0,04 1,12b± 0,00
Na 10,27b± 0,02 9,24c± 0,07 17,77a± 0,26
P 403,64b± 1,79 347,43c± 2,77 417,21a± 2,51
Cr ND ND ND
Ni ND ND ND
Cd ND ND ND
(*)ND - not detected. Data are average numbers obtained from triplicate determination with standard deviation. Note: The averages followed by the same letter in rows are not statistically different from each other.
Phosphorus values were 347.43 to 417.21 (mg/100 g), and the Uirapuru cultivar was the one with the highest phosphorus values and was significantly different (p <0.05) from other cultivars, where Cavalo the cultivar showed lower content of that element. On the Brazilian food composition table (TACO) (2011), the values presented for phosphorus are 427 mg/100 g for Jalo beans, 471 mg/100 g for the black beans and 335 mg/100 g for Brindle beans. Morgano et al. (1999) also found similar value to our study for the black beans (370 mg/100 g).
From the three varieties analyzed, Uirapuru variety showed the highest values for the minerals calcium (107.18 ± 1.94 mg/100 g), copper (1.06 ± 0.01 mg/100 g), sodium ((17.77 ± 0 26 mg/100 g) and phosphorus (417.21 ± 2.51 mg/100g). Levels of chromium, nickel and cadmium were not detected, that is, their levels are below 0.001 mg/100 g.
Observing the values of minerals found in beans, it is clear that this food is able to supply a large portion of the daily requirements of minerals in food revealing the importance of its consumption.
Minerals are responsible for various functions of the human organism, such as the enzymatic regulation, the maintenance of the osmotic and acid-base process, facilitation of transfer of substances through cell membranes to nerve and muscle stimulation. The main sources of minerals are plant foods, considering that calcium and iron are the most important minerals for humans, hence the importance of the consumption of beans, since
this food is a good source of these minerals (Fiorini, 2008).
Color
Analysis of skin color of the grains for each bean cultivar (Table 3)
The obtained results were interpreted through CIELAB space, where three axes are noticed. The parameter L * represents the brightness of the sample, which the Uirapuru cultivar showed statistically significant difference from the other two cultivars. The value obtained for the Uirapuru cultivar suggests a color similar to black, considering that L * equals zero means black. However, Jalo and Cavalo cultivars showed an average value between white (100) and Black (50).
When analyzed the chromaticity a*parameter, the three cultivars showed statistical difference. This parameter suggests positive values of a * for red color samples, as Cavalo and Jalo values are positive, but low, it means a slight red coloration in these samples. The Uirapuru cultivar showed negative value of a *, resulting in an approximation of the green color.
The parameter chromaticity b* showed significant difference for all samples, all values were positive and samples tended to yellow coloration for Uirapuru cultivar showing only a small trend. None of the three cultivars showed a tendency to the color blue, where b * values would be negative.
Table 3.Color of the three different beans cultivars.
Parameters cv. Jalo cv. Cavalo cv. Uirapuru
L* 52,30a± 01,74
(3,32) 50,38
a± 0,42
(0,82) 12,26
b± 01,87 (15,25) a* 06,88b± 00,35
(5,05) 10,42
a± 0,58
(5,59) -01,48
c± 00,08 (5,60) b* 29,15a± 00,39
(1,35)
25,07b± 01,60 (6,34)
02,69c± 00,26 (9,71)
∆ L -58,41b± 01,74
(2,97) -60,34
b± 00,42
(0,69) -98,43
a± 01,84 (1,87)
∆a 11,05b± 00,35
(3,14) 14,59
a± 00,58
(3,99) 02,70
c± 0,09 (3,29)
∆ b 13,35a± 00,40
(2,98) 09,28
b± 01,60
(17,13) -13,10
c± 00,26 (1,99)
∆ E 60,93b± 01,65
(2,71) 62,78
b± 00,68
(1,09) 99,34
a± 1,82 (1,84)
Data are average numbers obtained from triplicate determination with standard deviation variation coefficient. Note: The averages followed by the same letter in rows are not statistically different from each other.
Analysis Jalo Cavalo Uirapuru
Aw 0,560b± 0,0041
(0,73) 0,601
a± 0,0003
(0,05) 0,542
c± 0,0017 (0,31)
pH 6,64a± 0,09
(1,30)
6,72a± 0,06 (0,90)
6,58a± 0,04 (0,55)
Density(g.mL-1)* 1,12 1,20 1,09
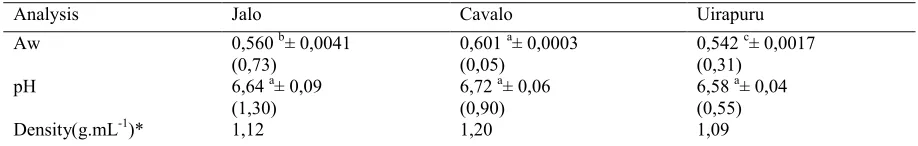
Data are average numbers obtained from triplicate determination with standard deviation variation coefficient. *Analysis not made in triplicate.
Note: The averages followed by the same letter in rows are not statistically different from each other. Tukey test applied at 5% level, using software version 7.6 beta Assistat (2011).
For beans the L* value has great importance, as it means the clarity of the grain. When analyzing the color of Carioca beans, for instance, high values, above 55, is wanted, thus demonstrating beans freshly harvested which have good cooking. However, for black beans, the desired clarity is low, less than 22, which is a good quality bean without purplish grains and good cooking (Ribeiro, 2008). Thus, the Cavalo and Jalo cultivars have results for L * very close to 55, suggesting a good grain quality. The Uirapuru cultivar, which is black, has value below 22, confirming its good quality.
Some physical and chemical parameters to characterize the three bean cultivars were also analyzed, and among them, water activity (aw), pH and density (Table 4).
According to Kowalski et al. (2001), microbial proliferation begins in values from 0.650, and values higher than 0.780 represent a conducive environment to the development of fungi. Thus, the three bean cultivars analyzed showed values below the risk of development of microorganisms. There was statistical difference in the three cultivars, which can be associated to the difference in size of grains of each cultivar.
Lanaro et al. (2011) analyzed the water activity of the black-eyed beans and obtained high values (0.81 to 0.94), which may be a risk of degradation of the beans.
The water activity analysis is the measure of free water in the product. Analyzing the amount of water present in food is extremely important, since the amount of water present in it can inhibit or facilitate microbial growth (Kowalski et al., 2001). The storage temperature of the beans is an essential factor to ensure its quality, because it controls the rate of aw, whereas at low temperatures, the aw of
the product decreases, even when the humidity is high, which inhibits the growth of microorganisms and insect pests (Rigueira et al., 2009).
When beans are stored in inadequate conditions
some chemical and enzymatic reactions leading to acidification of the grain tissue. That leads to a phenomenon called "hard-to-cook" (HTC), when grains become hardened and resistant to cooking (Zimmermann et al., 2009). It becomes clear the relevance of the measurement of pH of beans, because through this process it is possible to know whether the purchased beans were stored under appropriate conditions, thereby maintaining grain quality.
The three analyzed cultivars showed values close to neutral pH (7.0), being slightly acidic, which showed no statistical difference among them. The values obtained are classified as excellent, and it is important to consider that the samples were appropriately stored. Zimmermann et al. (2009) examined beans and got pH values slightly below those obtained in this study, and for the Carioca variety an average of 6.37 was obtained and for the black variety a 6.30 average.
Ribeiro and Miyagui (2005) found a pH of 6.47 for the common black beans. They say that a pH close to 6.4 promotes protein denaturation and degradation, elimination and dissolution of the pectin during cooking. Thus, cell separation occurs, and consequently the gelatinization of starch granules and beans become soft. If the bean grains are aged or inappropriately stored, pH becomes acidic, close to 5.5, protein denaturation occurs during storage. During cooking happens the clotting, restricting the jellifying of starch what makes grains hardened.
Density is a physical property that when connected to beans may indicate the hydration capacity of the grain. A higher density indicates a low hydration capacity of the grains, which may lead to a low softness of beans (Coelho et al., 2007).
Silva et al. (2010) and Lanaroet al. (2011) determined the density of different varieties of beans, obtaining values from 1.11 to 1.19 g.mL-1,
and 1.05 to 1.19 g.mL-1, all very close to those
determined in this study. However, Coelho et al. (2007) obtained higher values (1.240 to 1.268 g.mL-1) for some varieties of beans, values that may
impair the quality of the product.
Conclusion
Among the three cultivars evaluated, the Cavalo cultivar was the one with the lowest lipid content and the highest ash content, and it has in its composition, the highest content of iron, magnesium and zinc.
The Uirapuru cultivar excelled on the highest crude protein and lower carbohydrate content, and regarding mineral, it showed an increased amount of calcium, copper and phosphorus. This cultivar was also showed the best value in lightness of grain, the lowest water activity, as well as the lowest density and pH closer to 6.4. Assessments are required for a good quality of product storage.
However, the three studied cultivars showed a rich composition, considering that the choice of purchasing is made by the consumer, who ponders many other requirements, besides the nutritional content.
Acknowledgements
The authors thank CAPES for the financial support.
References
AOAC. 1997. Association of Official Analytical Chemists. Official Methods of Analysis, 16 Ed., Virginia.
Bassinello, P. Z. 2009. Qualidade Nutricional, Funcional e Tecnoló gica do Feijã o. In: Kluthcouski, João; Stone, Luís F.; Aidar, Homero. Fundamentos para uma agricultura sustentável, com ênfase na cultura do feijoeiro. Santo Antônio de Goiás: Embrapa Arroz e Feijã o. Cap. 22.
Borém, A., Carneiro, J. E. and Cultura S. A. 2006. In: Vieira, Clibas; Paula Jú nior, Trazilbo J. de; Borém, Aluízio. Feijão.2 ed. Viçosa: Ed. UFV,. Cap. 1.
Briguide, P. 2002. Disponibilidade de ferro em grãos de feijão comum (Phaseolus vulgarisL.)
irradiados. 2002. 71 f. Dissertação. (Mestrado em Ciências) – Escola Superior de Agricultura “Luiz de Queiroz” da Universidade de São Paulo, Piracicaba.
Coelho, C. M. M., M. Zílio, D. Piazzoli, F. L. Francine, C. A. de Souza and R. L. da C. Bortoluzzi. 2007. Influência das características morfoló gicas e físicas dos grãos de feijão (PhaseolusvulgarisL.) na sua capacidade de
hidratação e cocção. Revista Brasileira de Biociências, Porto Alegre 5(2):105.
Costa, N. M. B. and C. de O. B. Rosa. 2010. Alimentos funcionais: componentes bioativos e efeitos fisioló gicos. Rio de Janeiro: Rubio. Cunniff, P. (Ed.) 1998. Official Methods of
Analysis of the Association of Official Analytical Chemists – AOAC 16 edicão, Arlingnton, Virginia.
Fernandes, S. B., C. A., Silva, Â . N. G. E. L. A. De Fátima, B. Abreu and M. A. P. Ramalho. 2012. Quantificação dos teores de proteína e minerais em sementes de feijão comum de diferentes cores. In: Embrapa Arroz e Feijão-Artigo em anais de congresso (ALICE). In: Congresso Nacional De Pesquisa De Feijão, 10, 2011, Goiânia. Anais. Goiânia: Embrapa Arroz e Feijã o, 2011.
Ferreira, A. C. P. 2010. Feijã o pré-cozido irradiado com raios gama do Cobalto-60: uma alternativa de consumo. 2010. 62 f. Tese. (Doutorado em Ciências) – Centro de Energia Nuclear na Agricultura da Universidade de São Paulo, Piracicaba.
Fiorini, L. S. 2008. A importância dos minerais para a saú de humana. Food Ingredientes Brasil, São Paulo, n.4.
Kowalski, C. H., C. A. Mallmann, M. Perin and V. G. da. Silveira. 2001. Determinação de atividade de água em cereais e oleaginosas procedentes do sul do Brasil. In: Jornada Acadêmica Integrada da UFSM, 16, Santa Maria. Disponível em: www.lamic.ufsm.br/ papers/25a.pdf. Acesso em: 01 mar. 2013. Lanaro, N., L. G. Bajay, M. P. de. Queiroz Victor,
et al. 2011. Determinação de propriedades físicas do feijã o fradinho. Revista Brasileira de Produtos Agroindustriais,Campina Grande, v.13, n.1.
(Phaseolus vulgaris L.): composição química
e digestibilidadeprotéica. Ciência e Agrotecnologia, Lavras, v. 31, n. 4, jul./ago. Morgano, M. A., S. D. N. D. Queiroz and M. M. C.
Ferreira. 1999. Aplicação da Análise Explorató ria na Diferenciação de Vegetais. Brazilian J. Food Technol. 2(1-2):73-79. Paiva, J. C. B. de. et al. 2012. Variabilidade das
características morfoló gicas das sementes de acessos tradicionais de feijão comum. Embrapa, Brasília.
Pereira, L. L. S. 2008. Estudo comparativo entre faseolamina comercial e farinha de feijão como perspectiva ao tratamento da obesidade e do diabetes mellitus tipo 2. 72 f. Dissertação (Mestrado em Agroquímica) – Universidade Federal de Lavras, Lavras.
Philippi, S. T. 2002. Tabela de Composição de Alimentos: suporte para decisão nutricional. 2ª ed. São Paulo: Coronário.
Pires, C. V. et al. 2005. Composição físico-química de diferentes cultivares de feijão (Phaseolus vulgaris L.). Alimentos e Nutrição,
Araraquara, v. 16, n. 2.
Ribeiro, H. J. S. de S. et al. 2005. Propriedades físicas e químicas de feijão comum preto, cultivar Iapar 44, apó s envelhecimento acelerado. Ciência e Tecnologia de Alimentos, Campinas, v. 25.
Ribeiro, N. D., L. Storck and N. L. Poersch. 2008. Classificação de lotes comerciais de feijão por meio da claridade do tegumento dos grãos. Ciência Rural 38(7):2042-2045.
Volk Marcus. 2009. Avaliação da qualidade do feijão armazenado em ambiente refrigerado. Alimentos e Nutrição, Araraquara, 20:4.
Rotman, F. 1984. A cura popular pela comida. 4ª ed. Rio de Janeiro: Record.
Silva, A. G., L. C., Rocha and S. G. Canniatti Brazaca. 2010. Physico-chemical characterization, protein digestibility and antioxidant activity of common bean (Phaseolus vulgaris L.). Aliment. Nutr.
Araraq. 20(4):591-598.
Taco. 2011. Tabela Brasileira de Composição de Alimentos. Nú cleo de Estudos e Pesquisas em Alimentação, Universidade Estadual de Campinas, 4 ed., Campinas.
Yamaguishi, C. T. 2008. Processo biotecnoló gico para a produção de feijão desidratado com baixo teor de oligossacarídeos da família rafinose. 148 f. Dissertação (Mestrado em Processos Biotecnoló gicos) – Setor de Tecnologia, Universidade Federal do Paraná, Curitiba.