https://dx.doi.org/10.22161/ijaems.5.5.2 ISSN: 2454-1311
Development of Computer Models for Simulating
the Optimum Design Parameters of a Passive
Solar Heating Chicken Brooder System
Mulindi S. A., Kanali C., Kituu G., Ondimu S. and Mutwiwa U.
Department of Agricultural and Processing Engineering , Jomo Kenyatta University of Agriculture and Technology, Nairobi
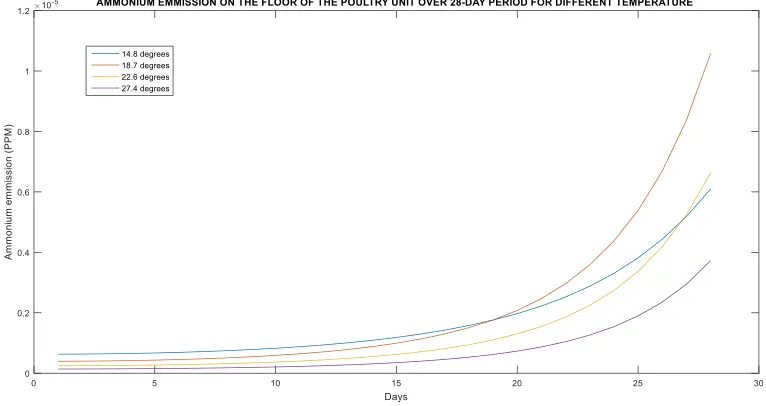
Abstract— Brooding refers to early periods of growth when chick s require supplementary heat to maintain their normal body temperature. Generally, chick s k ept in environmental temperatures outside their comfort zone suffer low growth and high mortality rates. Solar energy has a regular daily and annual cycle, and is unavailable during periods of bad weather. Hence requires special storage and distribution of the energy different from the utilization of conventional energy sources. In this study computer models were developed for simulating internal broo der envelope brooding Temperatures and ammonia gas concentration in ppm. Further, analysis was carried out to determine the influence of trombe wall thick ness on the variation of hourly internal brooder temperatures for various months of the year. The trombe wall thick ness were set at 100,150, 200, 250 and 300mm and hourly temperatures simulated using Matlab computer program. The wall thick ness of 100mm and 150 mm yielded maximum brooding space temperature of 36.50C and 35.30C respectively. The resultant brooder temperatures were above the optimal brooding temperature range of 340C for day one and 21 to 240C for the 28th day of brooding. However, the lowest brooder temperatures attained for 100mm and 150mm wall thick ness were 29.50C and 30.80C respectively. The wall thick ness of 300mm yielded temperature range of 25.70C to 280C.From this study it is deduced that the wall thick ness of 100 and 150mm are suitable for development of a chick s’ brooder. Though, supplementary source of heat will be required to k eep the birds comfortable for the first one week of brooding period. The brooder pH was set at 10 and the ammonia concentration simulated for 28 days at brooding floor temperatures of 14.80C, 18.70C, 22.60C and 27.40C.The results were that the ammonia concentration increased exponentially from day one to the 28th day of brooding for all the floor temperatures. The highest emission of ammonia was recorded at the temperature of 14.80C for the first fifteen days; but after the 15th day the temperature of 18.70C recorded the highest emission of
ammonia. Conversely, the temperature of 27.40C yielded the lowest ammonia emission. Therefore, it is essential in the design of brooders to have provision for facilitating
removal of birds’ droppings to minimize emission of the
ammonia gas from the floor of the brooder.
Keywords— Ammonia concentration, Brooder, modeling, optimal brooding temperature, pH and simulation.
I. INTRODUCTION
Chick brooding refers to the period from day old, when chicks are hatched to age of about 28 days when the young birds are unable to maintain their normal body temperature without the aid of supplementary heat. Chicks exposed to temperatures below 340C on the first day and below 21 0C
by day 28 of life makes the young birds uncomfortable, hence feed and water intake required for good s tart are lowered. The consequences being poor feed conversion, high disease incidences, reduced growth rate and in extreme cases high mortality rate. According to [1], 75% of poultry population in Kenya consists of indigenous chicken kept under a free range system in small flocks of less than 30 birds by over 90% of the rural households. Despite their numbers, indigenous chicken have low productivity and only contribute 60% and 50% of the chicken meat and eggs respectively, consumed in the country.
https://dx.doi.org/10.22161/ijaems.5.5.2 ISSN: 2454-1311
than the optimum [4], [5].Temperature on the floor, at the edge of the heat source, should be 32 to 35°C for the first week. As long as the temperature at the edge of the heat lamp or brooder stove is this warm, the air temperature 2m away from the heat source can be as low as 28°C. If you cannot maintain a hot point next to the heat lamp, an average air temperature of 30 to 31°C is suggested. The temperature should be reduced by 3°C (5°F) per week, until the room temperature of 20ºC is reached [6].
Artificial chick brooders exist of every conceivable type and size, heated by oil, coal, wood, water, gas and electricity. With the exception of the electric brooders, all other methods are difficult to operate with local skills in rural areas. They do not maintain constant brooding temperature, require foreign currency for importation and are expensive for flock size of less than 1000 chicks . On the contrary electric brooders are economically feasible, could safely and easily be constructed and maintain the desired constant brooding temperature. However, it is difficult to adopt electric brooders by the African rural household poultry producers owing to the unavailability of electric power, numbers of chicks to be raised and remote locations of the farm sites [7].
As chicks grow and mature, the need for supplemental heat is less important whereas, the need for adequate space becomes critical. The initial brooding temperature below the hover should be 35°C at 5 cm from the floor and this initial brooding temperature should be reduced by approximately 3°C per week until 21°C is reached [8]. According to [9], thriving of poultry production in developing countries where electricity supply has remained inadequate and unreliable, therefore, alternative methods of meeting the energy needs in agriculture and in the poultry industry specifically have to be evolved.
Large-scale utilization of solar energy is fraught with problems due to the low flux density of solar radiation and intermittency. This necessitates the use of large surfaces to collect solar energy. Solar energy has a regular daily and regular annual cycle, and is unavailable during periods of bad weather. These daily and seasonal variations in irradiance, exacerbated by variations due to weather, introduce special problems in storage and distribution of this energy which are entirely different from problems involved in the utilization of conventional energy so urces as declared by [10] and [11].
The objectives of this study were to develop computer models for simulating the solar energy harnessedby trombe wall for brooding chicks and the performance of the brooding system. Secondly, optimization of the design
parameters and evaluation of the performance of the solar heating passive brooder system.
The brooding environment conditions can be predicted by conducting experiments or by using simulation models. Simulation methods provide a quick, less expensive, more flexible and repeatable way compared with the experimental predictions [12].Further, simulation and modeling method is a safe way of conducting studies on animals like chicks to minimize the danger of exposing the young birds to adverse conditions which could lead to high mortalityrates. The results of this study will be used to design and construct solar energy powered brooding systems for further research on use of solar energy for brooding while minimizing the number of trials.
II. METHODOLOGY
This study was carried by modeling and simulation. The brooding space was powered by solar energy collected by the trombe wall and rock storage. The air and heat flow to the brooding room influences the relative humidity, temperature and air quality of the brooding envelope.
2.1 Sources of heat energy to the brooder
The simulations were accomplished using Matlab software with modeling equations and design parameters.Hence the dynamic brooding room temperature (Tbr) is expressed as shown in equation 2.1.Since the ambient temperature varies according to the time of the day, the internal temperature of the brooder will also vary with the time of the day. Therefore, the energy balance equation of the brooder can be expressed:
𝜌𝑎𝑉𝑏𝑟𝐶𝑠ℎ 𝑑𝑇𝑏𝑟
𝑑𝑡 = 𝑄𝑡𝑤+ 𝑄𝑟𝑠+ 𝑄𝑏𝑠+ 𝑄𝑏𝑙− 𝑄𝑣𝑙− 𝑄𝑓𝑙 − 𝑄𝑐𝑙 …………2.1
The following were sources of heat gain to the chicks brooding room: Heat gain from the trombe wall (Qtw), heat
gain from the rock storage (Qrs), Sensible heat generated by the chicks (Qbs), latent heat generated by the chicks (Qbl). While the heat losses were: Heat loss due to ventilation (Qvl), heat loss through the floor (Qfl), heat loss through
ceiling (Qcl).The energy gain or loss of the brooding room is
influenced by the internal volume (Vbr) of the brooder, specific heat capacity (Csh) and the density (ρa) of the air enclosed in the room.
The energy from the trombe wall is given by:
Qtw=hcrAtw(Tbs–Trm)………. ……….2.2 The heat gain from the trombe wall is influenced by surface area of trombe wall surface(Atw), heat capacity of the wall material, the back wall surface temperature(Tbs)and the brooding room temperature (Trm).
https://dx.doi.org/10.22161/ijaems.5.5.2 ISSN: 2454-1311
Qrs =hcA(Tds – Trm)……….2.3
Where is (hc) is duct material specific heat capacity,(Tds)is the conduct surface temperature, (A) surface area of the duct from the rock storage, and (Trm)brooding room temperature. The sensible heat generated by the birds due to respiration is given by:
Qbs =7.97LW0.75 - 5.87T1 +2.3RH………….. (2.4)
Where(Qbs) sensible heat generated by the birds, (LW)live weight of the birds (T1)body temperature (RH) brooding room relative humidity
While latent heat produced by the chicks is; Qbl= 430LW0.75 + 11.3T1
+4.45RH………... (2.5) (Qbl) is the latent heat released to brooding room as the birds cool their bodies.
The heat losses include the following:
Ventilation losses through the openings between the brooder and the outside environment are given by:
Qvl=mcp (Trm – To)…… ………2.6
(Qvl) heat energy lost due to ventilation.(m) Mass of air leaving the brooding room, brooding (Trm) room temperature, (To) the ambient temperature, (cp) specific heat capacity of the air
Heat losses through the flour;
Qfl = AflUfl(Trm-Tfl)………...……..2.7
(Qfl)Heat energy lost through the flour of the brooder, (Afl)surface area of the brooder floor,(Tfl)the floor temperature and(Trm) the brooding space temperature Heat loss through the ceiling;
Qcl =AfcUfc(Trm- Tfc)………..2.8
(Qcl )heat energy lost through the ceiling(Afc)surface area of the ceiling, (Tfc)Temperature on the surface of the ceiling
Studies by [13] show that, the overall ventilation heat exchange of a building is the total of the air flows at all the
outlets or inlets. The overall ventilation heat exchange is given by Qvl = mcp(Trm– To )
2.2 Brooding Envelope Air Quality
This study confined the quality of brooding room air on the amount of ammonia gas emitted in the brooding envelope. The ammonia gas emitted was predicted by;
𝐸 = 𝑒(−6.5 +0.12(𝑇)+0.6𝑃ℎ+0.003 (𝑑𝑎𝑦)−0.0043(𝑑𝑎𝑦)2)….. 2.9
2.3 Determination of wall thickness that stores adequate energy for optimum brooder temperatures
The wall thickness wereset at four levels, thus, 100mm, 150mm, 225mm and 300mm. These are the sizes of bricks commonly used for construction in Kenya, Secondly,the energy required to create indoor comfort is directly affected by a building’s microclimate [13],[14].Further, [15] asserts that, to minimize the utilization of energy systems inside a building to obtain climate comfort which is affected by exterior factors, it is essential tomake sure that the design parameters, which are within the designers control, are selected with suitable values.
The experiments were run using the equations 2.1 to 2.9. The inputs being, mean hourly ambient temperatures per month for whole year, wall thickness of 100mm, 150mm, 225mm and 300mm. While the outputs were; hourly internal brooder temperatures.
The brooder pH was set at 10 and the ammonia concentration simulated for 28 days at brooding floor temperatures of 14.80C, 18.70C, 22.60C and 27.40C.Fig. 2.1
https://dx.doi.org/10.22161/ijaems.5.5.2 ISSN: 2454-1311
Fig.2.1: Simulating brooder temperatures and ammonia concentration (source: Authors, 2019)
The results of the experiment were correlated to the optimal brooding temperatures and optimum wall thickness established.
III. RESULTS AND DISCUSSION
Plots of brooding room hourly temperatures and ammonia concentrations against 24 hours of the day for the whole year were generated. The results of the simulations to determine the influence of trombe wall thickness on the variation of hourly internal brooder temperatures for trombe wall thickness of 100,150, 200, 250 and 300mm and hourly temperatures; the wall thickness of 100mm and 150 mm yielded maximum brooding space temperature of 36.50C
and 35.30C respectively. The resultant brooder temperatures
were above the optimal brooding temperature range of 340C
for day one and 21 to 240C for the 28th day of brooding.
However, the lowest brooder temperatures attained for 100mm and 150mm wall thickness were 29.50C and 30.80C
respectively. The wall thickness of 300mm yielded temperature range of 25.70C to 280C. Fig. 3.1 and Fig. 3.2
https://dx.doi.org/10.22161/ijaems.5.5.2 ISSN: 2454-1311
Fig.3.1: Generated internal brooder for various wall thick ness. (Source: Authors, 2019)
https://dx.doi.org/10.22161/ijaems.5.5.2 ISSN: 2454-1311
From this study it is deduced that the wall thickness of 100 and 150mm are suitable for development of a chicks’ brooder. Though, supplementary source of heat will be required to keep the birds comfortable for the first one week of brooding period. Since the temperatures attained in the brooder are slightly below optimal brooding temperatures for the first seven days of brooding. According to [15]the microclimate conditions surrounding a building have a direct impact on the energy consumption necessary to provide indoor comfort. Therefore, type of walling material will influence amount of heat energy required to keep the brooding room temperature within the required limits. Simulations for ammonia concentration showed that concentration of the emitted gas increased exponentially from day one to the 28th day for brooding floor temperatures
of 14.80C, 18.70C, 22.60C and 27.40C. The highest emission
of ammonia was recorded at the temperature of 14.80C for
the first fifteen days; but after the 15th day the temperature
of 18.70C recorded the highest emission of ammonia.
Conversely, the temperature of 27.40C yielded the lowest
ammonia emission. Emission of ammonia gas is likely to be caused by birds’ droppings, the dampness on the floor and microbial activities on the floor of the brooder. This results show that at high temperatures the amount of heat energy in the brooding room is high, hence the room is likely to be drier consequently less microbial activities on the brooding floor leading to less ammonia generation . Fig. 3.3 shows the ammonia gas emission for the 28 days brooding period.
Fig. 3.3: Ammonia gas concentration for 28 days brooding period. (Source: Authors, 2019).
IV. CONCLUSION
This study showed that the wall thickness of 100 and 150mm are suitable for development of a chicks’ brooder. Though, supplementary source of heat will be required to keep the birds comfortable for the first one week of brooding period. The exponential increase of the emitted ammonia gas from day one to the 28th day of brooding
shows the significance of designing brooders to have provision for facilitating removal of birds’ droppings in order to minimize emission of the ammonia gas from the floor of the brooder.
REFERENCES
[1] M.A Wachira, S.K. Mail, J. W. Munyasi, M. Nzioka, D. M. Mwangi, P. Kaguthi and J. Kithome .“Uptake of improved technologies through dissemination by
indigenous chicken service providers in southern rangelands of Kenya.”
[2] S. W. Njue, J.L. Kasiiti, J.M. Macharia, S.G. Gacheru, and H.C.W. Mbugua A survey of dis ease stat us of village chicken in Kenya. Livestock Community and Environment. Proceedings of the10th Conference of the Association of Institutions for Tropical veterinary Medicine, Copenhagen Denmark.”2001
[3] L. Tarwireyi and M. Fanadzo “Production of indigenous chickens for household food security in rural KwaZulu-Natal, South Africa: A situation analysis.” 2013
https://dx.doi.org/10.22161/ijaems.5.5.2 ISSN: 2454-1311 and Israel, raised at normal or low temperature”
Poultry Sci.70:2028-2039. 1991
[5] Y.O. Suk and K. W. Washburn “Effects of environment on growth, efficiency of feed utilization, carcass fatness and their association” Poultry Sci. 74 285-296.1995
[6] Manitoba Agriculture and Food, Animal Industry branch June, 2002.
[7] Solomon Demeke “Suitability of hay-box brooding technology to rural household poultry production system” Livestock Research for Rural Development. Volume 19, Article #3. Retrieved August 31, 2011, from http://www.lrrd.org/lrrd19/1/de me 19003.htm [8] B. Amanda (2007). General brooding and rearing fact
sheet. Introduction to Poultry Production in
[9] U.V. Ahiaba, T.U. Nwakonobi, S.E. Obitta (2015
“Development and Evaluation of a Passive Solar
System for Poultry Egg Incubation’ International Journal of Engineering Research and General Science Volume 3, Issue 6, November-December, 2015 ISSN 2091-2730. www.ijergs.org
[10]C.A Berg (1976). “Potential for Energy Conservation in Industry”. Annual Review of Energy. 1976- 1: 519 – 534
[11]M. Iqball“Introduction to Solar Radiation. Academy Press: New York, NY.1983 , 215-275.Saskatchewan (http://www.agriculture.gov.sk.ca)
[12]M. Ahmed, Abdel-Ghany, Toyoki Kozai “Dynamic
modeling of the environment in a naturally ventilated,
fog-cooled greenhouse” Renewable Energy 1983
31(2006)15211539).www.sciencedirect.com1: 519 –
534
[13]CEC (Commission of the European Communities) 1989.Indoor pollution by NO2 in European countries, Report No. 3, European Concerted Action "Indoor Air Quality and its Impact on Man",(COST Project 613), EUR 12219 EN, Luxembourg.
[14]Chappells, H., & Shove, E. (2005). “Debating the Future of Comfort: Environmental Sustainability, Energy Consumption and the Indoor Environment.” Building Research & Information, 33(1), 32–40.doi: 10.1080/0961321042000322762