Analyzing Regional Potentialities to Encourage
Economic Growth of Sidoarjo Regency
Khubbi Abdillah1 1
Doctoral Study Program, Faculty of Economics and Business, Universitas Airlangga, Surabaya, Indonesia
ABSTRACT
This study aims to analyze regional potentialities owned by Sidoarjo Regency by developing sectorial planning to identify which sectors are categorized as leading sectors and generating developmental strategies applied in the region. In this study, the writers apply Location Quotient (LQ) method, Specialization Index method, and Shift Share Analysis. The result of the analysis indicates that the air transportation sector is the highest leading sector owned by the region while wholesale, retail, and car and motor reparation are the most competitive sectors of the region. Based on result of analysis on each leading sector, Sidoarjo Government can generate developmental strategies for each sector so that these leading sectors can improve economic growth in the region.
Keywords: Leading Sectors, Competence, LQ, Specialization Index, Shift Share Analysis
I. INTRODUCTION
Economic growth cannot happen naturally. It requires consistent efforts made by all parties. Jhingan (2004) stated that the goal of economic growth is to develop an adequate scale capital tool to improve productivity in agriculture, mining, plantation, and industry sectors. The capital is also required to build infrastructure facilities, such as roads, drainage system, clean water, electricity, telephone line, etc. Among the challenges and obstacles in building infrastructures in many regions are high cost, low recovery rate cost, regional government allocates small amount of funding in building infrastructure, and problems in transferring land rights for infrastructure procurement.
Regional development can be carried out through sectoral approach focusing on choosing which economic sectors owned by the region can be used as motor that generates economic activities in the region. Every region has its own economic advantages and potentialities serving as sources of economic growth in the region. In order to assure that regional potentialities owned by a region are well developed according to the goals of regional development, the development of regional potentialities should be integrated and conducted continuously to improve economic productivity of the region. Ability to encourage the economic growth of a region depends on the advantages and competence owned by economic sectors of the region (Rustiadi et al, 2009). Economic growth of a region also correlates with comparative advantages and regional specializations to be explored and developed further to implement sustainable development for the region (Arsyad, 1999).
Sidoarjo Regency consists of 18 districts, namely Sidoarjo, Buduran, Candi, Porong, Krembung, Tulangan, Tanggulangin, Jabom, Krian, Balongbendo, Wonoayu, Tarik, Prambon, Taman, Waru, Gedangan, Sedati, and Sukodono. Sidoarjo Regency is the hinterland of Surabaya Municipality as the core region of East Java Province. Population of Sidoarjo Regency is unevenly distributed. Several districts are densely populated while the others are scarcely populated. Sidoarjo is one of the autonomous regions owning its own authorities to manage, plan, and utilize its own economic potentialities optimally.
Table 1.1: Economic Growth Rate Based on 2010 Constant Price and Gross Regional Domestic Product (GRDP) of Sidoarjo Regency (in thousand IDR) from 2011-2014
Year Economic Growth GRDP Per capita
2011 7,04 43972,76 2012 7,26 46377,29 2013 6,88 48791,68 2014 6,18 50940,64
Source : BPS Sidoarjo
Regency contributes to GRDP of the region (i.e. each resident contributes a sum of gross value added as much as value per capita of economic activities he/she conducts).The economic condition in Sidoarjo Regency is recovering after influenced by the global economic crisis in 2008 as indicated by increasing GRDP and positive economic growth (BPS, 2015). GRDP refers to the total sum of gross value added as the result of economic activities carried out in a region. Therefore, the amount of GRDP in certain period often serves as an indicator in assessing economic performance of a region, especially related to the capability of a region in managing its own resources.
The aim of this study is to analyze regional potentialities based on the contribution of the leading sectors towards economic growth in Sidoarjo Regency. This goal becomes achievable by identifying the basis sectors of economics in Sidoarjo Regency and by identifying competitive advantages of economic sectors in Sidoarjo Regency.
II. THEORETICAL FRAMEWORK Economic Base Theory
Economic base theory is established on the idea that economic growth rate of a region is determined by the increasing export rate of the region. Economic activities carried out by the residents of the region is categorized into basis activities and non-basis activities. Only the basis activities can encourage economic growth of the region (Tarigan, 2012: 28).
In terms of regional economy, export refers to selling products or services outside the region; either it is selling the products/services to other regions in the same country or selling the products/services abroad. Laborers domiciled in one region but working and get paid in another region includes as export category. Principally, export activities carried out by the producers and service providers that result in income from other regions are categorized as basis activities. Employment and income of the basis sectors are the function of exogenous demand (i.e. not depending on internal forces or local demand).
Location Quotient (LQ)
One of indicators describing the condition of basis sector is Location Quotient (LQ) index. LQ index is a simple indicator describing the potentiality or how strong the effect of certain sector in a region compared to the effect of the same sector on the other higher regions or the reference region. The LQ index of a sector within regional can be measured through value added or Gross Regional Domestic Product approach. The measurement can be expressed according to the following formula:
⁄ ⁄
Note:
Vi = Gross Regional Domestic Product of the i sector in the lower region Vt = Total Gross Regional Domestic Product in the lower region
Yi= Gross Regional Domestic Product of the i sector in the higher region Yt= Total Gross Regional Domestic Product in the higher region.
Literatures on regional economy define the basis sectors that becomes potentiality of a region to export its products to other regions are the sectors with LQ index higher than 1 (LQ > 1). On the other hand, if the LQ index of a sector is lower than 1 (LQ < 1) indicating that the sector imports the products from other regions.Meanwhile, if the LQ index equals to 1 (LQ = 1) the sector tends to be closed because of carrying out transactions in the region and on to other regions. However, this condition is very rare on regional economy (Kuncoro, 2014).
Specialization Index (SI)
Specialization Index (SI) analysis is one of methods in measuring general behavior of economic activities, for example measuring the rate of Gross Regional Domestic Product in certain region. The approach applied in measuring SI is similar to the approach applied in measuring LQ index, namely through the value added. The conclusion drawn from SI is that the higher SI the higher sectoral specialization rate within the region concentrated in sectors with positive differentiation percentage (Daryanto & Hafizrianda, 2010: 23).
Shift Share Analysis (SSA)
Principally, SSA attempts to divide or decompose the difference (deviation) of values added in t-year (measured through value added approach) and value added obtained in the base year, usually notated as ∆Yt.
There are three decomposing variables serving as the components of ∆Yt, namely Regional Growth (RG)
component, Proportional Growth (PG) component, and Regional Share Growth (RSG) component. These components are formulated into the following mathematical expression:
III. FINDINGS AND DISCUSSION
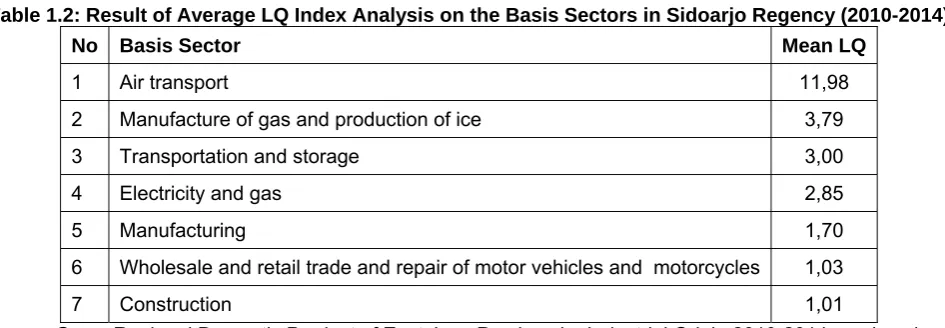
A sector with LQ index > 1 is categorized as basis sector. The basis sectors become a strength (potentiality) to export its products to the other regions. Higher LQ index indicates greater potentiality owned by the basis sector. Air transport, manufacture of gas and production of ice, transportation and storage, electricity and gas, and construction are the basis sectors or the most dominant sectors owned by Sidoarjo Regency. The highest LQ index is found on the air transport sector, contributed by Juanda Airport as the biggest airport in East Java Province, which has been expanded into two terminals serving both domestic destinations and international destinations. Manufacturing of gas and production of ice sectors contribute the second highest LQ index for Sidoarjo Regency as the result of Lapindo mud volcano erupted since 2006 in Porong District. Transportation and storage sector contributes the third highest LQ index for Sidoarjo Regency because Sidoarjo Regency is located in the hinterland of Surabaya. There are many warehouses in Waru and Gedangan Districts storing goods, motorcycles, and cars. Based on this condition, it can be said that Sidoarjo Regency experiences the trickle-down effect of the development in Surabaya.
Table 1.2: Result of Average LQ Index Analysis on the Basis Sectors in Sidoarjo Regency (2010-2014)
No Basis Sector Mean LQ
1 Air transport 11,98
2 Manufacture of gas and production of ice 3,79 3 Transportation and storage 3,00 4 Electricity and gas 2,85
5 Manufacturing 1,70
6 Wholesale and retail trade and repair of motor vehicles and motorcycles 1,03
7 Construction 1,01
Source : Gross Regional Domestic Product of East Java Province by Industrial Origin 2010-2014, analyzed Table 1.3 below describes the specialization index in Sidoarjo Regency is low. This condition indicates that the concentration of economic sectors are not well distributed across the region. There are three sectors serving as concentration of economic growth. They are manufacturing industry, transportation and storage, and air transport. Manufacturing industry is concentrated in Sidoarjo Industrial Estate Berbek (SIEB) as the center of industrial sites in Sidoarjo. The importance of SIEB is eminent as reflected by GRDP resulted from manufacturing industry in the region.
Table 1.3: Result of Analysis on Average Specialization Index (SI) in Sidoarjo Regency (2010-2014)
No Sector Mean IS
1 Manufacturing 20,53633019 2 Air transport 6,409083472 3 Transportation and storage 5,63334367
Source: BPS Jatim, analyzed
hand, forestry and logging industry sector is the economic sector with the smallest growth rate in the region (as much as 0.165). Based on these data, the most effective way to improve regional economic growth of Sidoarjo Regency in the future is enhancing the growth of manufacturing industry sector.
Table 1.4: Regional Growth of Sidoarjo Regency (2010-2014)
Sector Regional
Growth Sector
Regional Growth
Manufacturing 11352,071 Other mining and quarriyng 5,383 Wholesale and retail trade; repair of motor vehicle and
motorcycle 3349,805 Agriculture services and hunting 2,554 Wholesale trade and retail trade except of motor
vehicles and motorcycles 2248,719 Railways transportation 1,016 Construction 2081,970 Financial supporting service 0,357 Transportation and storage 1808,065 River, lake, and ferry transport 0,247 Air transport 1483,987 Forestry and logging 0,165 Source: BPS Jatim, analyzed
Although electricity and gas procurement sector seems to grow rapidly, the result of Shift Share Analysis indicates that the sector is not categorized as a leading sector in Sidoarjo Regency. Table 1.5 below depicting proportional Growth (PG) of economic sectors in Sidoarjo Regency reflects this condition by negative proportional growth -264.835. Similarly, not almost all sub-sectors of agricultural sector is leading sector, as indicated by negative PG indexes (except for fishery sector with PG index 135.130). The potentiality of fishery sector is mainly caused by many fishponds in Sidoarjo Regency producing fishery commodities, such as milkfish, mussels, and prawns. Conceptually, PG component increases as the result of subsector difference of final product demand, raw material availability, and industrial policies (i.e. policies on marketing, tax institution, subsidy, price support, etc.). Real estate activities sector has PG index 61.070. The sector with the lowest proportional growth is manufacture of gas and production of ice sector with PG index -347.335. Therefore, in order to improve the sector in the future, Sidoarjo Government (alongside with National Gas Company (PGN)) needs to improve gas supply either through transportation process, distribution process, and provide all kind of gas fuel through pipe system.
Table 1.5: The Analysis on Proportional Growth in Sidoarjo Regency (2010-2014)
Sector Proportion
al Growth Sector
Proportion al Growth
Information and communication 564,829 Real estate activities 61,070 Transportation and storage 465,221 manufacturing -116,510 Wholesale trade and retail trade except of
motor vehicles and motorcycles 462,321 Agriculture, livestock, hunting, and agriculture services -133,917 Wholesale and retail trade; repair of motor
vehicles and motorcycles 457,687 Agriculture, forestry, and fishing -209,300 Construction 183,739 Electricity and Gas -264,835 Air transport 179,285 Public administration and defence; compulsory social security -331,333 Fishery 135,130 Manufacture of gas and production of ice -347,335 Source: BPS Jatim, analyzed
provide comfortable public transportation to minimalize traffic jam, traffic accident, and criminality rate. Agriculture sector are losing the competition because many farmland in Sidoarjo Regency are transferred into housing areas or factories. Global warming also reduces the productivity of farmland in Sidoarjo where most of the farmland undergo crop failure recently. RSG rate of the medical and social service sector is negative due to lacking of medical practitioners, poor medical service, and lacking of social activities carried out by the government, for example free medication or free medical check-up. Oddly, social activities are often held during legislative or regional executive elections. Meanwhile, among the most eminent sectors with highest competitive potentiality in regional market share are wholesale and retail trade; repair of motor vehicles and motorcycles sector and wholesale and retail trade and repair of motor vehicles and motorcycles sector with RSG component rates 1136.808 and 732.611. The total RSG component rate of agriculture, forestry, and fishery sectors are 84.052 while the electricity procurement sector has positive competitive potentiality rate as much as 1.666.
Table 1.6: Regional Share Growth of Economic Sectors in Sidoarjo Regency (2010-2014)
Sector Regional
share growth Sector
Regional share growth
Wholesale and retail trade; repair of motor
vehicles and motorcycles 1136,808 Human health and social work activities -17,076 Wholesale and retail trade and repair of
motor vehicles and motorcycles 732,611 Construction -58,809 Wholesale trade and retail trade except of
motor vehicles and motorcycles 436,060 Manufacturing -71,661 Manufacturing of gas and production of ice 295,679 Land transport -82,715 Electricity and Gas 218,414 Real Estate activities -85,440 Air transport 103,328 Agriculture, livestock, hunting, and agriculture services -89,259 Electricity 1,666 Transportation and storage -157,686 Source: BPS Jatim, analyzed
According to turnpike growth theory (as cited in Tarigan, 2012) among the ways in enhancing development in underdeveloped regions is each region should be able to identify the sectors or commodities that have the highest potentiality and able to develop these sectors as fast (turnpike) as possible. In order to identify these potential sectors, the government may assess comparative potentiality (i.e. Location Quotient/LQ) and competitive potentiality or positive shift share. A sector is categorized as a leading sector if the sector own comparative potentiality and comparative potentiality. Table 1.7 below shows that there are four sectors that are considered as leading sectors in Sidoarjo Regency. They are electricity and gas, manufacturing of gas and production of ice, wholesale and retail trade and repair of motor vehicles and motorcyles, and air transport. These findings are not very surprising because of gas production potentiality provided by mud volcano in Porong District and many businesses in car and motorcycle trading and spare parts industry that opens job opportunity for Sidoarjo residents and enhances production outputs. These sectors encourage Regional Economic Growth of Sidoarjo Regency.
Table 1.7: Leading Sectors in Sidoarjo Regency According to Average LQ Index and Average Shift Share Index (2010-2014)
Sector Mean LQ Regional Share Growth Leading Sector
Electricity and gas 2,848 218,414 + Manufacture of gas and production of ice 3,791 295,679 + Wholesale and retail trade and repair of motor
vehicles and motorcycles 1,034 732,611 + Air transport 11,979 103,328 +
IV. CONCLUSION AND RECOMMENDATIONS Conclusion
1. Based on the result of LQ analysis, the leading sectors in Sidoarjo Regency are: construction sector, wholesale and retail trade and repair of motor vehicles and motorcycle, manufacturing industry, electricity and gas, transportation and storage, manufacture of gas and production of ice, and air transport sector. 2. There are 18 sectors with positive competitive potentiality (shift share growth) in Sidoarjo regency.
However, only six of them are considered as leading sectors. They are: wholesale and retail trade; repair of motor vehicles and motorcycles, wholesale and retail trade and repair of motor vehicles and motorcycles, wholesale trade and retail trade except of motor vehicles and motorcycles, manufacturing of gas and production of ice, electricity and gas, and air transport.
3. Overlay result of combined analysis on LQ index and shift share rate comes into ideal sectors with positive comparative and competitive potentiality. There are four ideal sectors considered as leading sectors. They are electricity and gas sector, manufacture of gas and production of sector, wholesale and retail trade and repair of motor vehicles and motorcycles sector, and air transport sector.
Recommendations
1. By considering the leading sectors owned by Sidoarjo Regency, the local government can developmental plan for each economic sector. The developmental plan is expected to be able to encourage the growth of underdeveloped sectors and direct the sectors toward economic development.
2. The government should prioritize economic development on the leading sectors that highly contribute on the regional economic growth of Sidoarjo Regency so that the sectors could provide multiplier effect on its outputs, income, and employment rate.
3. Developmental strategies should be directed towards infrastructure development and management, especially on administration, repairing damaged roadways due to excessive load vehicles using the roadways, slow disbursement of local government budgets, and overlapping authorities in managing roadways between the State (central government), Provincial government, local government and sub-districts. Proper infrastructure (roadways) shall support the growth of industries both in production and service providers. The local government should also be able to simplify permission granting bureaucratic procedure, enact Regional Regulation to facilitate investment in the region, and shortening marketing chain by forming working groups.
4. Sidoarjo local government should be able to encourage economic growth without enlarging fiscal disparity. Fiscal balance transfer and village allocation fund are expected to become solution in reducing poverty rate and income imbalance in Sidoarjo Regency. However, these funds also cause moral hazard for regional apparatuses and dependency towards the funds without making an effort in improving Regional Own-Source Revenue as one of Regional self-sufficiency indictors.
REFERENCES
Arsyad, L. 1999. “Pengantar Perencanaan dan Pembangunan Ekonomi Daerah” (1st ed.). Yogyakarta: BPFE.
Badan Pusat Statistik (BPS), 2015. “Sidoarjo dalam Angka 2007-2011”.
Badan Pusat Statistik (BPS), 2015. PDRB Menurut Provinsi Jawa Timur Menurut Lapangan Usaha 2010-2014
Badan Pusat Statistik (BPS), 2015. PDRB Menurut Kabupaten Kota Menurut Lapangan Usaha 2010-2014 Badan Pusat Statistik (BPS), 2015. PDRB Kabupaten Sidoarjo Menurut Pengeluaran 2010-2014
Daryanto, Arief & Hafizrianda. 2010. Model-model Kuantitatif untuk Perencanaan Pembangunan Ekonomi Daerah: Konsep dan Aplikasi. IPB Press: Bogor.
Jhingan, M.L., 2004, Ekonomi Pembangunan dan Perencanaan. Rajawali Press: Jakarta.
Kuncoro, Mudrajad. 2014. Otonomi Daerah Menuju Era Pembangunan Daerah Edisi 3. Penerbit Erlangga: Jakarta.
Rustiadi, E, Saefulhakim S. & Panuju D.R. 2009. Perencanaan dan Pengembangan Wilayah. Handbook of Applied Spatial Analysis: Software Tools, Methods and Applications. Heidelberg Springer: 43-52.
Tarigan, Robinson. 2012. Ekonomi Regional Teori dan Aplikasi, Bumi Aksara: Jakarta.
Widodo, Tri. 2006. PERENCANAAN PEMBANGUNAN: Aplikasi Komputer [Era Otonomi Daerah] (1st ed.). Yogyakarta: UPP