Social media and research: an assessment of the
coverage of South African universities in
ResearchGate, Web of Science and the Webometrics
Ranking of World Universities
Omwoyo Bosire Onyancha
1[email protected] ORCID: orcid.org/0000-0002-9232-4939
Received: 10 April 2015 Accepted: 22 June 2015
The emergence of social media, including social networking technologies, has had a profound impact on almost all human activities. Social media’s application in research is the most recent occurrence, as the technologies have gained prominence among researchers who regard social media as an avenue for not only strengthening their own networks, but also sharing their research. This article focuses on one of the social networking services for researchers, namely ResearchGate (RG), to assess the research visibility and impact of universities in South Africa. It also examines the correlation between the universities’ ResearchGate-based metrics and Web of Science (WoS) citation statistics on the one hand, and the Webometrics Ranking of World Universities’ (WRWU) ranking on the other. Results reveal that researchers in the top-ranking South African universities have quickly moved to embrace social media; there is a high correlation between RG and WoS in terms of their coverage of papers produced by universities in South Africa; there is also a high correlation between RG and WoS in terms of impact; and ranking of universities in RG, WoS and WRWU is similarly highly correlated. Further discussions, conclusions and recommendations are provided in the paper.
Keywords: South Africa, altmetrics, webometrics, citation analysis, social media, research, universities, research impact
1 Introduction and background information
It is no longer debatable that social media has had a great impact in society. The term ‘social media’ refers to a variety of technologies and phenomena that are themselves still the subject of debate among enthusiasts (see Burke 2013; Cann 2011; Mulero 2012). Mulero (2012) uses the words ‘social media’ and ‘social network’ interchangeably while Cann (2011: 46) defines social media as the:
online technologies and practices that people use to share opinions, insights, experiences, and perspectives. Social media can take many different forms, including text, images, audio, and video. These sites typically use technologies such as blogs, message boards, podcasts, wikis, and vlogs to allow users to interact.
Cann (2011) offers that social media should be understood in the context of its application in facilitating the production and dissemination of information, and how it enables people to discuss and consume the information. Social media and, more so, social networking sites have become increasingly popular among all types of people, irrespective of their socio-economic and geopolitical status (International Telecommunication Union 2010). As of January 2014, internet penetration stood at 35%, social networking penetration had rapidly increased to 26%, and mobile penetration was 93% of the 7.1 billion people in the world (Dodaro 2014). Although there are divergent opinions on the scope of social media impact, all agree that social media have had a profound effect on society (see Jung 2014; Parrack 2012; O’Keeffe, Clarke-Pearson & Council on Communications and Media 2014). One of the most recent applications of social media has been in research.
2 Application of social media in research: a brief overview
Research is, perhaps, the latest entrant in the social media world. Traditionally, research was developed and shared through published research articles, conference proceedings, technical reports, books and book chapters. The emergence of Information and Communications Technologies (ICT) and, more specifically, the internet have opened up more opportunities through which research can be produced and shared. Several people have proposed how social media can be used in research (for example, Cann 2011; Miah 2013). Miah (2013) observes that social media can be used not only in promoting research, but in its development. In his argument, Miah maintains that it is now possible for researchers to digest a lot more content from journals which are delivered through social media than those delivered through traditional means. For instance, he argues that RSS feeds provide instant access to content of any given
research article published in journals making use of social media. Time is therefore saved through the use of social media platforms such as RSS feeds.
Although the biggest users of social media are people aged between 18 and 49 (over 80% of internet users), the uptake of social media by students for research towards attaining postgraduate degrees (master’s and doctoral degrees) is still minimal. According to the report by Carpenter, Wetheridge and Tanner (2012), entitled Researchers of tomorrow: the research behaviour of Generation Y doctoral students, students tend to use technology applications and social media in their research if they augment, and can easily be absorbed into, existing work practices. The report further reveals that levels of use of social media and other applications helpful in retrieving and managing research information are steadily rising among Generation Y doctoral students, but those applications most useful for collaboration and scholarly communications remain among the least used. In respect of the purpose for which researchers use social media, Cann (2011) identifies four areas:
identification of knowledge (for example, undertaking literature reviews using peer-reviewed sources);
creation of knowledge by professional researchers usually behind closed doors;
quality assurance of knowledge (for example, peer review, filtering the best for publication);
dissemination of knowledge (for example, publication, presentation at conferences).
Of late, the use of social media in research has also been extended to the analysis of the impact of research. Research evaluation has become a major player in so many aspects of being a researcher, including impacting on employment, tenure, promotion, funding and rating. The evaluation of research impact on social media has led to the introduction of alternative metrics (simply referred to as altmetrics). Altmetrics, which is sometimes called social web metrics (Costas, Zahedi & Wouters 2014) and/or influmetrics (Cronin & Weaver 1995; Rousseau & Ye 2013), is concerned with assessing how many times an output (for example, article, website, blog, dataset, grey literature, software) has been viewed, downloaded, cited, reused, shared, bookmarked and/or commented upon (Konkiel 2012).
Rogers (2015) indicates that a great number of researchers have taken to social media to share their professional identities and full-text publications. In their study entitled ‘Social networks, learning, and flexibility: sourcing scientific knowledge in new biotechnology firms’, Liebeskind et al. (1996: 428) reveal that scientists use social media to exchange scientific knowledge and, by so doing, they "increase both their learning and their flexibility in ways that would not be possible within a self-contained hierarchical organization”. Bianchini (2012) argues that researchers use social networks frequently to maintain and develop professional relationships.He believes that researchers or scientists consider social ties to be very important in their professional careers. They are driven by the fact that they wish to keep abreast of what research their colleagues are engaged in for purposes of establishing collaboration in common fields of interest and knowledge sharing. Communicating research findings is also one of the areas in which social media has found a role to play. Allen et al. (2013) assert that social media has increased dissemination of original articles in the domain of clinical pain sciences. The authors conducted a study aimed at quantifying the impact on views and downloads of articles in clinical pain sciences when they were released via a blog and on social media. They found that there was an increase in both outcome variables in the week after the blog post and social media release of the articles. They noted the following:
The mean ± SD rate of HTML views in the week after the social media release was 18 ± 18 per day, whereas the rate during the other three weeks was no more than 6 ± 3 per day. The mean ± SD rate of PDF downloads in the week after the social media release was 4 ± 4 per day, whereas the rate during the other three weeks was less than 1 ± 1 per day (Allen et al., 2013: 1).
Despite the value attached to social media, especially regarding its potential to increase the dissemination of research findings, Allen et al. (2013) argue that little has been written to support their claim.
3 Purpose of the study
The purpose of the study was to determine and compare the visibility and impact of research produced by South African universities on ResearchGate (RG), on the one hand, and the Web of Science (WoS), on the other. Furthermore, the study sought to compare the ranking of the universities using the data extracted from RG, WoS and Webometrics Ranking of World Universities (WRWU) with a view to determining rank correlations.
In order to fulfil the above purpose, the following research questions were formulated:
To what extent have researchers in South African universities embraced social media and, more specifically, RG?
Is there a significant difference between RG and WoS in terms of their coverage of papers published by researchers in South African universities?
Is there a significant difference between WoS and RG in terms of the research impact of each of the universities in South Africa?
4 Methods and materials
The data was extracted from multiple sources, namely, RG; the three citation indexes (Science Citation Index, Social Sciences Citation Index and Arts and Humanities Citation Index) of WoS; and WRWU (January 2014 edition). WoS is an online scientific citation indexing service maintained by Thomson Reuters. Through its citation indexes, the service provides citation statistics of papers and data published in selected journals. The indexes cover published research on various subjects. The three citation indexes selected from WoS cover a range of publication types including research articles, meeting abstracts, book reviews, editorial material, letters to the editor, book chapters, reprints, art exhibitions, proceedings, news items, and record reviews. ResearchGate, on the other hand, is a social networking site, founded in 2008 by Ijad Madisch, a virologist and computer scientist. The site is freely available for scientists and researchers to share papers, discuss topics of interest, and find research collaborators. Available site data includes the number of papers (research articles, pre- and post-prints, non-published papers and paper presentations), number of researchers (members), institutions, impact score and the ResearchGate score. The latter two are measures of prestige. The WRWU, published by the Cybermetrics Lab, is a ranking system for the world’s universities which is based on various ranking methods or techniques such as presence rank, impact rank, openness rank and excellence rank (see www.webometrics.info for more information).
Table 1 List of public universities in South Africa
Name of university Abbreviation
1 Cape Peninsula University of Technology CPUT
2 Central University of Technology CUT
3 Durban University of Technology DUT
4 Mangosuthu University of Technology MUT
5 Nelson Mandela Metropolitan University NMMU
6 North-West University NWU
7 Rhodes University RU
8 Stellenbosch University SUN
9 Tshwane University of Technology TUT
10 University of Cape Town UCT
11 University of Fort Hare UFH
12 University of Johannesburg UJ
13 University of KwaZulu-Natal UKZN
15 University of Limpopo UL
15 University of Pretoria UP
16 University of South Africa UNISA
17 University of the Free State UOVS
18 University of the Western Cape UWC
19 University of Venda UNIVEN
20 University of Witwatersrand WITS
21 University of Zululand UNIZUL
22 Vaal University of Technology VUT
23 Walter Sizulu University WSU
analysis yields the following data: total publications; total cites; cites with self-citations; cites without self-citations; average cites per paper; and h-index. Of these, total cites, average cites per paper and the h-index were used to compare research output and impact of South African universities in RG and WoS.
For the WRWU, data was extracted from the Cybermetrics Lab website (www.webometrics.info). The data was filtered by region (Africa) and then by country (South Africa). All institutions that were ranked in the report were downloaded onto a Microsoft Excel worksheet which was also used to identify the twenty-three public universities that were the subject of the current study. The relevant data downloaded for purposes of conducting the current study included: world rank of each of the South African public universities; the rank of each university in South Africa; and presence rank, impact rank, openness rank and excellence rank of each university. In order to download relevant data from RG, the statistics of South African institutions covered in RG were explored and filtered. Each university under investigation in this study was further explored to extract total publications, total RG score, and total impact points.
Data was downloaded from the three data sources in the month of February 2014.
The impact of each public university’s research was examined using different indicators as provided by the different sources used to obtain data for the study. Whereas impact in RG was measured using the RG score, impact points, downloads and views, impact in WoS was examined using the sum total of citations, average citations per paper, total cites without self-citations and the h-index. The RG score and impact points were used as the two are said to measure reputation and/or impact, while the number of publications is a proxy measurement of output. It has been reported on RG’s website that, although the RG score measures an individual researcher’s reputation, collectively a group of colleagues’ scores can be seen as a reflection of an institution. It is on the basis of this argument that the score as well as the impact points were used to compare the impact of research in RG and WoS. The raw data that was extracted from WoS and RG was reorganised and stored using Microsoft Excel. The datasets were presented in tables as reflected in Appendices A, B and C. The data was then subjected to further analysis using the Statistical Package for Social Sciences (SPSS) to obtain the correlations which were meant to aid in comparing the performance of the South African universities on social media sites (in this case, RG) and WoS on the one hand, and WRWU on the other. The correlation coefficients were obtained using Spearman’s correlation. Spearman's correlation coefficient (signified by rs) measures the strength of association between two ranked variables. The results of Spearman’s correlation were plotted on tables presented as Tables 2, 4, 5 and 6.
5 Results
The comparison of institutions and the choice of sources of data for the study were guided by the objectives of the study, namely:
the number of papers produced by authors in South African public universities;
the reputation and/or citation impact of papers produced by South African universities;
the ranking of institutions using ResearchGate, Webometrics and the Web of Science citation indexes.
5.1 Number of publications
According to the number of papers or publications (Appendices A and C), UCT yielded the highest number in both datasets. It produced a total of 11,050 papers in RG, and a total of 6,914 publications in WoS.
Table 2 Spearman’s correlation between WoS and RG in terms of their coverage of papers
Web of Science ResearchGate
Web of Science
Correlation coefficient 1.000 .896**
Sig. (2-tailed) . .000
N 23 23
ResearchGate
Correlation coefficient .896** 1.000
Sig. (2-tailed) .000 .
N 23 23
**. Correlation is significant at the 0.01 level (2-tailed).
WITS, which was positioned second in both tables, produced 2,298 and 6,473 publications in RG and WoS respectively. In terms of the correlation between the coverage of papers in WoS and RG, Table 2 reveals that the two sources’ coverage was very highly correlated, with a Spearman’s correlation coefficient of rs=.886. The correlation was
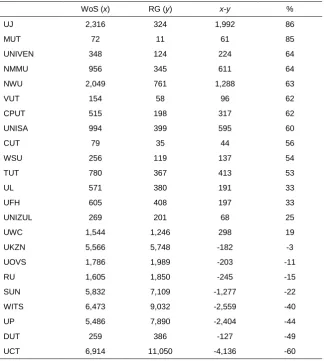
percentage difference between WoS and RG (implying a higher level of coverage in WoS as opposed to RG), UJ recorded the highest percentage (86%), followed by MUT (85%), UNIVEN (64%), NMMU (64%) and NWU (63%), to name the top five universities in Table 3. The universities that yielded more papers in RG than WoS were led by UCT, which yielded 60% more papers in RG than WoS, followed by DUT (49%), UP (44%), WITS (40%) and SUN (22%).
Table 3: Percentage difference in coverage of papers in WoS and RG
WoS (x) RG (y) x-y %
UJ 2,316 324 1,992 86
MUT 72 11 61 85
UNIVEN 348 124 224 64
NMMU 956 345 611 64
NWU 2,049 761 1,288 63
VUT 154 58 96 62
CPUT 515 198 317 62
UNISA 994 399 595 60
CUT 79 35 44 56
WSU 256 119 137 54
TUT 780 367 413 53
UL 571 380 191 33
UFH 605 408 197 33
UNIZUL 269 201 68 25
UWC 1,544 1,246 298 19
UKZN 5,566 5,748 -182 -3
UOVS 1,786 1,989 -203 -11
RU 1,605 1,850 -245 -15
SUN 5,832 7,109 -1,277 -22
WITS 6,473 9,032 -2,559 -40
UP 5,486 7,890 -2,404 -44
DUT 259 386 -127 -49
UCT 6,914 11,050 -4,136 -60
5.2 Reputation and/or citation impact
The citation count and/or impact performance of each university’s research were compared using the following indicators: for RG, the RG score, impact points, downloads and views, and for WoS, total citations, average cites per paper, citations without self-citations and the h-index. As was the case with the number of publications, covered in both WoS and RG, the top-ranking universities in South Africa performed well in terms of the impact and/or citation count. For instance, UCT generated a total of 52,571 citations, 47,438 citations without self-citations, 7.6 average citations per paper and an h-index of 74. The rest of the top five universities performed as follows, in order of total citations, citations without self-citations, average citations per paper and h-index: WITS (40,066; 35,737; 6.7; 65), SUN (30,287; 26,441; 5.19; 51); UKZN (27,040; 22,534; 4.86; 48) and UP (18,062; 15,236; 3.29; 40). When aggregated, it was observed that the total number of citations in WoS for all universities was 220,987, while the total RG score and impact score was 3,773 and 4,760, respectively.
Table 4 South African universities’ impact using WoS and RG data
Web of Science Papers Cites Cites without self-cites
TOTAL 45,429 220,987 193,339
Average per university 1,975.17 9,608.13 8,406.04
Average per paper 4.86 4.26
ResearchGate Papers RG score Impact points Downloads Views
TOTAL 100,060 173,561.82 218,947.16 576,412 1,181,928
Average per university 2,175,22 3,773.08 4,759.72 12 530.70 25,694.09
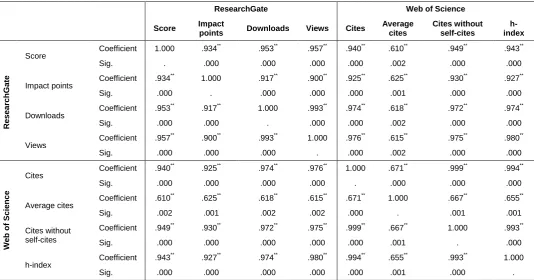
Table 4 reveals that the average number of citations per paper as well as per university in WoS was much lower than the average number of downloads per paper and university in RG. Whereas the average number of citations per paper was 4.86, the average number of downloads per paper was 5.76. In terms of the citations and downloads per university, the figures stood at 9,608.13 and 12,530.7 respectively. The average number of views surpassed the citations and downloads per paper and university. Despite the aforementioned discrepancies between citations and RG’s altmetrics (downloads and views), Table 5 reveals that there were very high correlations between the three indicators of impact. When comparing WoS and RG, it was found that the highest correlation coefficient was recorded between views and h-index (rs=.980), followed by views and cites (rs=.976), views and cites without self-citations (rs=.975), downloads and cites
(rs=.974), downloads and h-index (rs=.974) and downloads and cites without self-citations (rs=.972). All these relationships
were very highly correlated.
Table 5 Research impact: Spearman’s correlation (N=23)
ResearchGate Web of Science
Score Impact
points Downloads Views Cites
Average cites Cites without self-cites h-index R e s e a rc hGa te
Score Coefficient 1.000 .934 **
.953** .957** .940** .610** .949** .943**
Sig. . .000 .000 .000 .000 .002 .000 .000
Impact points Coefficient .934 **
1.000 .917** .900** .925** .625** .930** .927**
Sig. .000 . .000 .000 .000 .001 .000 .000
Downloads Coefficient .953 **
.917** 1.000 .993** .974** .618** .972** .974**
Sig. .000 .000 . .000 .000 .002 .000 .000
Views Coefficient .957 **
.900** .993** 1.000 .976** .615** .975** .980**
Sig. .000 .000 .000 . .000 .002 .000 .000
W e b of S c ie nce
Cites Coefficient .940 **
.925** .974** .976** 1.000 .671** .999** .994**
Sig. .000 .000 .000 .000 . .000 .000 .000
Average cites
Coefficient .610** .625** .618** .615** .671** 1.000 .667** .655**
Sig. .002 .001 .002 .002 .000 . .001 .001
Cites without self-cites
Coefficient .949** .930** .972** .975** .999** .667** 1.000 .993**
Sig. .000 .000 .000 .000 .000 .001 . .000
h-index Coefficient .943 **
.927** .974** .980** .994** .655** .993** 1.000
Sig. .000 .000 .000 .000 .000 .001 .000 .
**. Correlation is significant at the 0.01 level (2-tailed).
5.3 Ranking of institutions
A comparison of the ranking of universities in the three datasets (provided in Appendices A, B and C) reveals the dominance of five universities. There were, however, differences in the positions taken by the universities across the three datasets. For instance, whereas UCT occupied position one throughout in RG and WoS, it was ranked in position five in WRWU. The overall ranking of the other top universities in the order of RG, WoS and WRWU was as follows: WITS (2, 2, 8), SUN (2, 3, 1), UKZN (5, 4, 7) and UP (4, 6, 2). This pattern was replicated with the rest of the universities.
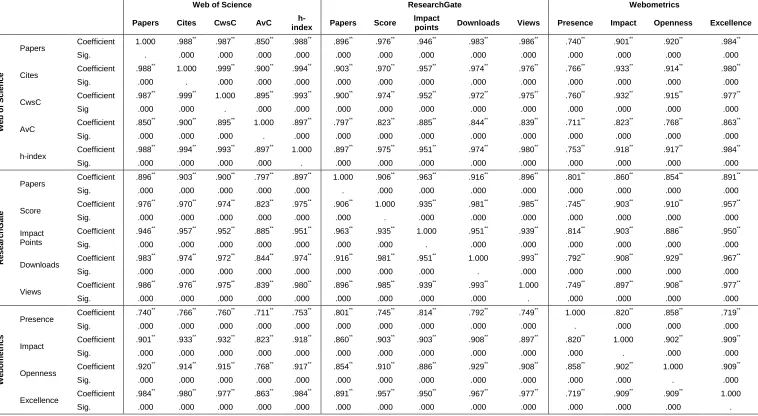
It is worth mentioning that some universities that performed relatively well in terms of WoS and RG data did poorer as far as their WRWU performance was concerned. In this category were universities such as UCT, WITS, UKZN, UJ, NWU, UWC, UOVS, TUT and NMMU. Regardless of the aforementioned individual performance of the universities, Table 6 illustrates that there were no significant differences in the ranking of the universities when comparing their coverage in the three datasets of RG, WoS and WRWU, using different performance indicators. In terms of the ranking of universities in RG and WoS, the highest correlation occurred between views and papers (rs=.986). The other highly correlated rankings
in RG and WoS, in that order, occurred between downloads and papers (rs=.983), views and h-index (rs=.980), views and
cites (rs=.976) and RG score and papers (rs=.976). The rankings in RG and WRWU were very highly correlated in terms
of the WRWU’s excellence rank and RG’s views (rs=.977), downloads (rs=.967), RG score (rs=.957) and impact points
(rs=.950). Similarly, the ranking of South African universities using the WoS data produced high correlations with the
Table 6 Ranking of universities: Spearman’s correlation (N=23)
Web of Science ResearchGate Webometrics
Papers Cites CwsC AvC
h-index Papers Score
Impact
points Downloads Views Presence Impact Openness Excellence
W e b of S c ie nce
Papers Coefficient 1.000 .988
** .987** .850** .988** .896** .976** .946** .983** .986** .740** .901** .920** .984**
Sig. . .000 .000 .000 .000 .000 .000 .000 .000 .000 .000 .000 .000 .000
Cites Coefficient .988 **
1.000 .999** .900** .994** .903** .970** .957** .974** .976** .766** .933** .914** .980**
Sig. .000 . .000 .000 .000 .000 .000 .000 .000 .000 .000 .000 .000 .000
CwsC Coefficient .987
** .999** 1.000 .895** .993** .900** .974** .952** .972** .975** .760** .932** .915** .977**
Sig .000 .000 . .000 .000 .000 .000 .000 .000 .000 .000 .000 .000 .000
AvC Coefficient .850 **
.900** .895** 1.000 .897** .797** .823** .885** .844** .839** .711** .823** .768** .863**
Sig. .000 .000 .000 . .000 .000 .000 .000 .000 .000 .000 .000 .000 .000
h-index Coefficient .988
** .994** .993** .897** 1.000 .897** .975** .951** .974** .980** .753** .918** .917** .984**
Sig. .000 .000 .000 .000 . .000 .000 .000 .000 .000 .000 .000 .000 .000
R e s e a rc hGa te
Papers Coefficient .896 **
.903** .900** .797** .897** 1.000 .906** .963** .916** .896** .801** .860** .854** .891**
Sig. .000 .000 .000 .000 .000 . .000 .000 .000 .000 .000 .000 .000 .000
Score Coefficient .976
** .970** .974** .823** .975** .906** 1.000 .935** .981** .985** .745** .903** .910** .957**
Sig. .000 .000 .000 .000 .000 .000 . .000 .000 .000 .000 .000 .000 .000
Impact Points
Coefficient .946** .957** .952** .885** .951** .963** .935** 1.000 .951** .939** .814** .903** .886** .950**
Sig. .000 .000 .000 .000 .000 .000 .000 . .000 .000 .000 .000 .000 .000
Downloads Coefficient .983
** .974** .972** .844** .974** .916** .981** .951** 1.000 .993** .792** .908** .929** .967**
Sig. .000 .000 .000 .000 .000 .000 .000 .000 . .000 .000 .000 .000 .000
Views Coefficient .986 **
.976** .975** .839** .980** .896** .985** .939** .993** 1.000 .749** .897** .908** .977**
Sig. .000 .000 .000 .000 .000 .000 .000 .000 .000 . .000 .000 .000 .000
W e bom e tr ic s
Presence Coefficient .740 **
.766** .760** .711** .753** .801** .745** .814** .792** .749** 1.000 .820** .858** .719**
Sig. .000 .000 .000 .000 .000 .000 .000 .000 .000 .000 . .000 .000 .000
Impact Coefficient .901
** .933** .932** .823** .918** .860** .903** .903** .908** .897** .820** 1.000 .902** .909**
Sig. .000 .000 .000 .000 .000 .000 .000 .000 .000 .000 .000 . .000 .000
Openness Coefficient .920 **
.914** .915** .768** .917** .854** .910** .886** .929** .908** .858** .902** 1.000 .909**
Sig. .000 .000 .000 .000 .000 .000 .000 .000 .000 .000 .000 .000 . .000
Excellence Coefficient .984 **
.980** .977** .863** .984** .891** .957** .950** .967** .977** .719** .909** .909** 1.000
Sig. .000 .000 .000 .000 .000 .000 .000 .000 .000 .000 .000 .000 .000 .
**. Correlation is significant at the 0.01 level (2-tailed).
6 Discussions
The findings presented and discussed above demonstrate that the adoption and use of social media, in general and more specifically on RG, by academics/researchers in South African universities is a reality. Several academics/researchers have taken to social media to share their research findings – as reflected by the number of papers that have been posted on RG (see Appendix A). There are a substantial number of academics/researchers in each university who are occupying the RG space. This study, however, did not investigate whether the number of members per university reflects the actual number of academics in the respective universities. Nevertheless, it was noted that a substantial number have joined RG as members (see the second column in Appendix A). Perhaps the value of social media in research is becoming increasingly clearer to academics/researchers in South African universities. Miah (2013) vividly captures the importance of social media in research by stating that, with more publishers, research and peers occupying these places, opting out of social media is for academics or researchers these days akin to opting out of email in the 1990s.
A critical examination of the two extremes of Table 3 – the universities at the top and bottom of the table – reveals that the majority of the universities at the bottom of the table have been identified as the most productive universities in South Africa in terms of research output and impact as well as web impact (see Onyancha 2008; Pouris & Pouris 2011; Matthews 2012; Cybermetrics Lab 2014a; Republic of South Africa. Department of Higher Education and Training 2014 & 2015). All these sources identify UCT, UP, UKZN and WITS as the most productive universities in terms of research and web impact in South Africa. The implication of the results in Table 3, as well as the fact that these universities are the most influential in South Africa in terms of research and web impact, is that researchers in these universities are more active in social media than those in the universities with low research visibility and impact. It will nevertheless be interesting to investigate the motivations that drive the researchers in the-top ranking universities in South Africa to embrace social media and, more so, RG. A critical study of the institutional policy as well as individual interests will add value to understanding the factors that have motivated researchers to join RG.
In terms of the correlation between RG and WoS in coverage of papers, the findings reveal that the two datasets correlated highly. Despite the fact that there were discrepancies in the number of papers indexed or captured for each university in the two data sources, there is a significant correlation in coverage. Does this finding vindicate WoS against accusations that the citation indexes are biased in their coverage of papers? Luwel (1999) has provided a few cases in which WoS’s Science Citation Index (SCI) has been accused of bias in its coverage. Harzing (2010) notes, however, that the international coverage of papers by WoS has continued to improve but adds that “it still has a North American bias in many disciplines”. Despite his critique of the international citation indexes, and more particularly WoS’s citation indexes, Nwagwu (2010: 228), like Harzing (2010), notes that “autonomous databases that have regional, national and organizational focuses are beginning to emerge, but such an infrastructure is not yet available in Africa and many other developing regions”. The high correlations between WoS and RG, in terms of their coverage of papers produced by researchers in the universities in South Africa, may imply that the RG uptake by South African researchers is yet to be fully embraced. In other words, for the correlation scores to be that high, a sizable number of papers produced by researchers in the universities in South Africa are not visible in both the WoS and RG. Alternatively, the high correlation scores may imply that the WoS has improved considerably in its coverage of papers produced in developing nations such as South Africa which was hitherto not adequately represented in the WoS citation indexes.
Ranking of universities according to different performance indicators is not a new activity (Foley 2008). Foley (2008: 24) postulates that “regardless of their true ability to judge a university’s success or failure, rankings are used by students, their families, and, increasingly policy makers to define the quality of institutions”. Of late, global ranking systems have emerged to compare universities across geographical regions. Of these, the most commonly used include the Academic Rankings of World Universities (ARWU), World University Rankings (WUR) and WRWU (Foley 2008; Thelwall & Kousha 2014). The high correlation scores reported between the ranking of RG and WoS on the one hand, and WRWU’s excellence rankings on the other, are not surprising at all, as the computation of the excellence ranking takes into consideration the excellent publications produced by institutions, “the university scientific output being part of the 10% most cited papers in their respective scientific fields” (Cybermetrics Lab, 2014b). Similar findings have been reported by Thelwall and Kousha (2014).
7 Conclusions
In view of the above discussion of the results, the following conclusions have been drawn:
There is no significant difference between WoS and RG in terms of the coverage of papers produced by South African universities.
There is no significant difference between RG and WoS, on the one hand, and WRWU, on the other, in terms of the ranking of South African universities across different performance indicators (number of papers, cites, cites without self-citations, average cites per paper, h-index, RG score, RG impact points, downloads, views and Webometrics rankings – presence, impact, openness and excellence).
There is no significant difference between WoS and RG in terms of the research impact of each of the universities in South Africa.
References
Allen, H.G., Stanton, T.R., Pietro, F. and Moseley, G.L. 2013. Social media release increases dissemination of original articles in the clinical pain sciences. PLOS One, 8(7): 1-6.
Bianchini, L. 2012. Social networks for scientists: what social media to use for your research activity. [Online]. https://www.mysciencework.com/news/6400/social-networks-for-scientists (24 July 2014).
Brody, T., Harnad, S. and Carr, L. 2006. Earlier web usage statistics as predictors of later citation impact. Journal of the American Society of Information Science & Technology, 57: 1060–1072.
Burke, F. 2013. Social media vs. social networking. [Online]. http://www.huffingtonpost.com/fauzia-burke/social-media-vs-social-ne_b_4017305.html (4 July 2014).
Cann, A. 2011. Social media: a guide for researchers. [Online]. http://www.rin.ac.uk/our-work/communicating-and-disseminating-research/social-media-guide-researchers (10 March 2014).
Carpenter, J., Wetheridge, L. and Tanner, S. 2012. Researchers of tomorrow: the research behaviour of Generation Y doctoral students. [Online]. http://www.jisc.ac.uk/media/documents/publications/reports/2012/Researchers-of-Tomorrow.pdf (12 July 2014).
Costas, R., Zahedi, Z. and Wouters, P. 2014. Do altmetrics correlate with citations? Extensive comparison of altmetric indicators with citations from a multidisciplinary perspective. [Online]. http://arxiv.org/pdf/1401.4321v1.pdf (7 May 2014).
Cybermetrics Lab. 2014a. Ranking web of universities: South Africa. [Online]. http://www.webometrics.info/en/Africa/South%20Africa (14 April 2014). Cybermetrics Lab. 2014b. Ranking web of universities: methodology. [Online].
http://www.webometrics.info/en/Methodology (14 April 2014).
Dodaro, M. 2014. Social media statistics that will guide your strategy. [Online]. http://topdogsocialmedia.com/social-media-statistics-2014/ (3 March 2014).
Foley, C.J. 2008. An impossible dream? The efficacy of using rankings to improve the perception of a non-OECD1 country’s education system. College and University, 83(4): 24-32.
Harzing, A.W. 2010. Citation analysis across disciplines: the impact of different data sources and citation metrics. [Online]. http://www.harzing.com/data_metrics_comparison.htm (6 March 2015).
International Telecommunication Union. (2010). The rise of social networking: changing the web as we know it. [Online]. http://www.itu.int/net/itunews/issues/2010/06/35.aspx (16 July 2014).
Jung, B. 2014. The negative effect of social impact on society and individuals. [Online].
http://smallbusiness.chron.com/negative-effect-social-media-society-individuals-27617.html (14 August 2014). Konkiel, S. 2012. Altmetrics: An App Review. [Online].
http://eprints.rclis.org/20008/1/Altmetrics%20an%20App%20Review%20-%20OCLC%20-%20skonkiel.pdf (12 June 2014).
Liebeskind, J.P., Oliver, A.L., Zucker, L. and Brewer, M. 1996. Social networks, learning, and flexibility: sourcing scientific knowledge in new biotechnology firms. Organization Science, 7(4): 428-443.
Miah, A. 2013. Top five media platforms for research development. [Online].
http://blogs.lse.ac.uk/impactofsocialsciences/2013/07/26/a-to-z-of-social-media-for-academia/ (16 August 2014). Moed, H.F. 2005. Statistical relationships between downloads and citations at the level of individual documents within a
single journal. Journal of the American Society of Information Science & Technology, 56: 1088–1097.
Mounce, R. 2013. Open access and altmetrics: distinct but complementary. Bulletin of the Association for Information Science and Technology, 39(4): 14-17.
Mulero, S.O. 2012. Acceptance and impact of social networks in marketing using extended technology acceptance model. [Online]. http://digitalknowledge.cput.ac.za/xmlui/handle/11189/263 (14 August 2014).
Nieder, C., Dalhaug, A. and Aandahl, G. 2013. Correlation between article download and citation figures for highly accessed articles from five open access oncology journals. SpringerPlus, 2: 261-265.
Nwagwu, W.E. 2010. Cyberneting the academe: centralized scholarly ranking and visibility of scholars in the developing world. Journal of Information Science, 36(2): 228-241.
O’Keeffe, G.S., Clarke-Pearson, K. and Council on Communications and Media. 2014. The impact of social media on children, adolescents and families. Pediatrics: Official Journal of the American Academy of Pediatrics.
DOI:10.1542/peds.2011-0054.
O’Leary, D.E. 2008. The relationship between citations and number of downloads in decision support systems. Decision Support Systems, 45: 972–980.
Onyancha, O.B. 2008. Authorship patterns of the literature on HIV/AIDS in Eastern and Southern Africa: an exposition of the responsible authors, institutions and countries, 1980-2005. South African Journal of Libraries and Information Science, 74(1): 9-22
Parrack, D. 2012. The negative impact of social networking sites [opinion]. [Online].
http://www.makeuseof.com/tag/negative-impact-social-networking-sites-society-opinion/ (14 August 2014). Pouris, A. and Pouris, A. 2011. Scientometrics of a pandemic: HIV/AIDS research in South Africa and the world.
Scientometrics, 86: 541-552.
Republic of South Africa. Department of Higher Education and Training. 2014. Report on the evaluation of the 2012 universities’ research publication outputs. Pretoria: Department of Higher Education and Training. [Online].
http://www.ul.ac.za/research/application/downloads/Report%20of%202012%20Research%20Outputs%2004.03.14.p df (2 April 2015).
Republic of South Africa. Department of Higher Education and Training. 2015. Report on the evaluation of the 2013 universities’ research publication outputs. Pretoria: Department of Higher Education and Training. [Online].
http://www.dhet.gov.za/Policy%20and%20Development%20Support/Report%20of%202013%20Research%20Output s.pdf (2 April 2015).
ResearchGate.Net. 2015. RG score: a new way to measure scientific reputation. [Online]. https://www.researchgate.net/publicprofile.RGScoreFAQ.html (7 June 2014).
Rogers, S.S. 2015. How do scientists share on academic social networks like ResearchGate? [Online].
http://blog.sciencebite.com/how-do-scientists-share-on-academic-social-networks-like-researchgate/ (01 April 2015). Rousseau, R. and Ye, F.Y. 2013. A multi-metric approach for research evaluation. Chinese Science Bulletin, 58(26):
3288-3290. DOI:10.1007/s11434-013-5939-3.
Thelwall, M. and Kousha, K. 2014. ResearchGate: disseminating, communicating, and measuring scholarship? Journal of the Association for Information Science and Technology. DOI:10.1002/asi.23236.
Appendix A
ResearchGate statistics
University Membership Total papers Total RG score Total impact points Total downloads Total views
No Rank No Rank No Rank No Rank No Rank No Rank
UCT 2,664 1 11,050 1 15,908,89 1 31,144.21 1 47,840 1 99,328 1
SUN 2,168 4 7,109 4 11,953.87 2 16,162.42 3 40,458 2 85,660 2
WITS 2,298 2 9,032 2 11,545.03 3 20,781.36 2 31,746 4 71,482 4
UP 2,236 3 7,890 3 11,006.73 4 12,203.31 5 38,509 3 74,739 3
UKZN 2,115 5 5,748 5 9,581.77 5 13,378.47 4 30,327 5 62,658 5
NWU 1,106 7 761 9 4,446.66 6 1,415.76 10 15,682 6 31,530 6
UOVS 715 11 1,989 6 3,302.29 7 3,299.81 7 12,328 7 21,308 8
UJ 1,102 8 324 16 3,261.88 8 1,674.47 9 11,733 8 26,618 7
UWC 1,084 9 1,246 8 2,861.71 9 1,919.71 8 8,840 10 21,215 10
RU 679 12 1,850 7 2,833.15 10 3,570.82 6 9,437 9 21,255 9
NMMU 746 10 345 15 1,714.86 11 449.19 15 6,700 13 12,412 11
UL 463 16 380 13 1,410.56 12 395.39 16 3,043 16 7,489 15
UNISA 1,381 6 399 11 1,330.48 13 486.97 13 6,981 11 11,313 13
TUT 560 15 367 14 1,301.92 14 476.47 14 6,854 12 11,865 12
CPUT 565 14 198 18 1,030.04 15 238.34 17 4,014 15 6,771 16
UFH 620 13 408 10 1,024.1 16 626.1 11 5,694 14 9,190 14
DUT 347 17 386 12 665.23 17 613.09 12 2,437 17 3,776 18
UNIZUL 136 19 201 17 430.11 18 235.09 18 1,575 19 3,012 19
UNIVEN 136 19 124 19 429.13 19 154 19 1,788 18 3,867 17
CUT 132 21 35 22 222.84 20 29.56 22 949 20 1,844 20
VUT 216 18 58 21 215 21 83.92 21 821 21 1,765 21
WSU 117 22 119 20 206.73 22 121.36 20 310 22 1,263 22
Appendix B
Webometrics Ranking of South African Universities
Overall ranking Presence rank* Impact rank* Openness rank* Excellence rank*
University ZAR World ZAR World ZAR World ZAR World ZAR World
SUN 1 504 1 327 4 981 2 419 3 449
UP 2 549 2 340 5 1,154 1 196 5 612
UNISA 3 1,306 3 432 8 2,375 7 885 14 1,867
DUT 4 3,378 4 650 15 6,443 16 5,084 18 3,133
UCT 5 391 5 760 1 556 4 655 1 268
RU 6 1,060 6 1,039 7 1,880 6 871 6 1,198
UKZN 7 632 7 1,181 3 886 5 677 4 554
WITS 8 690 8 1,600 6 1,310 3 468 2 423
NWU 9 1,689 9 1,613 11 4,545 8 922 8 1,236
UWC 10 885 10 1,941 2 606 12 2,287 9 1,255
UOVS 11 1,926 11 2,207 12 4,704 11 1,823 10 1,275
UJ 12 1,594 12 2,405 9 3,494 9 1,056 7 1,217
NMMU 13 2,245 13 3,739 10 4,134 13 3,202 11 1,601
UNIZUL 14 4,985 14 4,045 18 8,269 15 4,746 18 3,133
CPUT 15 2,802 15 4,828 13 5,227 10 1,805 15 2,219
UFH 17 4,258 16 6,421 16 7,501 18 7,420 13 1,856
TUT 18 3,327 17 6,852 14 6,290 14 3,589 12 1,798
VUT 20 8,048 18 9,453 22 9,427 21 11,034 21 3,412
UNIVEN 22 7,149 19 10,009 21 9,266 20 9,087 17 2,890
CUT 23 8,477 20 10,012 19 9,107 22 12,036 22 3,714
WSU 26 7,490 21 11,263 20 9,243 19 8,166 18 3,133
UL 28 5,587 22 12,152 17 7,992 17 5,476 16 2,293
Appendix C
Web of Science statistics
Papers (p) Sum cited Cited without self-cites Av cites/item H-index
University No. Rank No Rank No Rank No Rank No Rank
UCT 6,914 1 52,571 1 47,438 1 7.6 1 74 1
WITS 6,473 2 40,066 2 35,637 2 6.19 2 65 2
SUN 5,832 3 30,287 3 26,441 3 5.19 3 51 3
UKZN 5,566 4 27,040 4 22,534 4 4.86 5 48 4
UP 5,486 5 18,062 5 15,236 5 3.29 10 40 5
UJ 2,316 6 11,743 6 10,655 6 5.07 4 38 6
NWU 2,049 7 6,787 8 5,647 8 3.31 8 31 7
UOVS 1,786 8 5,219 10 4,250 10 2.92 15 23 10
RU 1,605 9 5,868 9 4,821 9 3.66 7 26 8
UWC 1,544 10 6,872 7 6,139 7 4.45 6 26 8
UNISA 994 11 2,998 11 2,856 11 3.02 13 18 12
NMMU 956 12 2,682 12 2,335 12 2.81 16 20 11
TUT 780 13 2,571 13 2,259 13 3.3 9 18 12
UFH 605 14 1,833 14 1,467 15 3.03 12 17 14
UL 571 15 1,606 15 1,476 14 2.81 16 15 15
CPUT 515 16 1,434 16 1,222 16 2.78 18 14 16
UNIVEN 348 17 669 18 538 18 1.92 21 11 19
UNIZUL 269 18 637 19 532 19 2.37 20 12 17
DUT 259 19 846 17 768 17 3.27 11 12 17
WSU 256 20 457 21 413 21 1.79 22 8 21
VUT 154 21 462 20 421 20 3 14 11 19
CUT 79 22 86 23 86 23 1.09 23 5 23