Modeling and Controlling Isolated Intersections using
Simulated Annealing Approach
Ola B. O.,
Department of Computer Engineering, Osun State Polytechnic, Iree, Nigeria.
Omidiora E. O.,
Department of Computer Science and Engineering, Ladoke AkintolaUniversity of
Technology, Ogbomoso, Nigeria.
Ganiyu R. A.,
Department of Computer Science and Engineering, Ladoke AkintolaUniversity of
Technology, Ogbomoso, Nigeria
All Authors are correspondent Authors
ABSTRACT
There have been concerted efforts from researchers to find efficient techniques for solving traffic congestion problems at road junctions over the years. Traffic congestion results in excess delays, fuel wastages, reduced safety, wear and tear on vehicles. This paper focuses on solving the problem of traffic congestion at isolated Cross and T-type intersections using simulated annealing approach. The existing simulated annealing model was formulated by adding a parameter (mLan) to the initial signal timing plan (iLan) to give the next guess signal timing plan. The formulated model was simulated on a MATLAB environment for twenty cycles with each cycle having two phases at Cross and T-type intersections under consideration. There were three (L1, L2 and L3) and four (L1, L2, L3 and L4) vehicle streams in the T-type and cross intersections, respectively. In the Cross type intersection, the results of the simulation revealed that L4 was the busiest and L3 was the least busy streams with the frequencies of 15 and 3 vehicles, respectively. Similarly, in the T-type intersection, L2 was the busiest and L3 was the least busy streams with the frequencies of 28 and 8 vehicles, respectively. The solution provided in this paper could be useful in studying and improving traffic flow at isolated Cross and T-type intersections.
General Term
Road Traffic ControlKeywords
Traffic congestion, simulated annealing, vehicle stream, intersection, cycle.
1.
INTRODUCTION
Traffic congestion is a condition on road networks that occurs as its use increases, and is characterized by slower speeds, longer trip times, and increased vehicular queuing. The most common example is the physical use of roads by vehicles. When traffic demand is great enough that the interaction between vehicles slow the speed of the traffic stream, congestion is incurred. As demand approaches the optimal capacity of a road (or of the intersections along the road), extreme traffic congestion sets in. When vehicles are fully stopped for periods of time, this is colloquially known as a traffic jam. Cities and traffic have developed hand-in-hand since the earliest large human settlements. The same forces that draw inhabitants to congregate in large urban areas also
lead to sometimes intolerable levels of traffic congestion on urban streets and through fares.
Effective urban governance requires a careful balancing between the benefits of agglomeration and the demerits of excessive congestion. Congestion is one of the major pre-occupations of urban decision-makers. Congestion takes on many faces, occurs in many different contexts and is caused by many different processes. As a result, there is no single best approach to managing congestion. Efficient traffic management and signal control are critical determinant of the quality of operation of arterial systems [11]. Traffic lights are sometimes centrally controlled by monitors or by computers to allow them to be coordinated in real time [6]. Congestion arises out of the conjunction of two factors; the first is that every process has a finite capacity. The second is that every process has a stochastic character. There are some degrees of randomness in both the demands placed on a process to service those demands [9]. Whenever the total input rate is greater than the output link capacity, congestion occurs. When the network becomes congested, the queue lengths may become very large.
Many researchers had worked and proffered solutions to problems of road traffic control. A formulation of the traffic signal network optimization strategy was presented in [12] that models traffic streams and includes constraints in the signal controllers. However, the resulting formulation led to a complex mixed integer linear programming problem solved by branch and bound techniques. In addition, [8] adopted a cell-transmission macroscopic model that allows stating optimization problems and providing dynamic signal timing plans. However, solving the resulting mixed integer program is computationally intensive and the formulation for real networks requires heuristics for solutions.
the intersections, which is illustrated in a hybrid Petri net model developed in [2].
In addition, [3] proposed an urban traffic actuated control strategy to determine in real time the green splits for a fixed cycle time in order to minimize the number of vehicles in queue in the considered signalized area. The aim was to give a contribution in facing the apparently insurmountable difficulties in the real time solution and realization of the control loop governing an urban intersection by traffic lights [10]. In [4], a Time Coloured Petri Net model that could provide baseline information for traffic management in a multi-phase traffic light controlled intersections was developed. Also, in [5], Timed Coloured Petri Net models of two isolated multi-phase traffic light controlled intersections were analyzed.
2.
METHODOLOGY
2.1
Simulated Annealing Process for
Traffic Decongestion at Isolated Cross
and T-type Intersections
In this research, simulated annealing process is modified to solve the problem of traffic control in a hypothetical isolated cross and T-type intersections. Following the simulated annealing process, Fit 1, Fit 2, Fit 3 and Fit 4 as well as Fit 1, Fit 2, and Fit 3 represent the best average fitness values of the lanes in the cross and T-type intersections, respectively. These values are stored in a location called iLan that represents the initial solution (S0). Kmax represents the temperature in the
entire process and it decreases as the annealing process proceeds. K represents the freezing point F. While Kmax is greater than K, a parameter mu that represents Boltmman constant is set to 10(k/kmax)q 100. mLan which is the parameter for testing optimal solution equals rand (size (iLan -1) mu -1. i.e. mLam = rand (size (iLan -1) mu -1. This parameter is added to the initial solution to give the next guess solution nLan i.e. nLan = iLan + mLan. This is the solution in the neighborhood of S. If k is less than kmax, the temperature is updated i.e. k = k + 1, but if k is equal to kmax, the new solution is accepted. This implies that S0 is equal to S
i.e. S0 =S.
2.2
Flow Models for the Isolated Cross and
T-type Intersections
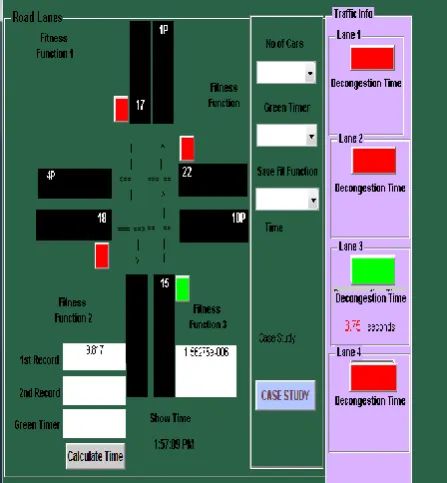
Figures 1 and 2 show the flow diagram of simulated annealing to decongest traffic in a hypothetical cross and T-type junction respectively. The two control signals used in the proposed model are green and red signals. The red signal ensures that there is no movement of vehicles as long as the indicating signal for that lane is red, while the green signal is used in order to give right of way to the busiest lane per time thereby permitting flow of vehicle out of the lanes. It switches to the next most congested lane as soon as the time allocated to the lane has elapsed.
Using simulated annealing algorithm, as depicted in Figure 1, the flow diagram was designed in such a way that it permits the initialization of various inputs that will be needed to control traffic. These inputs include: “TN” which indicates the total number of cycles and is initialized to be 20, “Path” is the counter for the total path taken and is initialized to be 1. “C” is the counter for the total number of cycles and is initialized to be 1. TL1, TL2, TL3 and TL4 represent traffic lights. “K” is the counter for the iteration and it is set to 1. “q” is the quenching factor that cools down the model and it is equal to
1. “R” and “G” are the red and green signals respectively. Random number of vehicles are generated for each of the four lanes, this represent the number of vehicles on queue. Each lane permits flow of vehicles in and out such that there is an entry and exit point for every lane forming the intersection. The decongested vehicles move to the remaining other lanes at their exit points. The fitness values of the lane are Ft1, Ft2, Ft3 and Ft4 and the time lost are t1, t2, t3 and t4. If the maximum path is met, the model outputs the traffic path taken, the average total time for the traffic path, the average fitness values for each cycle and the average time lost. The fitness values of each cycle are stored with the corresponding average time lost during decongestion. The cycle with the least time lost has the best fitness value. Also, the flow diagram for the T-type intersection shown in Figure 2 was designed just as it was for the cross type intersection.
2.3
Model Implementations
Figure 1: Flowchart for decongesting traffic at an isolated cross type intersection
Figure 2: Flowchart for decongesting traffic at an isolated T- type intersection
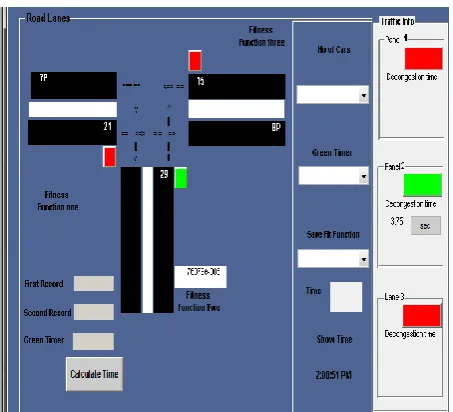
Figure 4: An isolated T-type intersection interface depicting traffic information
3.
RESULTS AND DISCUSSION
Figures 5 and 6 show the graph of average number of vehicles behind the green light against cycles in both the Cross and the T type intersections. From Figure 5, cycle 13 has the least number of vehicles behind the green light; it is considered as the cycle with the least traffic volume. Cycle 1 has the highest number of vehicles behind the green light; this is therefore considered as the cycle with the maximum traffic volume. From Figure 6, cycle 4 has the least number of vehicles behind the green light; it is considered as the cycle with the least traffic volume. Cycle 10 has the highest number of vehicles behind the green light; it is therefore considered as the cycle with the maximum traffic volume.
Table I shows the rate of decongestion of lanes of the Cross type intersection under consideration. As depicted in Table I, Lanes 1, 2 and 4 had maximum traffic volumes during four cycles (5, 6, 12 and 13), three cycles (2, 16 and 18) and five cycles (4, 5, 8, 9 and 11), respectively. Equal traffic volumes were experienced during nine cycles (1, 3, 7, 10, 14, 15, 17, 19 and 20). Additionally, Table II shows the frequency analysis of lanes decongestion, the total traffic rate and the average traffic per lane for the Cross type intersection. From the Table II, it could be deduced that Lane 4 is the busiest lane; it has the maximum traffic volume with the frequency of 15. Similarly, Lane 3 is the least busy lane; it has the minimum traffic volume with the frequency of 3.
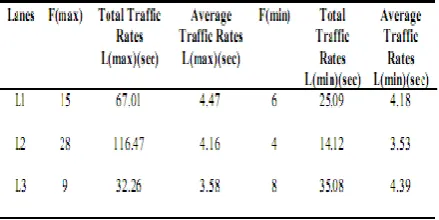
Furthermore, Table III depicts the rate of decongestion of lanes of the T-type intersection under consideration. As shown in Table III, Lanes 1, 2 and 3 had the maximum traffic volumes during five cycles (3, 7, 10, 11 and 14), eight cycles (4, 6, 8, 13, 15, 17, 19 and 20) three cycles (1, 2 and 12), respectively. Equal traffic volumes were experienced during three cycles 5, 16 and 18. Table IV shows the frequency analysis of lanes decongestion, the total traffic rate and the average traffic per lane for the T- type intersection. From the Table IV, it could be inferred that Lane 2 has the maximum traffic volume; hence it is considered as the busiest lane with the frequency of 28 while Lane 3 has the minimum traffic volume (the least busy lane with the frequency of 8).
Figure 5: Average number of vehicles behind the green light against cycles in the Cross type intersection
Figure 6: Average number of vehicles behind the green light against cycles in the T-type intersection
Table II: Frequency analysis of lanes decongestion and average traffic rate for cross-type intersection
Table III: Rate of decongestion of lanes and the average total time taken (secs) for the T-type intersection
Table IV: Frequency analysis of lanes decongestion and average traffic rates for T-type intersection
4. CONCLUSION
In this paper, we have been able to model and control isolated Cross and T-type intersections using simulated annealing approach. At both Cross and T-type intersections under consideration, there were three and four intersection movements, respectively. A green light only enabled a lane within a phase in Cross or T-type intersection while other lanes were disabled with red lights. The simulation of the formulated simulated annealing model was carried out successfully based on the assumptions that there were normal passages of vehicles every time at the aforementioned intersections (devoid of breakdown of vehicles, bad behavioral attitudes of drivers and so on). The results of the simulation revealed that within each cycle, all the lanes were touched. In the cross type intersection, lane L4 was the busiest and lane L3 was the least busy lane with the frequencies of 15
and 3 respectively. In the T-type intersection, lane L2 was the busiest and lane L3 was also found to be the least busy lane with the frequencies of 28 and 8 respectively. Thus, the solution provided in this work would be useful in decongestion traffic at isolated Cross and T-type intersections. Also, the formulated simulated annealing model could be used in studying traffic flow for arrays of vehicles in cross and T-type intersections.
5. REFERENCES
[1] Diakaki, C., Papageorgiou, M. and Aboudolas, K. (2002): “A multivariable regulator approach to traffic-responsive network-wide signal control”, Control Engineering Practice, Vol. 10, No. 2, pp. 183-195.
[2] Di Febbraro, A., Giglio, D. and Sacco, N. (2004): “On applying Petri nets to determine optimal offsets for coordinated traffic light timings”, Proceedings of the 5th IEEE International Conference on Intelligent Transportation Systems, Singapore, pp. 687-706.
[3] Dotoli, M., Fanti, M. P. and Meloni, C. (2006): “A signal timing plan formulation for urban network control”, Contr. Eng. Pract., vol. 14, pp. 1297-1311.
[4] Ganiyu, R. A. (2011): “Modelling and Simulation of Multi-Phase Traffic Light Controlled Intersections Using Timed Coloured Petri Nets”, An unpublished Ph.D Thesis, Ladoke Akintola University of Technology, Ogbomoso, Nigeria.
[5] Ganiyu, R. A., Olabiyisi, S. O., Omidiora, E. O., Okediran, O. O and Alo, O. O. (2011): “P- invariant Analysis of Timed Coloured Petri Net Models of Two Isolated Multi-Phase Traffic Light Controlled Intersections”, International Journal of Applied Science and Technology, USA, Vol. 1, No. 4, pp. 29-41.
[6] Lee, A.D, Baker, B. and Spall, J.C. (2003): “A Genetic Algorithm for the Vehicle Routing Problem” IEEE Transactions on Automatic Control, Vol.19, pp. 32-34.
[7] Lei, J. and Ozguner, U. (2001): “Decentralized hybrid intersection control”, Proceedings of 40th IEEE International Conference on Decision and Control, pp. 1237-1242.
[8] Lo, H. K. (2001): “A cell-based traffic control formulation: strategies and benefits of dynamic timing plans”, Transportation Science, Vol. 35, No. 2, pp. 148-164.
[9] Marvin, L. Manhein, (1979): “Fundamentals of Transportation Systems Analysis Basic Concepts”, Massachusetts Institute of Technology, USA.
[10] Papageorgiou, M., Diakaki, C., Dinopoulou, V., Kotsialos, A. and Wang, Y. (2003): “Review of road traffic control strategies”, Proceedings of the IEEE, Vol. 91, No. 12, pp. 2043-2067.
[11] Schuster. J. I. (2001): “Traffic control at Road Junction Using Genetic Algorithm”, National Research Council, Vol.4, No 1, pp 22-30