R E V I E W
Open Access
Improving quality of foreign direct
investment attraction in Vietnam
Ngo Phuc Hanh
1,2*,
Đ
ao Van Hùng
1,2, Nguyen Thac Hoat
1,2and Dao Thi Thu Trang
3* Correspondence:
nphanh39@gmail.com
1Academy of Policy and Development—APD, Hanoi, Vietnam
2
Ministry of Planning and Investment, Hanoi, Vietnam Full list of author information is available at the end of the article
Abstract
Foreign direct investment (FDI) enterprises are playing a key role in Vietnam’s economy. By the end of 2016, there are more than 21,398 FDI projects in force, with the total registered capital of nearly 293 billion USD. One hundred six countries and territories have invested in 19 industries in 68 provinces and cities of Vietnam. These investments have added a large amount of capital to the economy, which has basically been used effectively, contributing to the economic growth of Vietnam. In this context, the study focuses on the analysis of statistical data from 1988 to 2016 on the sources of funds, the number of projects, the invested sectors, and countries invested in Vietnam; research also includes three main factors that affect the quality of FDI attraction in Vietnam, namely resources, infrastructure, and other support policies. In this study, the support policy factor is thought to have the greatest impact. In addition to the use of statistical techniques, quantitative research is also applied to three data analysis techniques, including descriptive statistics, scale reliability analysis, and regression analysis, to verify the hypothesis. Policy implications are also proposed in this study to improve the quality of FDI attraction in Vietnam in the coming years.
Keywords:Quality, Foreign direct investment (FDI)
Background
As one of the most critical point of economic reform policies, the Foreign Investment Law in Vietnam was first enacted in December 1987 and then became the basic legal framework specifying Vietnam’s point of view about opening and integration. There are some fluctuations, but the FDI sector in particular and external economic activities in general has shown a positive role in the achievement of growth and development of Vietnam for nearly 30 years. According to the General Statistics Office of Vietnam (GSO), average annual economic growth was 7.3%, and GDP per capita rose by 5.7% over the period 1990–2004 and expanded 6.40% in the September quarter of 2016. GDP growth rate in Vietnam averaged 6.17% from 2000 until 2016, reaching an all-time high of 8.46% in the fourth quarter of 2007 and a record low of 3.14% in the first quarter of 2009. Meanwhile, property rate fell from roughly 80% in 1986 to around 29% in 2002, Vietnam’s poverty rate fell from 14.2% in 2010 to 4.5% in 2015. Vietnam aims to reduce its poverty rate 1.3–1.5% in 2016. For the past decade, Vietnam has al-ways been among the rapidly growing economies with sharp poverty reduction in the world [1–3].
In the first phase of opening, FDI was an effective solution to help Vietnam out of the tricky situation of siege and embargo. In the next stage, FDI is an important additional capital in the total investment of the whole society, contributing significantly to the promotion of economic restructuring, the increase of production capacity, the innovation of technology, the breakthrough in international markets, the increase in exports, the improvement of the international balance of payments, the contribution of state budget, the development of high-quality human resources, and the creation of additional jobs.
FDI in Vietnam has major influence on other economic sectors, namely stimulat-ing the domestic investment, creatstimulat-ing the competition, promotstimulat-ing the innovation and the transfer of technology, improving production efficiency, and developing the supporting industries that all help Vietnam participate in the value chain of global production. Today, Vietnam has become an appealing destination of many leading corporations around the world in different fields, such as BP, Total, Toyota, Canon, Samsung, Intel, Unilever, etc. with products of international quality, which not only has a great contribution to consolidate the position of Vietnam on the region and the world, but has also created the competitive motivation for the domestic enterprises to adapt in the context of globalization. FDI also plays an active role in supporting the process of reform of state enterprises, encouraging administrative procedures to reform and fulfill the market economy.
Up to now, Vietnam has attracted nearly 290 billion USD in foreign direct in-vestment (FDI) with more than 22,000 projects from 114 countries and territories and has disbursed nearly $145 billion [4].
After nearly 30 years, FDI is distributed throughout Vietnam. Funds come primarily from Asian countries such as Japan, China, Hong Kong, Taiwan, Korea, and Singapore (accounting for 70.6%) or from European countries such as Germany, France, the UK (8.8%), the Americas including the USA, Canada (accounting for 7.7%), and Australia (2.7%); the rest are other partners. The average of used FDI accounts for 25% of social capital annually. This is an important fund to support economic development [1, 5].
FDI sector has a positive impact on the restructuring of economic sectors and the orientation of industrialization in Vietnam. From 2000 to 2015, the percentage of FDI in economic structure increased by 5.4%, while the public sector and the private sector decreased respectively. FDI sector accounted for about 45% of the total industrial production value, contributing to the formation of the key industrial sectors including telecommunications, oil and gas, electronics, chemicals, automo-tive, motorcycle, public information technology, steel, cement, food processing agricultural products, footwear, garment, etc. The majority of FDI enterprises operate in the fields of high-tech industries such as mining and oil and gas, electronics, telecommunications, office equipment, and computers. FDI restructured agricultural structure, diversified the types of product, improved the value of expectedly agricultural goods, and acquired a number of advanced technologies and high-quality international standard seeds and breeds. However, the percentage of FDI accounted for less than 3% of the output of the agricultural industry [1, 5].
hotels, and office leasing has changed the appearance of some major urban and coastal areas. Many recreation areas such as golf, bowling, and gambling areas created attract-ive conditions for investors and international tourists. In Vietnam, the other areas such as education, training, and health care did not initially attract FDI but later were invested in several high-quality institutions, some modern hospitals and clinics which served the needs of the high-income population and foreigners living in Vietnam.
This study will analyze the specific situation of attracting foreign direct invest-ment in Vietnam during the period from 1988 to 2015 and propose some sugges-tions to improve the quality of FDI attraction in Vietnam. Additionally, for the purpose of verifying the claims, the authors of the study also applied the survey method to collect additional opinions of company groups in assessing the factors affecting the quality of attracting FDI projects in Vietnam with the focus on three main factors: resources, infrastructure, and other support policies.
Literature review, research model, and methodology
Literature review and research model
Foreign direct investment (FDI) is defined as an investment involving a long-term relationship and reflecting a lasting interest and control by a resident entity in one economy (foreign direct investor or parent enterprise) in an enterprise resident in an economy other than that of the foreign direct investor (FDI enterprise or affiliated enterprise or foreign affiliate) [6]. According to the World Trade Organization [7], FDI occurs when an investor based in one country (the home country) acquires an asset in another country (the host country) with the intent to manage that asset [8]. The management dimension is what distinguishes FDI from portfolio investment in foreign stocks, bonds, and other financial instruments. In most instances, both the investor and the asset it manages abroad are business firms. In such cases, the investor is typically referred to as the “parent firm” and the asset as the “affiliate” or “subsidiary.” FDI is the net inflows of investment to acquire a lasting management interest (10% or more of voting stock) in an enter-prise operating in an economy other than that of the investor. It is the sum of equity capital, reinvestment of earnings, other long-term capital, and short-term capital as shown in the balance of payments [6]. Studies have shown the special role of FDI in developing economies such as resolving employment issues [9], addressing the lack of investment capital [10], economic restructuring [10], provid-ing modern technology, or transferrprovid-ing management experiences to local busi-nesses. FDI is a type of long-term investment of individuals or companies in one country to another country by establishing the subsidiary companies or new businesses. Those individuals and companies will take the control of these enterprises. According to Law on Foreign Investment in Vietnam, 1996, FDI is “The foreign investors bring into Vietnam the capital or any assets to carry out investment activities in accordance with the law of Vietnam.”
or precious natural resources. However, Mayer et al. [12] state that access to eco-nomic resources is becoming more important due to the growing concerns of local authorities on the adverse effects of FDI. Lipsey [13] also emphasized that foreign companies want to increase long-term investment in developing countries to seek resources while the host country considers FDI as a source of capital to improve economic development and access to modern technology. Another factor, according to Sullivan and Sheffrin [14], infrastructure, is defined as the whole of the product-ive relationships that constitute the economic structure of a gproduct-iven society. Khadaroo and Seetanah [8] have argued that growth in infrastructure is defined as an indicator for higher transport performance or lower transportation costs. Iwanow and Kirkpatrick [15] determined that when infrastructure was improved by about 10%, the efficiency of developing country exports would be increased by 8%. In a study on the relationship between policies and FDI, according to Prokopenko [16] FDI inflows are influenced by a series of local government policies to improve globalization and national competitiveness.
The research model has been established as follows (Fig. 1): Research questions and hypotheses:
H1: The resources with a positive impact on the quality of FDI attraction in Vietnam. H2: The infrastructure with a positive impact on the quality of FDI attraction in Vietnam.
H3: The support policies with a positive impact on the quality of FDI attraction in Vietnam.
Methodology and data
This study is based on the annual time series data set in Vietnam ranging from 1998 to 2015. The data were obtained and calculated by the General Statistics Office (GSO), the Foreign Investment Agency (FIA) of Ministry of Planning and Investment of Vietnam, and the World Development Indicators published by the World Bank (WB), the International Monetary Fund (IMF) for Vietnam. Because the data of FDI were registered in US dollar, they were converted into Vietnamese dong using yearly average exchange rate. The authors analyzed the quality of foreign direct investment attraction
in Vietnam in the period 1998–2015 by applying time series analysis techniques and statistical method.
However, to find more bases for the statement, the authors apply the survey method to collect ideas from the group of enterprises affected by three factors affecting the quality of FDI attraction in Vietnam: resources, infrastructure, and support policies. The method of data collection was done via questionnaire surveys sent to FDI enter-prises in Vietnam. There were 500 sent questionnaires, and 485 valid answers were collected. Based on the data collected, the authors perform a number of statistical ana-lysis methods including the calculation of the Cronbach’s alpha coefficient to test the reliability of the research scale and the linear regression to estimate the influence of research factors on the quality of FDI attraction in Vietnam. Mathematically, these ef-fects can be measured through linear regression, in which the quality of FDI attraction in Vietnam is considered to be the dependent variable and the mentioned three factors are the independent variables. The linear regression equation was cited by Cresswell [17] and Hair et al. [18] as follows:
QFDI¼W0 þ W1 Rs þ W2 I þ W3 Ps þ e
in which QFDI is the quality attracting FDI in Vietnam, Rs represents the resources, Iis the infrastructure, Ps is the support policy factor, andeis the estimated error. Data are analyzed with the support of SPSS 20. Muijs [19] argues that SPSS is not the best tool, but it is the most popular software in academic research.
Data analysis of the reality of attracting foreign direct investment (FDI) in Vietnam between 1988 and 2015
FDI attraction through the registered capital and implemented capital
Based on the volatility of FDI flow into Vietnam, the development process of FDI can be divided into four (04) stages as follows (Table 1):
– In the period of 1988–1997:
The three-year period of 1988–1990 is considered the warm-up period. Since 1991, it was taken over by the first FDI wave with the fast pace of FDI attraction; the annual average increased by 50% of registered capital, by 45% of realized capital, and was higher than the average growth rate of total social capital (23%). The registered capital reached $31.6 billion; the realized capital was $13.37 billion, equivalent to 37.5% of the registered capital [1, 2].
– In the period of 1998–2004:
This is a recession period of FDI. The registered FDI decreased to $5590.7 million in 1997, $2012.4 million in 2000, and $4547.6 million in 2004. The annually averaged realized capital was $2.54 billion, equivalent to 78% of the realized capital in 1997. The registered FDI reached $23.88 billion; the realized capital was $17.84 billion, accounting for 75% of registered capital [1, 2].
This is the emerging second FDI wave. The registered FDI was $6.838 billion in 2005, $12.004 billion in 2006, $21.347 billion in 2007, and $71.7126 billion in 2008. The registered capital reached $111.918 billion, and the realized capital was $26.934 billion, accounting for 24% of the registered capital, and it was 4.68 times more than the registered capital and 1.5 times greater than the realized capital compared to the last period [1, 2].
– In the period from 2000 to April 2016:
Registered capital reached a peak in 2008 before decreasing in recent years; however, the realized capital was still stable, averaged at $10–11 billion. The registered capital
Table 1The number of projects and registered FDI from 1988 to 2016
Year Number of projects
The registered FDI (million USD)
The scale of projects (million USD/project)
Compared to the last year Number of
projects (%) The registered FDI (%)
The scale of projects (%)
1988 37 371.8 10.05
1989 68 582.5 8.57 183.8 156.7 85.2
1990 108 839 7.77 158.8 144.0 90.7
1991 151 1322.3 8.76 139.8 157.6 112.7
1992 197 2165 10.99 130.5 163.7 125.5
1993 269 2900 10.78 136.5 133.9 98.1
1994 343 3765.6 10.98 127.5 129.8 101.8
1995 370 6530.8 17.65 107.9 173.4 160.8
1996 325 8497.3 26.15 87.8 130.1 148.1
1997 345 4649.1 13.48 106.2 54.7 51.5
1998 275 3897 14.17 79.7 83.8 105.2
1999 311 1568 5.04 113.1 40.2 35.6
2000 371 2012.4 5.42 119.3 128.3 107.6
2001 555 3142.8 5.66 149.6 156.2 104.4
2002 808 2998.8 3.71 145.6 95.4 65.5
2003 791 3191.2 4.03 97.9 106.4 108.7
2004 811 4547.6 5.61 102.5 142.5 139.0
2005 970 6838.8 7.05 119.6 150.4 125.7
2006 987 12,004.5 12.16 101.8 175.5 172.5
2007 1544 21,347.8 13.83 156.4 177.8 113.7
2008 1557 71,726.8 46.07 100.8 336.0 333.2
2009 1208 23,107.3 19.13 77.6 32.2 41.5
2010 1240 19,886.8 15.94 102.6 85.5 83.3
2011 1091 15,618.7 13.47 88.0 74.4 84.5
2012 1287 16,348.0 12.70 117.9 104.6 94.2
2013 1530 22,352.2 14.60 118.8 136.7 114.9
2014 1843 20,230.0 11.89 120.4 91.0 81.4
2015 2120 22,757.0 11.37 115 112.0 95.6
reached $67.1 billion, and the realized capital was $39.28 billion, accounting for 58.5% of the registered capital.
Over nearly 30 years of attracting foreign direct investment, the foreign direct investment (FDI) played a significant role in economic and social development. The total amount of the registered FDI (cumulative) reached $313,552.6 million, while the total amount of the realized capital reached $138,692.9 million, equivalent to 44.23% by the end of 2015 [1, 2].
Until 20 November 2016, Vietnam has attracted 2240 new FDI projects with a total registered capital of $18,103.0 billion, a 96.1% increase in the number of projects and an 89.5% increase in the registered capital compared to the same period in 2015. At the same time, there are 1075 projects, increasing the registered capital to the total amount of $5075 billion [4]. The FDI projects are expected to improve human resources quality, develop local supply systems, and increase domestic enterprises’ competitive capability in joining global supply chains (Fig. 2).
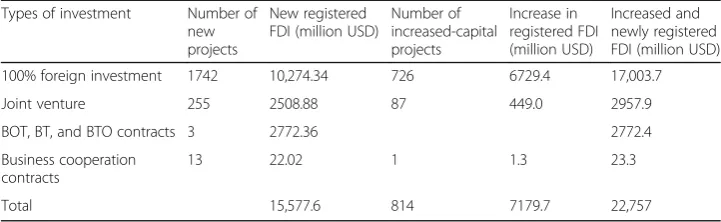
Types of foreign direct investment in Vietnam
Of all the valid FDI projects in Vietnam today, there are mainly traditional types of invest-ment. The investments could be 100% foreign investment, joint venture, build-operate-transfer (BOT), build-build-operate-transfer (BT), build-build-operate-transfer-operate (BTO), and business cooperation contracts.
For the 100% foreign investment type, there were only 854 new businesses in 2000 but the number of businesses increased to 7543 enterprises in 2013 (accounting for 83% of all FDI enterprises), about 8.8 times higher than the year 2000. The average of the period of 2000–2015 increased approximately 20% per year [2].
For the type of joint venture, the number of enterprises increased from 671 units to 1550 units between 2000 and 2013, respectively (accounting for 17% of the number of FDI enterprises), 2.3 times as high compared to that in 2000; the annual average of the period of 2000–2015 increased by 7.2% [2] (Table 2).
Fig. 2The number of projects
Table 2Different types of FDI in 2015
Types of investment Number of new projects
New registered FDI (million USD)
Number of increased-capital projects
Increase in registered FDI (million USD)
Increased and newly registered FDI (million USD) 100% foreign investment 1742 10,274.34 726 6729.4 17,003.7
Joint venture 255 2508.88 87 449.0 2957.9
BOT, BT, and BTO contracts 3 2772.36 2772.4
Business cooperation contracts
13 22.02 1 1.3 23.3
The direct investment of countries and territories into Vietnam
Presently, there are 116 countries and territories having FDI projects in Vietnam, led by Korea, Japan, and Singapore; the specific data is presented in Table 3; Fig. 3.
Among the countries investing FDI into Vietnam, Korea currently leads with a total investment of new and expanded FDI of $44,452.4 million. In the period of 1995–1997, the investment from Korea into Vietnam is moderate (less than $1 billion); most of them were the small and medium-sized projects focusing light industries such as tex-tiles and footwear. From 1997 to 2004, investments have declined in the lowest amount of $15.2 million in 1997. However, the investments increased dramatically between 2005 and 2011 from Korea, with 3.112 projects, representing a total of $23,960.5 mil-lion. There were 3197 projects with the capital of $24,816.0 million in 2012; while the figures were 3611 projects and $29,653.0 million respectively, and Korea became the biggest investor in Vietnam in 2 years, 2014 and 2015 [2].
The second largest investor is Japan with 2830 projects, representing a total invest-ment of $39,176.2 million. Japanese investinvest-ments were stable at over $500 million between 1995 and 1998. However, the investment decreased significantly from 1998 to 2003 and the amount of Japanese investment was at the lowest at $71.6 million in 1999. Since 2004, the investment from Japan had a marked improvement when it continued to increase and peaked at $7.6 billion of the registered capital in 2008. Because of the impact of the global economic crisis in 2009, FDI from Japan has fallen to $715 million, 10 times lower than that in 2008. Since 2010, the investment recov-ered, and until 2015 total registered investment reached $39,176.2 million [1, 2].
Singapore is the third country to invest substantially in Vietnam with 1497 projects and a total investment of $34,168.2 million. From the period of 1995–2015, so far, Singapore has maintained its position as a major partner investing in Vietnam (except for 2008). However, the regional monetary crisis between 1997 and 1998 has negatively affected the investment from Singapore to Vietnam. Within 6 years of the crisis (from 1999 to 2005), the amount of Singapore’s investment fell considerably and remained at the lowest point compared to the period of 1995–1996. It was not until 2006, when Vietnam deployed the Vietnam-Singapore Framework Agreement to connect the two economies, the new investment from Singapore rebounded before a decrease in 2009
Table 3Nations and territories have invested the largest FDI in Vietnam
No. Investment partners Number of projects The total registered FDI (USD) The average project size (million USD/DA)
1 Korea 4892 44,452.4 9.08
2 Japan 2830 39,176.2 13.84
3 Singapore 1497 34,168.2 23.10
4 Taiwan 2497 29,866.7 11.96
5 British Virgin Islands 603 19,209.2 0.03
6 Hong Kong 972 16,799.1 0.01
7 Malaysia 516 13,282.9 0.02
8 USA 779 11,217.9 0.01
9 China 1271 8718.7 6.85
due to the world economic crisis and then increased again in 2010, but it has decreased slightly in recent years [20, 21].
Up to now (December 2016), with 65 countries and territories having investment projects in Vietnam, Korea is leading with a total investment of newly registered and additional capital of 5.58 billion USD, accounting for 34% of total investment in Vietnam; Singapore is the second with newly registered and additional capital of $1.84 billion, accounting for 11.2% of total registered capital; Japan is taking the third place with a newly registered and additional capital of $1.7 billion, accounting for 10.3% of total investment.
Foreign direct investment by the key industries and fields
By the end of 2015, the processing industry and the manufacturing industry had the highest amount of FDI as well as the highest number of projects, with $156,739.9 million and 10,555 projects accounting for 56.89% of a total of registered investment. Investments in the real estate area were in the second place; although the number of projects was not high, the scale was large with $50,674.5 million in total, accounting for 18.39% of total FDI (Table 4).
Although the agriculture, forestry, and fishery industries were encouraged, these fields attracted very few projects. By the end of 2015, there were only 546 valid FDI projects with total investment of $3989.3 million, accounting for 1.44% of total FDI in Vietnam. The scale of FDI of the projects was small; they were mainly used in livestock production, poultry feed production, and processing of poultry products for domestic consumption and export [22].
Foreign direct investment by the region
The southeast region is the region attracting the highest amount of FDI with 10,631 projects and $112,053.9 million of the registered capital, accounting for 42.75%. The second was the Red River Delta with 5978 projects and $65,789.7 million of the regis-tered capital, accounting for 25.10%. North Central and Central Coast regions also had 1185 projects and registered capital of $51,834.5 million, accounting for 19.77%. The
Highland was the region that attracted the least FDI with 156 projects and total regis-tered capital of $859.9 million, about 0.32% [22] (Table 5).
Therefore, it can be seen clearly that there was a significant difference between regions, the plains and the mountains, the wealthy places, and the poor places. FDI projects are concentrated mainly in the Red River Delta, Southeast, and North Central and Central Coast regions. Because most of the largest industrial areas are gathered here and they have good infrastructure, convenient credit services, such as banking and developed transport system, these regions are attracting many investors.
Table 4FDI in Vietnam by the industries
No. Specialty Number of
projects
The total registered FDI (USD)
Proportion of registered capital (%) 1 The processing industry and the manufacturing
industry
10,555 156,739.9 56.89
2 The real estate business 487 50,674.5 18.39
3 Production and distribution of electricity, gas, water, and air condition
107 12,584.1 4.56
4 Construction 1278 12,137.0 4.40
5 Lodging and food service 430 11,315.8 4.10
6 Wholesale and retail trade; repair 1689 4572.7 1.65
7 Information and communication 1259 4221.2 1.53
8 Agriculture, forestry, and Seafood 546 3989.3 1.44
9 Transportation and storage 499 3896.1 1.41
10 Arts and entertainment 149 3637.1 1.32
11 Extractive 89 3385.7 1.22
12 Professional activities and science and Technology
1907 2047.5 0.74
13 Health and social assistance 107 1767.9 0.59
14 Water supply and waste treatment 41 1361.1 0.49
15 Finance, banking, and insurance 82 1333.5 0.48
16 Education and training 243 849.1 0.30
17 Other services 155 729.1 0.26
18 Administrative and support services 156 263.4 0.09
Total 19,691 275,473.0 100
Table 5FDI in Vietnam by the regions (including oil and gas)
No. Regions Number of projects The total registered FDI (USD)
Proportion of registered capital (%)
1 South East 10,631 112,053.9 42.75
2 The Red river delta 5978 65,789.7 25.10
3 North Central and South Central Coast 1185 51,834.5 19.77
4 The Mekong Delta 151 15,723.3 5.99
5 The Northern midlands and mountains 622 12,932.2 4.93
6 Oil and gas 55 2870.3 1.13
7 The Highlands 156 859.9 0.32
Key findings and discussions
Descriptive statistics
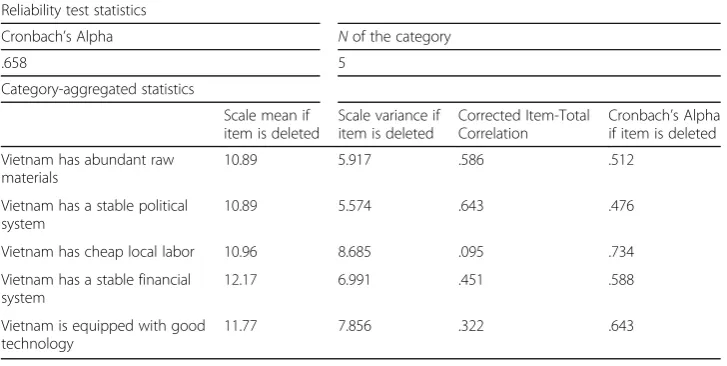
Analyzing the reliability tests of Vietnam’s resources
As Table 6 shows, Cronbach’s alpha of the resource factor is 0.658, higher than 0.6. However, the Item-Total statistics table shows that the third attribute has a Corrected-Item Total Correlation of 0.095, and this number is less than 0.3 so this attribute will be excluded from the reliability test analysis. When the third attribute is excluded, the Cronbach’s alpha value is 0.734, higher than 0.6. Therefore, all the requirements for analyzing tree-level reliability are fulfilled. Among the attributes, the cheap local labor resource scores the highest in Corrected-Item Total Correlation, which means that cheap labor is viewed as an important part of assessing the quality of FDI attraction in Vietnam. In fact, Vietnam is known to be a good place for foreign investment because local labor is plentiful and cheaper than other countries in the region. On the other hand, Vietnam should consider labor in rural areas where labor costs are lower than in other areas, and labor quality factors are not included in this case.
Reliability test on the infrastructure of Vietnam As Table 7 shows, the Cronbach’s
alpha value of this factor is greater than 0.6 while all the attributes of this factor have a Corrected Item-Total Correlation value of 0.3, so the requirements for analytical testing reliability is fulfilled. Among five attributes of the infrastructure factor, the third attri-bute is the highest in the Corrected Item-Total Correction (0.722), which demonstrates the fact that Vietnam’s existing infrastructure transportation network has the highest impact on the quality of FDI attraction. This is true since the infrastructure in the de-livery network will ensure the efficiency of the operation of FDI projects in Vietnam, and the inadequate transport network will degrade the quality of the FDI attraction be-cause foreign investors will consider the efficiency of business operations.
Testing the reliability of the support policies of Vietnam As Table 8 shows, the
Cronbach’s alpha value is 0.852, higher than 0.6. In addition, all attributes of this factor have a Corrected Item-Total Correction of 0.3. Therefore, all requirements for
Table 6Descriptive statistics on Vietnam’s resources
Reliability test statistics
Cronbach’s Alpha Nof the category
.658 5
Category-aggregated statistics
Scale mean if item is deleted
Scale variance if item is deleted
Corrected Item-Total Correlation
Cronbach’s Alpha if item is deleted Vietnam has abundant raw
materials
10.89 5.917 .586 .512
Vietnam has a stable political system
10.89 5.574 .643 .476
Vietnam has cheap local labor 10.96 8.685 .095 .734 Vietnam has a stable financial
system
12.17 6.991 .451 .588
Vietnam is equipped with good technology
reliability testing are fulfilled. Among five attributes of the supportive policy factors, the way local governments implement policies to support administrative procedures plays a vital role in increasing the quality of attracting FDI projects into Vietnam. In fact, when Vietnam reforms administrative procedures, it will be of particular interest to investors.
Linear regression results and hypothesis testing
These four factors can explain the 66.8% of the dependent variable being the quality of FDI attraction in Vietnam in the coming years. This is rather high because Hair et al. [18] asserts that anyR-squared value in linear regression greater than 0.5 is considered to be a good cor-relation between dependent and independent variables. Furthermore, all factors are statisti-cally significant at 5% of the confidence interval as Sig value is lower than 0.05 (all Sig values are 0.000 < 0.05). That means that supportive policies, infrastructure, and resources
Table 7Descriptive statistics on Vietnam’s infrastructure
Reliability test statistics
Cronbach’s Alpha Nof the category
.844 5
Category-aggregated statistics
Scale mean if item is deleted
Scale variance if item is deleted
Corrected Item-Total Correlation
Cronbach’s Alpha if item is deleted Vietnam has clean water and
environmental infrastructure
10.87 7.973 .669 .809
Vietnam has its own infrastructure management organization
10.89 8.341 .618 .824
Vietnam has a diversified network of transportation
11.62 9.208 .722 .803
Transportation costs in Vietnam are lower than in other countries
10.92 8.337 .611 .826
Vietnam plans to improve its infrastructure through FDI projects
11.74 9.023 .702 .804
Table 8Statistics describing Vietnam’s support policies
Reliability test
Cronbach’s Alpha N
.852 5
Items
Scale mean if item is deleted
Scale variance if item is deleted
Corrected Item-Total Correlation
Cronbach’s Alpha if item is deleted Vietnam has implemented
support policies for foreign investors
12.97 8.353 .605 .836
Vietnam has land policies 12.78 8.274 .702 .811
Vietnam implements policies to support administrative procedures
12.82 7.846 .756 .796
Vietnam has policies to support the duration of investment
12.82 8.412 .621 .832
Vietnam has policies to support the use of local labor resources
have significant implications for attracting FDI into Vietnam. In addition, the supporting policy factor shows the highest impact on the quality of FDI attraction as the beta of this component is higher than that of other sectors and it can be seen that if Vietnam can improve the practical effectiveness of policies, the quality of FDI attraction to Vietnam will be improved by 0.324% (Table 9).
Hypothesis testing Hypothesis 1: Resources have a positive impact on the quality of
FDI attraction in Vietnam
This hypothesis is supported because the correlation coefficient is statistically signifi-cant at 5% of the confidence interval. The partial correlation coefficient is equal to 0.270, which means that when Vietnam can improve its resource efficiency by more than 1%, the FDI attraction in Vietnam will be improved by 0.270%.
Hypothesis 2: Infrastructure has a positive impact on the quality of FDI attraction in Vietnam
This hypothesis is verified because the correlation coefficient is statistically significant at 5% of the confidence interval. The partial correlation coefficient is 0.266, which translates into when Vietnam can improve its effective use of infrastructure by more than 1%, the quality of FDI attraction in Vietnam will be improved by 0.266%.
Hypothesis 3: Supportive policies (socio-economic) have a positive impact on the quality of FDI attraction in Vietnam
This hypothesis is supported because the correlation coefficient is statistically signifi-cant at 5% of the confidence interval. The correlation coefficient is 0.324, which means that when Vietnam can improve its effective support policies by more than 1%, the quality of FDI attraction in Vietnam will be improved by 0.324%.
Discussion
For a period of nearly 30 years, Vietnam expects to improve the development of the en-terprises from FDI. During that time, the quality of FDI attraction has been improved significantly.
Attracting FDI has made a remarkable contribution to economic growth. In some ways, it helps to improve the efficiency of domestic investing resources. Foreign direct in-vestment is being the most dynamic fund with GDP growth higher than the national growth rate. In 1995, GDP of foreign direct investment increased by 14.98% while the na-tional GDP increased just only 9.54%. In 2000, 2005, and 2010, the former number and the latter number were 11.44 and 6.79%, 13.22 and 8.44%, 8.12 and 6.78% respectively.
Table 9Linear regression results
R-square = 0.668
Model Unstandardized coefficients Standardized coefficients T test
Sig.
B Std. error Beta
1 (Constant) .497 .214 2.320 .022
Resources .270 .042 .396 6.461 .000
Infrastructure .266 .042 .381 6.275 .000
Support policies .324 .045 .455 7.259 .000
The contribution of FDI sector has increased gradually, from 2% GDP (1982) to 12.7% (2000), 16.98% (2006), 18.97% (2011), 19% (2015), and 23.4% (2016) [1, 23].
FDI is playing a fundamental role on the total social investment. It contributes significantly to Vietnam’s export and changes the structure of exports toward reducing the share of mining products and raw materials while increasing the proportion of manufactured goods. The enterprises from FDI have a positive impact on expanding Vietnamese export’s market, especially to the USA and EU. This change, in some ways, results in changing export structure by making USA become the largest market contributing to national budget. The export revenue including crude oil from FDI en-terprises reached only 45.2 of total turnover before 2001. However, since 2003, foreign direct investment became a major factor boosting beyond the domestic region. It accounts for roughly 64% of total exports in 2012. The total export turnover of FDI enterprises in 2015 reached nearly 2008 billion US dollars and increased approximately 16.7% that is equivalent to 29.69 billion US dollars in comparison with 2014. That accounts for 63.4% of the national export turnovers [1, 23].
Foreign direct investment helps promoting economic restructuring in Vietnam toward industrialization and modernization. In Vietnam, FDI focuses on investing in the industrial sector with a higher technological level of the country’s average level. The growth rate of industry from FDI is nearly 18% on average [1, 4], and it is higher than the growth rate of the whole industry currently. FDI plays a leading role on developing several key industrial sectors like telecommunication, mining, oil and gas processing, electronics, media technology, steel and cement, etc.
In addition, FDI helps in creating more jobs, improves the quality of human resources, and changes Vietnamese labor structure.On annual average, the FDI companies gener-ate roughly 2 million jobs directly and about 3–4 million jobs indirectly with a strong im-pact on Vietnamese labor restructuring towards industrialization and modernization [1].
Foreign investment is an important channel for technology transfer, contributing in raising the technological level of Vietnamese economy. Since 1993, Vietnam had 951 technology transfer contracts already approved/registered with 605 contracts from FDT enterprises, accounting for 63.6% [1]. FDI activities help in bringing the development of worldwide technologies into Vietnam.
It is clear that projects from FDI have a huge impact to improve competitivenessin all three national levels, enterprise level, and product level. In fact, many Vietnamese products are considered competitive in the US market, EU market, and Japan market. FDI sectors help to boost the competition of other domestic sectors and the whole national economy by boosting productivity, exports, the balance of international payments, the level of technology, labor skills, and labor restructuring.
FDI projects have helped to improve economic management and have been a signifi-cant contribution to Vietnamese international integration. FDI attraction has helped in breaking our national embargo, expanding external economic relationship, joining ASEAN, and signing several framework agreements with EU, Bilateral Trade Agreement with the United States, the economic partnership Agreement (EPA) with Japan, etc.
Conclusion and recommendations
to introduce a model of research on the quality of FDI attraction in Vietnam, including support policies, resources, and infrastructure. The support policies should always be concerned with how to attract more foreign investors. The infrastructure should ensure the sustainability of the FDI projects. And the last factor—resources—should focus on improving the benefits of foreign investors via reducing the cost.
The current position of Vietnam in improving the quality of FDI attraction is reflected through the quantitative impact of infrastructure, support policies, and resources to increase FDI in the coming years. Linear regression demonstrates that all factors are statistically significant for improving the quality of FDI attraction in Vietnam and that government support policies are the factors that show the great-est impact on quality of FDI attraction. The study strongly encourages the process of improving and cleaning up the state management apparatus in the provinces of Vietnam. This is quite accurate as FDI inflows into developing countries, including Vietnam, are increasing dramatically as Vietnam strives to improve its policy of attracting foreign investment.
To further improve the quality of FDI attraction in Vietnam in the coming years, the Government of Vietnam should continue to improve the policy towards transparency and access to international practices and reform the administrative procedures; continue to adjust and invest in infrastructure, giving priority to water supply and drainage, environmental sanitation, road, and sea port systems; and continue to improve resources including quality of labor and financial institutions. These policy implications are also relatively relevant to the current situation in Vietnam as well as the data from this study.
Abbreviations
FDI:Foreign direct investment; FIA: Foreign Investment Agency; GSO: General Statistics Office of Vietnam; WTO: World Trade Organization
Acknowledgements
We acknowledge the General Statistics Office of Vietnam; Vietnam Foreign Investment Agency for supporting us to complete this study.
Funding
This study was conducted without any financial support.
Availability of data and materials
Raw data from the General Statistics Office of Vietnam and Foreign Investment Agency are stated in the references. The data are analyzed with the support of SPSS 20.
Authors’contributions
NPH synthesized and analyzed quantitative research and finalized the research. DVH worked on the latest update of FDI data. NTH collected and analyzed statistical data of FDI projects from 1988 to 2016. DTT worked for the General Statistics Office of Vietnam; Foreign Investment Agency to get the most objective assessment. All authors read and approved the final manuscript.
Competing interests
The authors declare that they have no competing interests.
Publisher’s Note
Springer Nature remains neutral with regard to jurisdictional claims in published maps and institutional affiliations.
Author details 1
Received: 29 April 2017 Accepted: 6 October 2017
References
1. General Statistics Office (GSO) (1998-2015) Vietnam’s statistical year book. Statistical Publishing House, Vietnam 2. Foreign Investment Agency (FIA) (1998–2015), Situation of foreign direct investment attraction, The Ministry of
Planning and Investment. Vietnam
3. PricewaterhouseCoopers (2008-2015) Vietnam, a guide for business and investment. PricewaterhouseCoopers, Vietnam 4. Foreign Investment Agency (FIA) (2016) Vietnam gains noted economic achievements after 30 years of Doi Moi.
The Ministry of Planning and Investment, Statistical Publishing House, Vietnam
5. General Statistics Office, the investigation report on the results of production and business situation of the Vietnam enterprises with foreign investment, stage 2000 to 2015. http://gso.gov.vn/Default.aspx?tabid=382&ItemID=14002. Accessed 7 July 2014
6. This general definition of FDI is based on OECD, Detailed Benchmark Definition of Foreign Direct Investment, third edition (OECD, 1996), and International Monetary Fund, Balance of Payments Manual, fifth edition (IMF, 1993). http://www.oecd.org/investment/investment-policy/2090148.pdf. https://www.imf.org/external/pubs/ft/ bopman/bopman.pdf
7. World Trade Organization (2002) Annual report 2002. WTO Publications. Printed in France VII-2002-3,000 © World Trade Organization. https://www.wto.org/english/res_e/booksp_e/anrep_e/anrep02_e.pdf
8. Khadaroo AJ, Seetanah B (2008) Transport and economic performance: the case of Mauritius. J Trans Econ Policy 42(2):1–13
9. Alfaro L (2003) Foreign Direct Investment and Growth: Does the Sector Malter. Harvard Business School, Mimeo, Boston, pp 1–31
10. Blomstrom M, Wang J-Y (1992) Foreign investment and technology transfer: a simple model, published. Eur Econ Rev 36:137–155
11. Mayer RE (2005). Cognitive theory of multimedia learning. The Cambridge handbook of multimedia learning. [Google Books version]. University Press, Cambridge. Retrieved February 15, 2011
12. Mayer JD, Roberts RD, Barsade SG (2008) Human abilities: emotional intelligence. Annu Rev Psychol 59:507–536 13. Lipsey RE (2000),“Interpreting developed countries’foreign direct investment”, NBER Working paper no. 7810,
National Bureau of Economic Research, Cambridge
14. Sullivan A, Sheffrin MS (2000) Economics: principles and tools. Prentice Hall, New Jersey, p 712
15. Iwanow T, Kirkpatrick C (2006) Trade facilitation, regulatory quality and export performance. J Int Dev 19(6):735–753 16. Prokopenko J (2000)“Globalization, competitiveness and productivity strategies”Enterprise and Management
Development Working Paper - EMD/22/E, January. International Labour Organization, Geneva. http://oracle02.ilo. org/dyn/empent/empent
17. Creswell J (2002) Educational research: planning, conducting, and evaluating quantitative and qualitative research. Merrill Prentice Hall, Upper Saddle River, NJ
18. Hair JF, Black WC, Babin BJ, Anderson, RE (2011).Multivariate data analysis (7th ed.). Beijing: China Machine Press. 19. Muijs D (2011) Doing quantitative research in education with SPSS. Sage Publications Ltd, Thousand Oaks, CA 20. Ishida M (2012) In: Lim H, Yamada Y (eds)“Attracting FDI: experiences of east Asian countries”, economic reforms
in Myanmar: pathways and prospects, BRC research report no.10. Bangkok Research Center, IDE-JETRO, Bangkok, Thailand
21. World Bank.( 2015)The World Bank Annual Report 2015;Washington, DC. © World Bank. https://openknowledge. worldbank.org/handle/10986/22550 License: CC BY 3.0 IGO”
22. Foreign Investment Agency (2015) Attracting foreign direct investment may 12, 2015. The Ministry of Planning and Investment, Vietnam