P O S I T I O N S T A T E M E N T
Open Access
Annual Dialysis Data Report 2014,
JSDT Renal Data Registry (JRDR)
Ikuto Masakane
1,2*, Shigeru Nakai
1, Satoshi Ogata
1, Naoki Kimata
1, Norio Hanafusa
1, Takayuki Hamano
1,
Kenji Wakai
1, Atsushi Wada
1and Kosaku Nitta
1Abstract
Background:The Japanese Society for Dialysis Therapy (JSDT) has performed a nationwide renal data registry since 1966. The data from the survey have been used for promoting dialysis facilities to improve dialysis quality and developing JSDT guidelines. Here, we summarized the current status of chronic dialysis in Japan as of 31 December 2014.
Methods: The annual survey was conducted targeting for 4367 dialysis facilities by electrically and partially paper-based; among which, 4330 (99.2%) responded. The results shown in this report are all descriptive, and no statistical analyses were conducted.
Results: The number of the incident dialysis patients was 38,327 and that of the prevalent dialysis patients was 320,448 in 2014. The count of prevalent dialysis patients per million population was 2517. The count of dialysis patients who died in 2014 was 30,707, and the crude mortality rate was 9.6%. The mean age of incident dialysis patients was 69.04 years, and the mean age of the prevalent dialysis patients was 67.54 years. The most common primary cause on the incident and prevalent dialysis patients was diabetic nephropathy. The patient count on hemodiafiltration (HDF) at the end of 2014 was 43,283; in particular, the number of online HDF patients increased more than 2.5 times over the last 3 years. The facility survey showed that 9255 patients were on peritoneal dialysis (PD) in 2014. Among them, 1913 patients were treated by the combination of PD and hemodialysis (HD) or HDF. The number of patients treated by home HD at the end of 2014 was 529, a continued increase from that at the end of 2013 as 461.
Conclusions: The chronic dialysis population in Japan has been still increasing and becoming older year by year. The rapidly increasing number of online hemodiafiltration is an emerging trend but the penetration rate of home therapies by peritoneal dialysis and home hemodialysis was still the lowest in the world.
Trial registration: UMIN000018641
Keywords: Dialysis patient population, Survival rate, Dialysis fluid quality, Hemodiafiltration, Peritoneal dialysis
Outline of JSDT Renal Data Registry
Introduction
The Japanese Society for Dialysis Therapy (JSDT) has been annually surveyed the status of chronic dialysis since 1968, and it was named the JSDT renal data regis-try (JRDR). In the early surveys, only the counts of patients and dialysis-beds in dialysis facilities were
recorded annually. Since 1983, clinical data of all dialysis patients treated in the facilities that participated in the surveys have been collected. The results from these sur-veys were summarized as the annual renal data report and also used for making JSDT guidelines and standards. JRDR is respected worldwide as an unbiased complete patient census.
Before 2014, the results from JRDR had been reported in following three types of report. First, quick analyses of the data obtained by April in the following year were re-ported at the annual meeting of the JSDT held in June and compiled in “The Atlas, Overview of Regular
* Correspondence:imasakan.aipod@seieig.or.jp
1Committee of Renal Data Registry, Japanese Society for Dialysis Therapy, Tokyo, Japan
2Department of Nephrology, Yabuki Hospital, 4-4-5 Shima Kita, Yamagata, Yamagata 990-0885, Japan
Dialysis Treatment in Japan”. Second, the responses to the survey had been continuously collected until September, and the obtained data were screened to determine the definite survey results, which were published in the “An Overview of Regular Dialysis Treatment in Japan, the CD-ROM Report”. Third, the tabulated results based on the definite values in the
CD-ROM report were published as an annual dialysis data report in the Journal of Japanese Society for
Dia-lysis Therapy. Therefore, the values in the atlas were
different from the definite values in the CD-ROM. The quick estimations were prepared only for the atlas in the annual meeting of JSDT. However, the values in the atlas had been occasionally cited as if
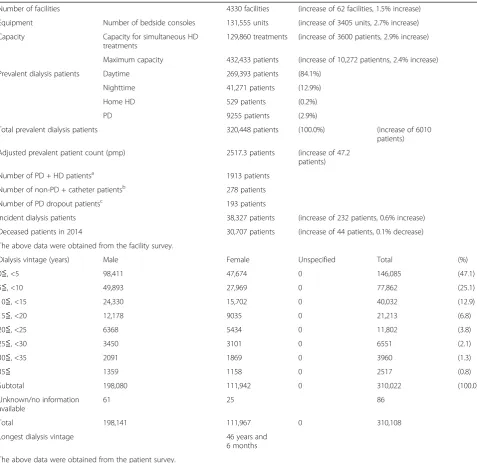
Table 1Summary of chronic dialysis therapy in 2014
Number of facilities 4330 facilities (increase of 62 facilities, 1.5% increase)
Equipment Number of bedside consoles 131,555 units (increase of 3405 units, 2.7% increase)
Capacity Capacity for simultaneous HD
treatments
129,860 treatments (increase of 3600 patients, 2.9% increase)
Maximum capacity 432,433 patients (increase of 10,272 patientns, 2.4% increase)
Prevalent dialysis patients Daytime 269,393 patients (84.1%)
Nighttime 41,271 patients (12.9%)
Home HD 529 patients (0.2%)
PD 9255 patients (2.9%)
Total prevalent dialysis patients 320,448 patients (100.0%) (increase of 6010
patients)
Adjusted prevalent patient count (pmp) 2517.3 patients (increase of 47.2
patients)
Number of PD + HD patientsa 1913 patients
Number of non-PD + catheter patientsb 278 patients
Number of PD dropout patientsc 193 patients
Incident dialysis patients 38,327 patients (increase of 232 patients, 0.6% increase)
Deceased patients in 2014 30,707 patients (increase of 44 patients, 0.1% decrease)
The above data were obtained from the facility survey.
Dialysis vintage (years) Male Female Unspecified Total (%)
0≦, <5 98,411 47,674 0 146,085 (47.1)
5≦, <10 49,893 27,969 0 77,862 (25.1)
10≦, <15 24,330 15,702 0 40,032 (12.9)
15≦, <20 12,178 9035 0 21,213 (6.8)
20≦, <25 6368 5434 0 11,802 (3.8)
25≦, <30 3450 3101 0 6551 (2.1)
30≦, <35 2091 1869 0 3960 (1.3)
35≦ 1359 1158 0 2517 (0.8)
Subtotal 198,080 111,942 0 310,022 (100.0)
Unknown/no information available
61 25 86
Total 198,141 111,967 0 310,108
Longest dialysis vintage 46 years and
6 months
The above data were obtained from the patient survey.
a
PD + HD patients: Patients treated by the combination of PD and HD, HDF, hemoadsorption, or hemofiltration (excluding those who underwent only peritoneal lavage)
b
Non-PD + catheter patients: Patients who did not undergo PD despite having a peritoneal catheter but underwent HD, HDF, hemoadsorption, or hemofiltration (including those who underwent only peritoneal lavage)
c
PD dropout patients: Incident PD patients who changed a dialysis modality during 2014
they were officially approved values because they were expressed by attractive graphs. To avoid these mal-citations, we decided to publish all the official reports from the 2014 survey based on the definite database.
All the figures and tables included in the CD-ROM report have been made available on the members-only pages of the JSDT website since 2012 to widely pro-vide the survey findings among JSDT members. These pages contain all the findings from the first survey conducted in 1968 to the latest survey. All figures and tables in the website in JRDR have been updating if any errors had been found so these updated data should be used for any academic and social analyses. On the other hand, the summaries of survey results
in the illustrated report are available for the general public on the JSDT website (http://www.jsdt.or.jp/ overview_confirm.html). A review report should be re-ferred for the historical background of the annual survey and the survey items in the previous surveys [1].
The current manuscript is the second publication of An overview of regular dialysis treatment in Japan (as of
December 31, 2014) J Jpn Soc Dial Ther 49(7):1–34,
2016, written in Japanese.
Subjects and methods
Survey method
The JSDT survey is conducted annually by sending ques-tionnaires to all dialysis facilities in Japan at the end of
Table 2Prevalent, incident, and deceased dialysis patient counts and adjusted rate
1995 1996 1997 1998 1999 2000 2001 2002 2003 2004
Prevalent dialysis patients 154,413 167,192 175,988 185,322 197,213 206,134 219,183 229,538 237,710 248,166
Incident dialysis patients 26,398 28,409 28,870 29,641 31,483 32,018 33,243 33,710 33,966 35,084
Deceased dialysis patients 14,406 15,174 16,102 16,687 18,524 18,938 19,850 20,614 21,672 22,715
Adjusted prevalent dialysis patients (pmp) 1229.7 1328.4 1394.9 1465.2 1556.7 1624.1 1721.9 1801.2 1862.7 1943.5
Recovery rate for facility survey (%) 99.8 99.8 99.7 99.7 99.7 99.9 99.0 99.6 99.1 98.7
2005 2006 2007 2008 2009 2010 2011 2012 2013 2014
Prevalent dialysis patients 257,765 264,473 275,242 283,421 290,661 298,252 304,856 310,007 314,438 320,448
Incident dialysis patients 36,063 36,373 36,934 38,180 37,566 37,512 38,613 38,055 38,095 38,327
Deceased dialysis patients 23,983 24,034 25,253 27,266 27,646 28,882 30,743 30,710 30,751 30,707
Adjusted prevalent dialysis patients (pmp) 2017.6 2069.9 2154.2 2219.6 2279.5 2329.1 2385.4 2431.2 2470.1 2517.3
Recovery rate for facility survey (%) 98.9 98.4 98.9 99.0 98.5 98.6 99.0 99.0 98.7 99.2
each year. A total of 4367 facilities surveyed were either member facilities of JSDT, nonmember facilities offering regular maintenance hemodialysis (HD), or nonmember facilities offering peritoneal dialysis (PD) but not HD as of 31 December 2014. The number of facilities partici-pating in this survey increased by 42 (1.0%) from 2013 as 4325 facilities [2].
The questionnaires were mainly sent and collected by postal mail; the rest of them were also faxed. Universal serial bus (USB) memory devices with stored electronic spreadsheets in Microsoft Excel format were also sent with the printed questionnaires to the facilities. The fa-cilities were requested to use these devices for the com-pletion of the questionnaires as much as possible.
In this survey, two sets of questionnaires were used. One was for the facility survey, which included ques-tions about dialysis facilities, such as the number of patients and the number of staff members. The other was for the patient survey, which included items on the epidemiological background, treatment conditions, and the outcome of the treatment of individual dialy-sis patients.
The deadline for the acceptance of responses was the end of January in 2015. The acceptance of responses submitted after this deadline, including those of the add-itional surveys, ended on 7 August 2015.
As previously addressed, we decided to publish the annual report based on the definite database from 2014, so all values in this report are officially ap-proved and the same as those in the CD-ROM. Based on the defined database, the count of facilities that responded to the facility survey was 4330 (99.2%), and the count of facilities that responded to both the facility and patient surveys was 4191 (96.0%). More-over, the facilities that completed the questionnaires using the electronic medium (3764 facilities, 86.9%) further increased from the 2013 survey (3698 facil-ities, 86.6%). This increase contributed to the accurate and simplified analysis of survey data [3].
Survey items
The collected data in the 2014 survey were classified to the following two categories as facility data and patient data. The items in the previous surveys are
Table 3Modalities in prevalent dialysis patients
2004 2005 2006 2007 2008 2009 2010 2011 2012 2013 2014
Facility surveya Prevalent dialysis patient 248,166 257,765 264,473 275,242 283,421 290,661 298,252 304,856 310,007 314,438 320,448
(%) (100.0) (100.0) (100.0) (100.0) (100.0) (100.0) (100.0) (100.0) (100.0) (100.0) (100.0)
Daytime dialysis patient 196,337 206,340 213,454 223,953 231,517 238,848 246,146 253,916 258,131 263,184 269,393
(%) (79.1) (80.0) (80.7) (81.4) (81.7) (82.2) (82.5) (83.3) (83.3) (83.7) (84.1)
Nighttime dialysis patient 42,600 41,871 41,641 41,742 42,405 41,719 42,052 40,971 41,969 41,401 41,271
(%) (17.2) (16.2) (15.7) (15.2) (15.0) (14.4) (14.1) (13.4) (13.5) (13.2) (12.9)
Home HD patient 114 127 147 187 193 236 277 327 393 461 529
(%) (0.0) (0.0) (0.1) (0.1) (0.1) (0.1) (0.1) (0.1) (0.1) (0.1) (0.2)
PD patientc 8774 9243 9003 9362 9300 9858 9773 9642 9514 9392 9255
(%) (3.5) (3.6) (3.4) (3.4) (3,3) (3.4) (3.3) (3.2) (3.1) (3.0) (2.9)
PD + HD patientd 1720 1983 1902 1932 1920 1913
non-PD + catheter patiente 437 406 369 347 292 278
Patient surveyb Prevalent dialysis patient 236,606 240,513 249,957 264,356 273,237 281,996 289,449 295,735 301,545 306,925 310,108
(%) (100.0) (100.0) (100.0) (100.0) (100.0) (100.0) (100.0) (100.0) (100.0) (100.0) (100.0)
HD 213,474 216,880 223,737 235,960 245,090 253,807 262,973 270,072 268,275 264,211 255,641
(%) (90.2) (90.2) (89.5) (89.3) (89.7) (90.0) (90.9) (91.3) (89.0) (86.1) (82.4)
HDF 14,183 14,083 16,163 17,759 17,380 16,853 14,867 14,115 21,725 31,371 43,283
(%) (6.0) (5.9) (6.5) (6.7) (6.4) (6.0) (5.1) (4.8) (7.2) (10.2) (14.0)
PDc 8004 8103 7971 8630 8636 9164 9298 9094 8996 9037 8941
(%) (3.4) (3.4) (3.2) (3.3) (3.2) (3.2) (3.2) (3.1) (3.0) (2.9) (2.9)
a
Data obtained from the facility survey
b
Data obtained from the patient survey
c
The figures mean“number of CAPD patients”from 2002 to 2008 (CAPD: continuous ambulatory peritoneal dialysis)
d
PD + HD patients: patients treated by the combination of PD and HD or HDF
e
Table 4Prevalent dialysis patient counts by modality and prefecture
Prefecture Daytime Nighttime Home HD PD Total
Outpatients Inpatients Outpatients Inpatients Outpatients Inpatients Outpatients Inpatients
Hokkaido 11,733 1793 1277 32 10 0 384 10 15,239
Aomori 2885 226 231 2 0 0 85 3 3432
Iwate 2390 219 332 3 0 0 95 5 3044
Miyagi 4030 346 813 36 0 0 86 6 5317
Akita 1597 258 134 0 2 0 54 5 2050
Yamagata 1953 252 310 0 10 0 66 4 2595
Fukushima 3852 368 400 1 1 0 169 12 4803
Ibaraki 6098 600 885 0 5 0 112 15 7715
Tochigi 4736 431 704 0 2 0 86 2 5961
Gunma 4200 563 906 17 7 0 95 2 5790
Saitama 13,574 1080 1837 31 80 0 266 6 16,874
Chiba 10,972 1105 1630 10 6 0 270 4 13,997
Tokyo 22,033 2484 4919 112 65 1 1017 20 30,651
Kanagawa 14,710 1524 3082 41 32 0 530 74 19,993
Niigata 3607 291 971 12 1 0 155 3 5040
Toyama 1794 342 270 1 2 0 97 4 2510
Ishikawa 2019 237 316 0 2 0 68 1 2643
Fukui 1325 153 212 7 3 0 82 4 1786
Yamanashi 1800 117 246 0 1 0 58 0 2222
Nagano 3823 354 732 2 4 0 127 5 5047
Gifu 3672 439 610 7 22 0 81 3 4834
Shizuoka 8119 831 1289 4 12 0 174 9 10,438
Aichi 12,379 1397 3027 41 48 0 672 17 17,581
Mie 3333 387 498 18 5 0 78 1 4320
Shiga 2147 299 439 4 31 0 135 7 3062
Kyoto 4534 510 913 100 11 0 202 4 6274
Osaka 17,336 2087 2696 76 36 0 523 20 22,774
Hyogo 10,353 1081 1601 22 55 0 232 32 13,376
Nara 2699 234 265 2 6 0 152 3 3361
Wakayama 2357 279 264 23 16 0 38 1 2978
Tottori 1147 111 138 0 0 0 57 10 1463
Shimane 1203 104 142 0 1 0 57 8 1515
Okayama 3511 547 555 24 1 4 179 18 4839
Hiroshima 5603 844 636 2 22 1 350 27 7485
Yamaguchi 2561 477 315 5 0 0 132 5 3495
Tokushima 2106 260 241 1 4 0 160 13 2785
Kagawa 1932 273 210 3 8 0 184 5 2615
Ehime 2809 471 379 6 0 0 140 3 3808
Kochi 1694 303 260 31 0 0 20 4 2312
Fukuoka 10,276 1222 2171 62 3 0 641 20 14,395
Saga 1763 260 295 9 1 0 14 2 2344
found on the members-only pages of the JSDT web-site (http://www.jsdt.or.jp/).
Facility survey
The following are the items surveyed in the 2014 survey and are the same as those in the 2013 survey [2].
Name and contact numbers (TEL, FAX) of facility
Year and month when the facility started providing
dialysis treatment
Capacity for simultaneous hemodialysis treatments
Maximum capacity for hemodialysis treatments
Number of bedside consoles
Number of workers involved in dialysis treatment
(e.g., doctors, nurses, clinical engineers, nutritionists, case workers)
Number of dialysis specialists
Number of prevalent dialysis patients at the end of
2014 (daytime dialysis, nighttime dialysis, home HD, PD)
Number of HD/HDF patients with PD catheter
(non-PD + catheter patients)
Number of patients treated by the combination of
PD and HD/HDF (PD + HD patients)
Number of inpatients on dialysis at the end of 2014
Number of incident dialysis patients
Number of the incident PD patients who changed a
dialysis modality during 2014 (PD dropout patients)
Number of deceased patients during 2014
Number of bedside consoles equipped with an
endotoxin retentive filter (ETRF)
Use or nonuse of ETRFs for sampling dialysis fluid
Sampling site of dialysis fluid
Frequency for measuring endotoxin concentration in
dialysis fluid
Endotoxin concentration in dialysis fluid
Frequency for measuring total viable microbial
count (TVC) in dialysis fluid
Sampling volume for TVC
Cultivation medium for TVC
TVC in dialysis fluid
Patient survey
The following are the basic survey items that have been annually surveyed since 1983.
Anonymized name
Gender
Date of birth
Year and month of start of dialysis
Year and month of transfer from another hospital
Primary disease
Residence (prefecture)
Table 4Prevalent dialysis patient counts by modality and prefecture(Continued)
Oita 2916 487 325 5 3 0 146 2 3884
Miyazaki 2954 292 506 12 0 0 53 2 3819
Kagoshima 3928 669 531 24 1 0 127 24 5304
Okinawa 3297 409 576 0 0 0 96 2 4380
Total 241,351 28,042 40,471 800 523 6 8823 432 320,448
All figures were from the facility survey. They do not necessarily meet the total number of patients counted in accordance with dialysis modality
Table 5Mean age of prevalent and incident dialysis patients
1993 1994 1995 1996 1997 1998 1999 2000 2001 2002 2003
Mean age of the prevalent dialysis patients 56.6 57.3 58.0 58.6 59.2 59.9 60.6 61.2 61.6 62.2 62.8
±S.D. 13.5 13.5 13.4 13.4 13.4 13.3 13.3 13.2 13.1 13.0 12.9
Mean age of the incident dialysis patients 59.8 60.4 61.0 61.5 62.2 62.7 63.4 63.8 64.2 64.7 65.4
±S.D. 14.4 14.3 14.2 14.2 14.0 13.9 13.9 13.9 13.7 13.6 13.5
2004 2005 2006 2007 2008 2009 2010 2011 2012 2013 2014
Mean age of the prevalent dialysis patients 63.3 63.9 64.4 64.9 65.3 65.8 66.2 66.6 66.9 67.2 67.5
±S.D. 12.9 12.8 12.8 12.7 12.7 12.6 12.6 12.6 12.5 12.5 12.5
Mean age of the incident dialysis patients 65.8 66.2 66.4 66.8 67.2 67.3 67.8 67.8 68.5 68.7 69.0
Dialysis modality
Outcome (transfer, death, dropout, or
transplantation)
Outcome date
(in case of facility transfer) Facility code
Cause of death
The following were added to the above basic survey items and were surveyed using both paper and electronic media.
Current status of the combination of PD + HD
Treatment history of PD
Number of past renal transplantations
Frequency of dialysis session per week
Dialysis time per session
Blood flow rate
Dilution mode in HDF
Substitution fluid volume per HDF session
Body height
Predialysis and postdialysis body weight
Predialysis and postdialysis blood urea nitrogen
(BUN) concentration
Predialysis and postdialysis serum creatinine
concentration
Predialysis serum albumin concentration
Predialysis serum C-reactive protein (CRP)
concentration
Predialysis serum calcium concentration
Predialysis serum phosphorus concentration
Measurement method for serum parathyroid
hormone (PTH) concentration
Intact and whole PTH concentration
Predialysis hemoglobin (Hb) concentration
Use or nonuse of antihypertensive agent
Smoking habit
History of diabetes
History of myocardial infarction
History of cerebral hemorrhage
Table 6Incident dialysis patient distribution by gender and age
Age at dialysis initiation
Male Female Subtotal No information available
Total
<5 2 8 10 10
(%) (0.0) (0.1) (0.0) (0.0)
5~9 2 2 4 4
(%) (0.0) (0.0) (0.0) (0.0)
10~14 6 5 11 11
(%) (0.0) (0.0) (0.0) (0.0)
15~19 23 13 36 36
(%) (0.1) (0.1) (0.1) (0.1)
20~24 39 27 66 66
(%) (0.2) (0.2) (0.2) (0.2)
25~29 77 43 120 120
(%) (0.3) (0.4) (0.3) (0.3)
30~34 175 86 261 261
(%) (0.7) (0.7) (0.7) (0.7)
35~39 383 144 527 527
(%) (1.6) (1.2) (1.4) (1.4)
40~44 764 260 1024 1024
(%) (3.1) (2.2) (2.8) (2.8)
45~49 1052 370 1422 1422
(%) (4.3) (3.1) (3.9) (3.9)
50~54 1330 492 1822 1822
(%) (5.4) (4.2) (5.0) (5.0)
55~59 1770 680 2450 2450
(%) (7.2) (5.8) (6.7) (6.7)
60~64 2753 1045 3798 3798
(%) (11.2) (8.8) (10.4) (10.4)
65~69 3598 1471 5069 5069
(%) (14.7) (12.5) (13.9) (13.9)
70~74 3691 1687 5378 5378
(%) (15.0) (14.3) (14.8) (14.8)
75~79 3790 1895 5685 5685
(%) (15.4) (16.0) (15.6) (15.6)
80~84 3220 1934 5154 5154
(%) (13.1) (16.4) (14.2) (14.2)
85~89 1517 1291 2808 2808
(%) (6.2) (10.9) (7.7) (7.7)
90~94 318 318 636 636
(%) (1.3) (2.7) (1.7) (1.7)
95≦ 41 42 83 83
(%) (0.2) (0.4) (0.2) (0.2)
Subtotal 24,551 11,813 36,364 36,364
(%) (100.0) (100.0) (100.0) (100.0)
Table 6Incident dialysis patient distribution by gender and age
(Continued)
Unknown 10 3 13 13
No information available
Total 24,561 11,816 36,377 36,377
Mean age 68.14 70.91 69.04 69.04
S.D. 13.20 13.60 13.39 13.39
History of femoral neck fracture
History of encapsulating peritoneal sclerosis (EPS)
The following were added to the basic survey items and were collected only by the USB survey.
Serum total cholesterol concentration
Serum high-density lipoprotein cholesterol
(HDL-C) concentration
Predialysis systolic blood pressure
Predialysis diastolic blood pressure
Predialysis pulse rate
The following were surveyed only for PD patients and were collected only by the USB survey.
PD vintage
Number of months in which PD was performed
in 2014
History of peritoneal equilibrium test (PET)
Four-hour creatinine concentration dialysate/plasma
ratio in PET (PET Cr D/P ratio)
Type of PD fluid (PD fluid type)
Volume of PD fluid per day (PD fluid volume)
PD treatment time per day
Daily urine volume (Urine volume)
Mean ultrafiltration (UF) volume per day
(UF volume)
Kt/V by residual kidney (Residual kidney Kt/V)
Kt/V by PD (PD Kt/V)
Changing maneuver of PD fluids
Use or nonuse of automated peritoneal dialysis
(APD) machine
Past histories of peritonitis during 2014
Past histories of exit-site infections during 2014
Calculation of survival rate
The cumulative survival rate after the start of dialysis was actuarially calculated [4].
Table 7Prevalent dialysis patient distribution by gender and age
Age at the end of 2014
Male Female Subtotal No information available
Total
<5 21 20 41 41
(%) (0.0) (0.0) (0.0) (0.0)
5~9 15 17 32 32
(%) (0.0) (0.0) (0.0) (0.0)
10~14 23 21 44 44
(%) (0.0) (0.0) (0.0) (0.0)
15~19 72 37 109 109
(%) (0.0) (0.0) (0.0) (0.0)
20~24 152 94 246 246
(%) (0.1) (0.1) (0.1) (0.1)
25~29 455 227 682 682
(%) (0.2) (0.2) (0.2) (0.2)
30~34 1165 599 1764 1764
(%) (0.6) (0.5) (0.6) (0.6)
35~39 2771 1254 4025 4025
(%) (1.4) (1.1) (1.3) (1.3)
40~44 5985 2611 8596 8596
(%) (3.0) (2.3) (2.8) (2.8)
45~49 9334 3971 13,305 13,305
(%) (4.7) (3.5) (4.3) (4.3)
50~54 12,319 5594 17,913 17,913
(%) (6.2) (5.0) (5.8) (5.8)
55~59 17,067 8283 25,350 25,350
(%) (8.6) (7.4) (8.2) (8.2)
60~64 26,673 13,679 40,352 40,352
(%) (13.5) (12.2) (13.0) (13.0)
65~69 34,272 17,987 52,259 52,259
(%) (17.3) (16.1) (16.9) (16.9)
70~74 31,614 17,753 49,367 49,367
(%) (16.0) (15.9) (15.9) (15.9)
75~79 26,319 15,932 42,251 42,251
(%) (13.3) (14.2) (13.6) (13.6)
80~84 18,970 13,117 32,087 32,087
(%) (9.6) (11.7) (10.3) (10.3)
85~89 8681 7978 16,659 16,659
(%) (4.4) (7.1) (5.4) (5.4)
90~94 1959 2428 4387 4387
(%) (1.0) (2.2) (1.4) (1.4)
95≦ 258 360 618 618
(%) (0.1) (0.3) (0.2) (0.2)
Subtotal 198,125 111,962 310,087 310,087
Table 7Prevalent dialysis patient distribution by gender and age(Continued)
(%) (100.0) (100.0) (100.0) (100.0)
Unknown 16 5 21 21
No information available
Total 198,141 111,967 310,108 310,108
Mean age 66.75 68.94 67.54 67.54
S.D. 12.36 12.60 12.49 12.49
Table
9
Prevalent
dialysis
patient
distribution
by
age
and
primary
disease
(Continued)
Urinary
tract
obstructive
90
102
89
88
36
10
722
1
723
63.81
16.72
(%)
(0.2)
(0.2)
(0.2)
(0.3)
(0.2)
(0.2)
(0.2)
(4.8)
(0.2)
Mye
loma
51
50
43
38
22
2
3
276
276
70.55
12.17
(%)
(0.1)
(0.1)
(0.1)
(0.1)
(0.1)
(0.0)
(0.5)
(0.1)
(0.1)
Hypo
plastic
kidne
y
34
32
26
15
6
4
649
649
44.24
19.08
(%)
(0.1)
(0.1)
(0.1)
(0.0)
(0.0)
(0.1)
(0.2)
(0.2)
Unde
termine
d
39
07
4152
4201
3732
2418
698
114
27,530
14
27,544
69.80
13.13
(%)
(7.5)
(8.4)
(9.9)
(11.6
)
(14.5
)
(15.9)
(18.4)
(8.9)
(66.7)
(8.9)
Rejecte
d
ki
dney
25
7
115
73
58
22
10
1
2163
2163
56.37
12.59
(%)
(0.5)
(0.2)
(0.2)
(0.2)
(0.1)
(0.2)
(0.2)
(0.7)
(0.7)
Others
10
00
1097
1014
844
454
126
20
7556
1
7557
65.60
15.70
(%)
(1.9)
(2.2)
(2.4)
(2.6)
(2.7)
(2.9)
(3.2)
(2.4)
(4.8)
(2.4)
Subto
tal
52
,259
49,3
67
42,251
32,087
16,659
4387
618
310,087
21
310,108
67.54
12.49
(%)
(100.
0)
(100.
0)
(100.
0)
(100.
0)
(100.
0)
(100.0)
(100.0)
(100.0)
(100.0)
(100.0)
No
inf
ormation
available
(%) Total
52
,259
49,3
67
42,251
32,087
16,659
4387
618
310,087
21
310,108
67.54
12.49
Contents of the 2014 annual dialysis data report of JSDT
Chapter l: Basic demographics
Chapter 2: Current status of microbiological quality of dialysis fluid and its control
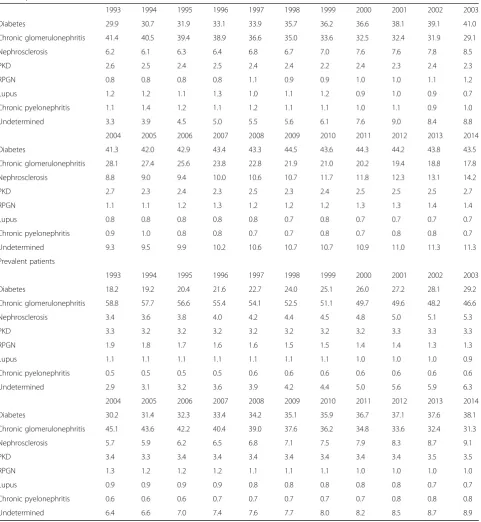
Table 10Annual changes of primary disease in the incident and prevalent dialysis patients
Incident patients
1993 1994 1995 1996 1997 1998 1999 2000 2001 2002 2003
Diabetes 29.9 30.7 31.9 33.1 33.9 35.7 36.2 36.6 38.1 39.1 41.0
Chronic glomerulonephritis 41.4 40.5 39.4 38.9 36.6 35.0 33.6 32.5 32.4 31.9 29.1
Nephrosclerosis 6.2 6.1 6.3 6.4 6.8 6.7 7.0 7.6 7.6 7.8 8.5
PKD 2.6 2.5 2.4 2.5 2.4 2.4 2.2 2.4 2.3 2.4 2.3
RPGN 0.8 0.8 0.8 0.8 1.1 0.9 0.9 1.0 1.0 1.1 1.2
Lupus 1.2 1.2 1.1 1.3 1.0 1.1 1.2 0.9 1.0 0.9 0.7
Chronic pyelonephritis 1.1 1.4 1.2 1.1 1.2 1.1 1.1 1.0 1.1 0.9 1.0
Undetermined 3.3 3.9 4.5 5.0 5.5 5.6 6.1 7.6 9.0 8.4 8.8
2004 2005 2006 2007 2008 2009 2010 2011 2012 2013 2014
Diabetes 41.3 42.0 42.9 43.4 43.3 44.5 43.6 44.3 44.2 43.8 43.5
Chronic glomerulonephritis 28.1 27.4 25.6 23.8 22.8 21.9 21.0 20.2 19.4 18.8 17.8
Nephrosclerosis 8.8 9.0 9.4 10.0 10.6 10.7 11.7 11.8 12.3 13.1 14.2
PKD 2.7 2.3 2.4 2.3 2.5 2.3 2.4 2.5 2.5 2.5 2.7
RPGN 1.1 1.1 1.2 1.3 1.2 1.2 1.2 1.3 1.3 1.4 1.4
Lupus 0.8 0.8 0.8 0.8 0.8 0.7 0.8 0.7 0.7 0.7 0.7
Chronic pyelonephritis 0.9 1.0 0.8 0.8 0.7 0.7 0.8 0.7 0.8 0.8 0.7
Undetermined 9.3 9.5 9.9 10.2 10.6 10.7 10.7 10.9 11.0 11.3 11.3
Prevalent patients
1993 1994 1995 1996 1997 1998 1999 2000 2001 2002 2003
Diabetes 18.2 19.2 20.4 21.6 22.7 24.0 25.1 26.0 27.2 28.1 29.2
Chronic glomerulonephritis 58.8 57.7 56.6 55.4 54.1 52.5 51.1 49.7 49.6 48.2 46.6
Nephrosclerosis 3.4 3.6 3.8 4.0 4.2 4.4 4.5 4.8 5.0 5.1 5.3
PKD 3.3 3.2 3.2 3.2 3.2 3.2 3.2 3.2 3.3 3.3 3.3
RPGN 1.9 1.8 1.7 1.6 1.6 1.5 1.5 1.4 1.4 1.3 1.3
Lupus 1.1 1.1 1.1 1.1 1.1 1.1 1.1 1.0 1.0 1.0 0.9
Chronic pyelonephritis 0.5 0.5 0.5 0.5 0.6 0.6 0.6 0.6 0.6 0.6 0.6
Undetermined 2.9 3.1 3.2 3.6 3.9 4.2 4.4 5.0 5.6 5.9 6.3
2004 2005 2006 2007 2008 2009 2010 2011 2012 2013 2014
Diabetes 30.2 31.4 32.3 33.4 34.2 35.1 35.9 36.7 37.1 37.6 38.1
Chronic glomerulonephritis 45.1 43.6 42.2 40.4 39.0 37.6 36.2 34.8 33.6 32.4 31.3
Nephrosclerosis 5.7 5.9 6.2 6.5 6.8 7.1 7.5 7.9 8.3 8.7 9.1
PKD 3.4 3.3 3.4 3.4 3.4 3.4 3.4 3.4 3.4 3.5 3.5
RPGN 1.3 1.2 1.2 1.2 1.1 1.1 1.1 1.0 1.0 1.0 1.0
Lupus 0.9 0.9 0.9 0.9 0.8 0.8 0.8 0.8 0.8 0.7 0.7
Chronic pyelonephritis 0.6 0.6 0.6 0.7 0.7 0.7 0.7 0.7 0.8 0.8 0.8
Undetermined 6.4 6.6 7.0 7.4 7.6 7.7 8.0 8.2 8.5 8.7 8.9
II. Results and discussion from JRDR
Chapter 1: Basic demographics
Number of dialysis patients
Table 1 shows a summary of the dynamics of dialysis pa-tients in Japan at the end of 2014. The number of facil-ities that responded to the facility survey in 2014 was 4330, an increase of 62 (1.4%) from 4268 facilities in 2013. Dialysis facilities have been continuously increas-ing by 100 or less every year since 2000. In Table 1, data on dialysis vintage and the longest dialysis vintage were obtained from the patient survey. All the other results were obtained from the facility survey.
As determined from the facility survey, the preva-lent dialysis patients in Japan at the end of 2014 were 320,448 (Table 1). Table 2 shows changes in number of prevalent, incident, and deceased dialysis patients over the last 20 years. The number of dialysis patients in 2014 increased by 6010, which was greater than 4431 in 2013. However, the increasing rate in preva-lent dialysis patients has generally decreased since 2000. The annual increasing rate of the prevalent dia-lysis patients is defined as the ratio of the increase in dialysis patients each year to the dialysis patients at the end of the previous year. The future trend of dia-lysis patient population in Japan has been estimated by assuming that this trend of annual rate increase continues in the future. As reported previously, the dialysis patient population in Japan is expected to reach the maximum (approximately 348,000) around 2021 and then start decreasing [5].
The number of incident dialysis patients was 38,327 in 2014, as shown by the facility survey. The annual num-ber of incident dialysis patients continued to increase from the start of the survey. Since 2008, incident dialysis patients remained around 38,000 (Table 2).
The annual increasing rates of incident dialysis pa-tients from 2002 adjusted by the recovery rate for the facility survey are plotted in Fig. 1, similarly to the 2013 survey [2]. According to the regression line for the annual increasing rates of incident dialysis patients, the turning point when the incident dialysis patients stop increasing was expected to be in 2013, as shown in the 2013 survey report [2]. These lines of evidences sug-gested that incident dialysis patients will gradually de-crease in the future.
Fig. 3Annual changes in the distributions of three major primary diseases in the incident patients (left) and the prevalent patients (right)
The total count of deceased dialysis patients in been around 30,000 since 2012 [2]. Similarly to the
Table 11Causes of death in incident dialysis patients
Cause of death Male Female Subtotal No information available
Total
Heart failure 335 212 547 547
(%) (22.8) (25.5) (23.8) (23.8)
Cerebrovascular disorder
67 37 104 104
(%) (4.6) (4.5) (4.5) (4.5)
Infectious disease 386 206 592 592
(%) (26.3) (24.8) (25.8) (25.8)
Hemorrhage 31 21 52 52
(%) (2.1) (2.5) (2.3) (2.3)
Malignant tumors 186 77 263 263
(%) (12.7) (9.3) (11.4) (11.4)
Cachexia/Uremia 60 39 99 99
(%) (4.1) (4.7) (4.3) (4.3)
Cardiac infarction 46 29 75 75
(%) (3.1) (3.5) (3.3) (3.3)
Potassium poisoning/ Sudden death
23 15 38 38
(%) (1.6) (1.8) (1.7) (1.7)
Chronic hepatitis/ Cirrhosis
15 10 25 25
(%) (1.0) (1.2) (1.1) (1.1)
Suicide/Refusal of treatment (dialysis)
18 3 21 21
(%) (1.2) (0.4) (0.9) (0.9)
Intestinal obstruction 14 11 25 25
(%) (1.0) (1.3) (1.1) (1.1)
Pulmonary thrombus/ Pulmonary embolus
8 1 9 9
(%) (0.5) (0.1) (0.4) (0.4)
Death due to disaster
8 3 11 11
(%) (0.5) (0.4) (0.5) (0.5)
Other causes 156 102 258 258
(%) (10.6) (12.3) (11.2) (11.2)
Unspecified 115 65 180 180
(%) (7.8) (7.8) (7.8) (7.8)
Subtotal 1468 831 2299 2299
(%) (100.0) (100.0) (100.0) (100.0)
No information available
Total 1468 831 2299 2299
Values in parentheses under each figure represent the percentage relative to the subtotal in each column
Table 12Causes of deaths in prevalent dialysis patients
Cause of death Male Female Subtotal No information available
Total
Heart failure 4800 2975 7775 7775
(%) (25.2) (28.3) (26.3) (26.3)
Cerebrovascular disorder
1329 769 2098 2098
(%) (7.0) (7.3) (7.1) (7.1)
Infectious disease 4066 2096 6162 6162
(%) (21.4) (20.0) (20.9) (20.9)
Hemorrhage 280 191 471 471
(%) (1.5) (1.8) (1.6) (1.6)
Malignant tumors 1951 718 2669 2669
(%) (10.3) (6.8) (9.0) (9.0)
Cachexia/Uremia 652 518 1170 1170
(%) (3.4) (4.9) (4.0) (4.0)
Cardiac infarction 868 390 1258 1258
(%) (4.6) (3.7) (4.3) (4.3)
Potassium poisoning/ Sudden death
551 243 794 794
(%) (2.9) (2.3) (2.7) (2.7)
Chronic hepatitis/ Cirrhosis
206 72 278 278
(%) (1.1) (0.7) (0.9) (0.9)
Suicide/Refusal of treatment (dialysis)
166 49 215 215
(%) (0.9) (0.5) (0.7) (0.7)
Intestinal obstruction 181 129 310 310
(%) (1.0) (1.2) (1.0) (1.0)
Pulmonary thrombus/ Pulmonary embolus
55 24 79 79
(%) (0.3) (0.2) (0.3) (0.3)
Death due to disaster
112 45 157 157
(%) (0.6) (0.4) (0.5) (0.5)
Other causes 1603 1147 2750 2750
(%) (8.4) (10.9) (9.3) (9.3)
Unspecified 2209 1130 3339 3339
(%) (11.6) (10.8) (11.3) (11.3)
Subtotal 19,029 10,496 29,525 29,525
(%) (100.0) (100.0) (100.0) (100.0)
No information available
Total 19,029 10,496 29,525 29,525
2002 was examined (Fig. 2). The increasing rate of deaths remained around 4% until 2011 with slight yearly fluctuations. However, the increasing rates fol-lowing 3 years (2012–2014) was almost 0%. The re-gression line for the increasing rates of the annual number of deaths between 2012 and 2014 is obviously decreasing. If this trend continues, the annual number of deaths stops increasing in 2017. However, it can also be interpreted that the rate of increase in the an-nual number of deaths has fluctuated since 2012, re-quiring careful attention to future trends.
In the 4330 facilities that responded to the facility survey questionnaire, the total number of bedside
consoles was 131,555, an increase of 3405 (2.7%) from the previous year. The capacity for simultan-eous hemodialysis treatments in all facilities was 129,860, and the capacity for the maximum dialysis patients was 432,433, increases of 2.9 and 2.4% from the previous year, respectively. As mentioned above, the total number of patients on chronic dialysis in Japan is expected to reach a maximum of approxi-mately 348,000 in 2021 and then gradually decrease; this is expected even when taking into consideration the number of patients treated in dialysis facilities that did not respond to this survey [5]. Therefore, the capacity for dialysis patients in 2014 had been already larger than the expected number of the max-imum dialysis patients.
The percentage of patients on daytime dialysis was 84.1% of the dialysis patients in 2014, which was 0.4% higher than the previous year (Table 1). In contrast, the nighttime dialysis patient was 12.9%, which was 0.3% lower than 13.2% in the previous year. The absolute num-ber of patients on nighttime dialysis remained in the range of 41,000–42,000 over the last 10 years (Table 3). The number of patients on home HD was 529, an increase of 68 (14.8%) from 461 in the previous year and which has been increasing rapidly since 2006 (Table 3).
The prevalent patients on PD was 9255, which was 2.9% of all dialysis patients. Although the number of PD patients was maximum at 9858 in 2009, it had been gradually decreasing since then (Table 3). The count of PD + HD pa-tients was 1913 in the 2014 survey, and it had remained around 1900 since 2009. The count of non-PD + catheter
Table 13Annual changes in major causes of death
Cause of death 1993 1994 1995 1996 1997 1998 1999 2000 2001 2002 2003
Cardiac failure 29.9 28.2 25.4 24.1 23.9 24.1 24.3 23.2 25.5 25.1 25.0
Infectious disease 12.2 12.6 13.8 14.6 14.9 15.0 16.3 16.6 16.3 15.9 18.5
Malignant tumor 7.4 7.3 7.2 7.7 8.1 7.7 7.6 8.3 8.5 8.5 8.5
Cerebrovascular disease 13.5 14.1 13.5 12.9 12.6 12.1 11.3 11.3 11.6 11.2 10.7
Cardiac infarction 5.7 7.1 7.5 7.4 8.4 7.9 7.4 7.0 7.4 7.4 6.2
Others 4.1 4.5 5.8 6.3 6.7 7.0 7.7 7.9 9.1 9.0 9.7
Unspecified 2.6 2.8 3.2 2.5 3.5 3.9 3.6 8.1 5.7 6.6 5.6
Cause of death 2004 2005 2006 2007 2008 2009 2010 2011 2012 2013 2014
Cardiac failure 25.1 25.8 24.9 24.0 23.7 23.6 27.0 26.6 27.2 26.8 26.3
Infectious disease 18.8 19.2 19.9 18.9 19.9 20.7 20.3 20.3 20.4 20.8 20.9
Malignant tumor 9.0 9.0 9.2 9.2 9.2 9.4 9.8 9.1 9.1 9.4 9.0
Cerebrovascular disease 10.6 9.8 9.4 8.9 8.6 8.4 8.1 7.7 7.5 7.2 7.1
Cardiac infarction 5.4 5.1 4.4 4.4 4.1 4.0 4.7 4.6 4.5 4.3 4.3
Others 10.3 9.1 9.5 9.7 9.7 10.0 6.6 8.4 8.5 8.8 9.3
Unspecified 6.5 7.3 8.3 10.3 10.9 10.6 10.9 10.8 10.5 10.8 11.3
Table 14Annual crude death rate
Year Crude death rate (%) Year Crude death rate (%)
1993 9.4 2004 9.4
1994 9.5 2005 9.5
1995 9.7 2006 9.2
1996 9.4 2007 9.4
1997 9.4 2008 9.8
1998 9.2 2009 9.6
1999 9.7 2010 9.8
2000 9.2 2011 10.2
2001 9.3 2012 10.0
2002 9.2 2013 9.8
patients, it was probably for peritoneal lavage, was 278 and that of PD dropout patients during 2014 was 193.
As shown in Table 3, the number of hemodiafiltra-tion (HDF) patients had been rapidly increasing since 2012 and reached 43,283 in 2014. The demographics of HDF patients are described in detail in Chapter 3: Current status of hemodiafiltration.
According to the patient survey, the longest dialysis vintage was 46 years and 6 months (Table 1). Table 4 shows the total number of dialysis patients in each pre-fecture of Japan determined from the facility survey.
Mean age
The dialysis patient population in Japan is aging yearly. Table 5 shows the changes in the mean age of the preva-lent and incident dialysis patients obtained from the
patient survey. The mean age of the incident dialysis pa-tients in 2014 was 69.0 ± 13.4 years [mean ± standard de-viation (S.D.)] and that of the prevalent dialysis patients was 67.5 ± 12.5 years. In last two decades from 1994 to 2014, the mean age of dialysis patients had become 6.0 years older from 57.3 to 63.3 years in the first dec-ade, and 4.2 years older from 63.3 to 67.5 years in the second decade. Similarly, the mean age of incident dialy-sis patients had become 5.3 years older from 60.4 to 65.8 years in the first decade and from 65.8 to 69.0 years in the second decade. These findings showed that the rate of aging of both prevalent and incident dialysis pa-tients was also slowing down. The incident patient dis-tribution by gender and age was summarized in Table 6, and the prevalent patient distribution by gender and age was summarized in Table 7.
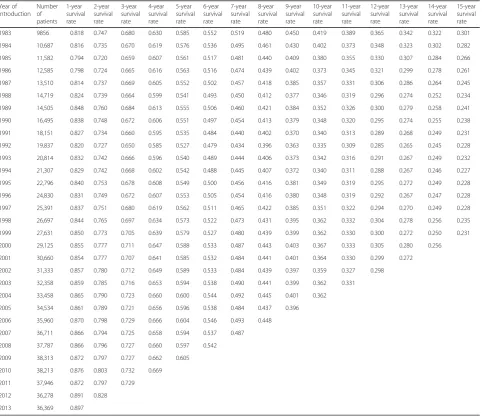
Table 15Cumulative survival rates by incident year since 1983 Year of
introduction Number of patients
1-year survival rate
2-year survival rate
3-year survival rate
4-year survival rate
5-year survival rate
6-year survival rate
7-year survival rate
8-year survival rate
9-year survival rate
10-year survival rate
11-year survival rate
12-year survival rate
13-year survival rate
14-year survival rate
15-year survival rate
1983 9856 0.818 0.747 0.680 0.630 0.585 0.552 0.519 0.480 0.450 0.419 0.389 0.365 0.342 0.322 0.301
1984 10,687 0.816 0.735 0.670 0.619 0.576 0.536 0.495 0.461 0.430 0.402 0.373 0.348 0.323 0.302 0.282
1985 11,582 0.794 0.720 0.659 0.607 0.561 0.517 0.481 0.440 0.409 0.380 0.355 0.330 0.307 0.284 0.266
1986 12,585 0.798 0.724 0.665 0.616 0.563 0.516 0.474 0.439 0.402 0.373 0.345 0.321 0.299 0.278 0.261
1987 13,510 0.814 0.737 0.669 0.605 0.552 0.502 0.457 0.418 0.385 0.357 0.331 0.306 0.286 0.264 0.245
1988 14,719 0.824 0.739 0.664 0.599 0.541 0.493 0.450 0.412 0.377 0.346 0.319 0.296 0.274 0.252 0.234
1989 14,505 0.848 0.760 0.684 0.613 0.555 0.506 0.460 0.421 0.384 0.352 0.326 0.300 0.279 0.258 0.241
1990 16,495 0.838 0.748 0.672 0.606 0.551 0.497 0.454 0.413 0.379 0.348 0.320 0.295 0.274 0.255 0.238
1991 18,151 0.827 0.734 0.660 0.595 0.535 0.484 0.440 0.402 0.370 0.340 0.313 0.289 0.268 0.249 0.231
1992 19,837 0.820 0.727 0.650 0.585 0.527 0.479 0.434 0.396 0.363 0.335 0.309 0.285 0.265 0.245 0.228
1993 20,814 0.832 0.742 0.666 0.596 0.540 0.489 0.444 0.406 0.373 0.342 0.316 0.291 0.267 0.249 0.232
1994 21,307 0.829 0.742 0.668 0.602 0.542 0.488 0.445 0.407 0.372 0.340 0.311 0.288 0.267 0.246 0.227
1995 22,796 0.840 0.753 0.678 0.608 0.549 0.500 0.456 0.416 0.381 0.349 0.319 0.295 0.272 0.249 0.228
1996 24,830 0.831 0.749 0.672 0.607 0.553 0.505 0.454 0.416 0.380 0.348 0.319 0.292 0.267 0.247 0.228
1997 25,391 0.837 0.751 0.680 0.619 0.562 0.511 0.465 0.422 0.385 0.351 0.322 0.294 0.270 0.249 0.228
1998 26,697 0.844 0.765 0.697 0.634 0.573 0.522 0.473 0.431 0.395 0.362 0.332 0.304 0.278 0.256 0.235
1999 27,631 0.850 0.773 0.705 0.639 0.579 0.527 0.480 0.439 0.399 0.362 0.330 0.300 0.272 0.250 0.231
2000 29,125 0.855 0.777 0.711 0.647 0.588 0.533 0.487 0.443 0.403 0.367 0.333 0.305 0.280 0.256
2001 30,660 0.854 0.777 0.707 0.641 0.585 0.532 0.484 0.441 0.401 0.364 0.330 0.299 0.272
2002 31,333 0.857 0.780 0.712 0.649 0.589 0.533 0.484 0.439 0.397 0.359 0.327 0.298
2003 32,358 0.859 0.785 0.716 0.653 0.594 0.538 0.490 0.441 0.399 0.362 0.331
2004 33,458 0.865 0.790 0.723 0.660 0.600 0.544 0.492 0.445 0.401 0.362
2005 34,534 0.861 0.789 0.721 0.656 0.596 0.538 0.484 0.437 0.396
2006 35,960 0.870 0.798 0.729 0.666 0.604 0.546 0.493 0.448
2007 36,711 0.866 0.794 0.725 0.658 0.594 0.537 0.487
2008 37,787 0.866 0.796 0.727 0.660 0.597 0.542
2009 38,313 0.872 0.797 0.727 0.662 0.605
2010 38,213 0.876 0.803 0.732 0.669
Primary diseases
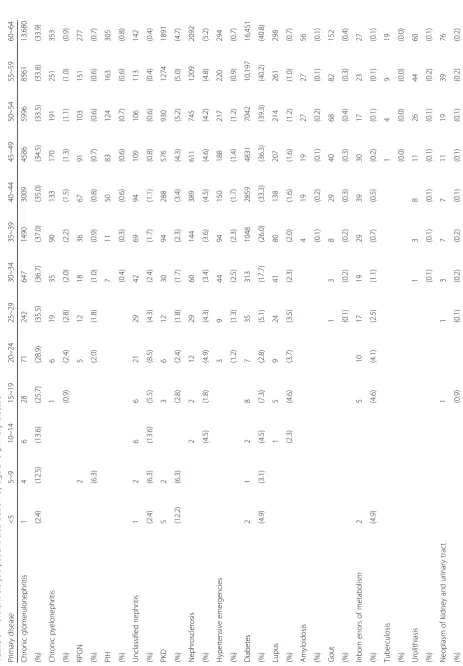
Three major primary diseases of end-stage kidney dis-ease (ESKD) were diabetes, chronic glomeruloneph-ritis, and nephrosclerosis. The three major and other primary diseases of ESKD were summarized by gen-der and age in the incident patients (Table 8) and in the prevalent patients (Table 9). Diabetes was the most frequent primary disease as 43.5%, followed by chronic glomerulonephritis as 17.8% (Table 10 upper panel). The number and percentage of diabetes of the cause of ESKD on the incident dialysis patients had been increased until the end of 2009 and reached 16,549 and 44.5%, respectively, in 2009 (Table 10 upper panel, Fig. 3 Left). However, they had stopped increasing and started decreasing since 2011. Annual
increasing rates of chronic glomerulonephritis and diabetes after 2002 were plotted in Fig. 4. The in-creasing rates were collected by the responsive rate to the survey. The increasing rate of diabetes had been positive until 2009 but turned to be negative since 2012. It suggests that the number of the incident dia-lysis patients with diabetes is expected to gradually decrease continuously in the future. In contrast, the increasing rate of chronic glomerulonephritis had been negative for more than the recent 10 years, indi-cating that the number of the incident dialysis pa-tients with chronic glomerulonephritis continued to decrease. Nephrosclerosis was the third most com-mon primary disease (14.2%) after diabetes and chronic glomerulonephritis. In accordance with the Table 15Cumulative survival rates by incident year since 1983(Continued)
Year of introduction
16-year survival rate
17-year survival rate
18-year survival rate
19-year survival rate
20-year survival rate
21-year survival rate
22-year survival rate
23-year survival rate
24-year survival rate
25-year survival rate
26-year survival rate
27-year survival rate
28-year survival rate
29-year survival rate
30-year survival rate
31-year survival rate
1983 0.282 0.265 0.249 0.235 0.222 0.207 0.193 0.182 0.173 0.162 0.151 0.142 0.131 0.120 0.110 0.103
1984 0.264 0.247 0.233 0.221 0.207 0.194 0.183 0.174 0.162 0.153 0.144 0.135 0.125 0.117 0.108
1985 0.248 0.231 0.216 0.202 0.187 0.174 0.163 0.151 0.142 0.133 0.124 0.116 0.106 0.099
1986 0.244 0.228 0.215 0.203 0.191 0.178 0.168 0.157 0.148 0.139 0.130 0.120 0.110
1987 0.230 0.213 0.197 0.184 0.175 0.164 0.154 0.143 0.134 0.125 0.117 0.109
1988 0.218 0.203 0.190 0.180 0.168 0.157 0.147 0.138 0.129 0.121 0.111
1989 0.225 0.210 0.195 0.184 0.171 0.159 0.149 0.140 0.130 0.121
1990 0.222 0.207 0.193 0.181 0.169 0.157 0.145 0.136 0.127
1991 0.217 0.202 0.189 0.177 0.165 0.154 0.144 0.134
1992 0.212 0.198 0.184 0.171 0.158 0.146 0.136
1993 0.215 0.199 0.185 0.172 0.160 0.150
1994 0.211 0.197 0.184 0.171 0.159
1995 0.209 0.194 0.179 0.167
1996 0.209 0.193 0.180
1997 0.210 0.193
1998 0.217
1999
2000
2001
2002
2003
2004
2005
2006
2007
2008
2009
2010
2011
2012
Table 16Facility distribution on ET measurement by frequency and concentration
Endotoxin concentration in dialysis fluid (EU/ml)
Every day Every week Every 2 weeks Every month Several times per year
Once a year None Subtotal Unspecified No information available
Total
<0.001 20 131 205 2295 280 233 1 3165 2 3167
(%) (0.6) (4.1) (6.5) (72.5) (8.8) (7.4) (0.0) (100.0)
0.001≦, <0.01 5 22 27 371 75 46 546 2 548
(%) (0.9) (4.0) (4.9) (67.9) (13.7) (8.4) (100.0)
0.01≦, <0.05 1 9 10 123 37 31 211 211
(%) (0.5) (4.3) (4.7) (58.3) (17.5) (14.7) (100.0)
0.05≦, <0.1 1 2 39 12 9 63 63
(%) (1.6) (3.2) (61.9) (19.0) (14.3) (100.0)
0.1≦, <0.25 1 5 26 9 7 48 48
(%) (2.1) (10.4) (54.2) (18.8) (14.6) (100.0)
0.25≦, <0.5 1 11 2 6 20 20
(%) (5.0) (55.0) (10.0) (30.0) (100.0)
0.5≦ 1 2 15 1 3 22 22
(%) (4.5) (9.1) (68.2) (4.5) (13.6) (100.0)
Subtotal 27 164 252 2880 416 335 1 4075 4 4079
(%) (0.7) (4.0) (6.2) (70.7) (10.2) (8.2) (0.0) (100.0)
Unspecified 1 1 4 5 11 79 22 63 164
(%) (1.0) (1.0) (4.0) (5.0) (10.9) (78.2) (100.0)
No information available 53 2 6 61
(%) (100.0) (100.0)
Total 27 165 253 2884 421 346 133 4229 69 6 4304
(%) (0.6) (3.9) (6.0) (68.2) (10.0) (8.2) (3.1) (100.0)
Values in parentheses under each figure represent the percentage relative to the subtotal in each row
Table 17Facility distribution on microbial measurement by frequency and TVC
TVC (cfu/mL) Every day
Every week
Every 2 weeks
Every month
Several times per year
Once a year
None Subtotal Unspecified No information available
Total
<0.1 11 100 185 1962 273 273 1 2805 6 2811
(%) (0.4) (3.6) (6.6) (69.9) (9.7) (9.7) (0.0) (100.0)
0.1≦, <1 18 40 364 68 60 550 1 551
(%) (3.3) (7.3) (66.2) (12.4) (10.9) (100.0)
1≦, <10 3 6 23 267 44 29 372 372
(%) (0.8) (1.6) (6.2) (71.8) (11.8) (7.8) (100.0)
10≦, <100 1 1 5 111 20 17 1 156 156
(%) (0.6) (0.6) (3.2) (71.2) (12.8) (10.9) (0.6) (100.0)
100≦ 1 2 1 22 9 5 40 40
(%) (2.5) (5.0) (2.5) (55.0) (22.5) (12.5) (100.0)
Subtotal 16 127 254 2726 414 384 2 3923 7 3930
(%) (0.4) (3.2) (6.5) (69.5) (10.6) (9.8) (0.1) (100.0)
Unspecified 1 6 18 8 11 141 185 79 264
(%) (0.5) (3.2) (9.7) (4.3) (5.9) (76.2) (100.0)
No information available
99 99 4 7 110
(%) (100.0) (100.0)
Total 16 128 260 2744 422 395 242 4207 90 7 4304
aging of incident dialysis patients, the percentage of patients with nephrosclerosis continued to increase steadily. The percentage of patients with “ unspeci-fied” primary diseases was the fourth highest (11.3%). In addition, polycystic kidney disease (PKD), rapidly progressive glomerulonephritis (RPGN), lupus, and chronic pyelonephritis were also observed as primary diseases. However, the percentages of these primary diseases among the incident dialysis patients were 0.7–2.7%, which were much lower than
the percentages of patients with the abovementioned top three primary diseases and unspecified diseases, and had shown no marked increase or decrease over the past 20 years.
Chronic glomerulonephritis was the most common primary disease in the prevalent dialysis patients but the percentage of chronic glomerulonephritis has been decreasing. In contrast, the percentage of diabetes has been increasing and it has been the most common primary disease in the prevalent dialysis patients since 2011. (Table 10 lower panel, Fig. 3 Right) In 2014, the percentage of diabetes further increased (38.1%), whereas that of chronic glomerulonephritis further decreased (31.3%). Nephrosclerosis was the third highest percentage of primary disease in the prevalent dialysis patients in 2014 (9.1%). The percentage of nephrosclerosis has been increasing. The percentage of patients with “unspecified” primary diseases was the fourth highest (8.9%). In addition, polycystic
Table 18Facility distribution on microbial measurement by cultivating medium and sampling volume
Sampling volume Nutrient agar R2A TGEA Blood agar TSA Others Subtotal Unspecified No information available Total
<1 54 161 45 3 3 12 278 22 300
(%) (19.4) (57.9) (16.2) (1.1) (1.1) (4.3) (100.0)
1≦, < 10 90 404 44 6 5 14 563 42 605
(%) (16.0) (71.8) (7.8) (1.1) (0.9) (2.5) (100.0)
10≦, <50 62 645 352 4 13 74 1150 25 1175
(%) (5.4) (56.1) (30.6) (0.3) (1.1) (6.4) (100.0)
50≦, < 100 45 642 571 1 13 85 1357 17 1 1375
(%) (3.3) (47.3) (42.1) (0.1) (1.0) (6.3) (100.0)
100≦, <500 19 263 146 2 17 447 13 460
(%) (4.3) (58.8) (32.7) (0.4) (3.8) (100.0)
500≦, < 1000 2 10 4 1 17 1 18
(%) (11.8) (58.8) (23.5) (5.9) (100.0)
1000≦, <10,000 8 5 1 14 1 15
(%) (57.1) (35.7) (7.1) (100.0)
10,000≦ 1 1 2 2
(%) (50.0) (50.0) (100.0)
Subtotal 272 2134 1168 15 36 203 3828 121 1 3950
(%) (7.1) (55.7) (30.5) (0.4) (0.9) (5.3) (100.0)
Unspecified 3 8 1 12 232 244
(%) (25.0) (66.7) (8.3) (100.0)
No information available 110 110
(%)
Total 275 2142 1169 15 36 203 3840 353 110 4304
(%) (7.2) (55.8) (30.4) (0.4) (0.9) (5.3) (100.0)
Values in parentheses under each figure represent the percentage relative to the subtotal in each row
R2AReasoner’s No. 2 agar,TGEATryptone glucose extract agar,TSATrypticase soy agar
Table 19Facility counts by ETRF installation
With ETRF
Without ETRF
Subtotal No information available
Total
Number of facilities 4136 159 4295 9 4304
(%) (96.3) (3.7) (100.0)
kidney disease, chronic pyelonephritis, lupus, and RPGN were also observed as primary diseases. How-ever, the percentages of these primary diseases were only 0.7–3.5% and had shown no marked increase or decrease over the past 20 years.
Causes of death
The causes of death in the incident dialysis patients in 2014 were summarized in Table 11. The leading cause of death of them was infectious diseases (25.8%), followed by cardiac failure (23.8%), malignant tumors (11.4%), other causes (11.2%), and unspecified causes (7.8%). The causes of death in the prevalent dialysis patients in 2014 were summarized in Table 12.
Table 13 shows annual changes in the percentages of the leading causes of death in prevalent dialysis pa-tients. Among the prevalent dialysis patients, the lead-ing cause of death in 2014 was cardiac failure (26.3%). The percentage of cardiac failure in prevalent dialysis patients had markedly decreased by the early 1990s, and it has remained almost unchanged. The second leading cause of death was infectious diseases (20.9%); the percentage of it had been increasing by 2009, and it has remained almost unchanged. The percentage of malignant tumors was 9.0%. The per-centage cerebrovascular disease had continued to de-crease since 1995 and was 7.1% in 2014. The percentage of myocardial infarction was 4.3% in 2014.
Table 20Bedside console counts by ETRF installation
Numbers of bedside consoles
Facility status of ETRF installation Subtotal No information
available
Total More than one bedside console
with ETRF in the facility
No bedside consoles with ETRF in the facility Number of bedside consoles
with ETRF
116,527 0 116,527 0 116,527
(%) (100.0) (0.0) (100.0)
Number of bedside consoles without ETRF
11,657 3178 14,835 193 15,028
(%) (78.6) (21.4) (100.0)
Total 128,184 3178 131,362 193 131,555
(%) (97.6) (2.4) (100.0)
Values in parentheses under each figure represent the percentage relative to the subtotal in each row
ETRFendotoxin retentive filter
Table 21Facility distribution on endotoxin measurement by endotoxin concentration and ETRF installation on sampling
With or without ETRF when the dialysate was sampled
<0.001 0.001≦, <0.01
0.01≦, <0.05
0.05≦, <0.1
0.1≦, < 0.25
0.25≦, <0.5
0.5≦ Subtotal Unspecified No information available
Total
Without ETRF 412 120 51 10 15 5 5 618 72 21 711
(%) (13.1) (22.2) (24.8) (16.4) (31.9) (27.8) (23.8) (15.3) (62.6) (100.0) (17.0)
With ETRF 2742 421 155 51 32 13 16 3430 43 3473
(%) (86.9) (77.8) (75.2) (83.6) (68.1) (72.2) (76.2) (84.7) (37.4) (83.0)
Subtotal 3154 541 206 61 47 18 21 4048 115 21 4184
(%) (100.0) (100.0) (100.0) (100.0) (100.0) (100.0) (100.0) (100.0) (100.0) (100.0) (100.0)
Unspecified 13 7 5 2 1 2 1 31 49 4 84
(%)
No information available
36 36
(%)
Total 3167 548 211 63 48 20 22 4079 164 61 4304
The classification codes for the causes of death were revised in the 2003 and 2010 surveys. We speculate that these revisions might have had some influence on the distributions of causes of death. These revisions were de-tailed in the annual data report 2010 [6].
Annual crude death rate
The annual crude death rate was calculated from the facility survey data as shown in Table 14. The annual crude death rate is defined as the percentage of pa-tients who died each year with respect to the mean
Table 22Facility distribution on microbial measurement by TVC and ETRF installation on sampling
With or without ETRF when the dialysate was sampled
<0.1 0.1~ 1~ 10~ 100 Subtotal Unspecified No information
available
Total
Without ETRF 339 108 73 45 14 579 100 32 711
(%) (12.1) (19.8) (20.2) (29.6) (35.0) (14.8) (46.1) (47.1) (17.0)
With ETRF 2461 437 289 107 26 3320 117 36 3473
(%) (87.9) (80.2) (79.8) (70.4) (65.0) (85.2) (53.9) (52.9) (83.0)
Subtotal 2800 545 362 152 40 3899 217 68 4184
(%) (100.0) (100.0) (100.0) (100.0) (100.0) (100.0) (100.0) (100.0) (100.0)
Unspecified 11 6 10 4 31 47 6 84
(%)
No information available 36 36
(%)
Total 2811 551 372 156 40 3930 264 110 4304
(%)
Values in parentheses under each figure represent the percentage relative to the subtotal in each column
ETRFendotoxin retentive filter,TVCtotal viable microbial count
Table 23Facility distribution by endotoxin concentration and TVC
Bacterial counts in dialysate (cfu/mL)
<0.001 0.001≦, <0.01 0.01≦, <0.05 0.05≦, <0.1 0.1≦, <0.25 0.25≦, <0.5 0.5≦ Subtotal Unspecified No information available
Total
<0.1 2602 153 29 9 7 3 3 2806 5 2811
(%) (92.7) (5.5) (1.0) (0.3) (0.2) (0.1) (0.1) (100.0)
0.1~ 291 186 43 16 5 2 4 547 4 551
(%) (53.2) (34.0) (7.9) (2.9) (0.9) (0.4) (0.7) (100.0)
1~ 137 125 67 11 21 5 4 370 2 372
(%) (37.0) (33.8) (18.1) (3.0) (5.7) (1.4) (1.1) (100.0)
10~ 40 45 35 17 7 6 6 156 156
(%) (25.6) (28.8) (22.4) (10.9) (4.5) (3.8) (3.8) (100.0)
100 12 6 9 4 3 3 3 40 40
(%) (30.0) (15.0) (22.5) (10.0) (7.5) (7.5) (7.5) (100.0)
Subtotal 3082 515 183 57 43 19 20 3919 11 3930
(%) (78.6) (13.1) (4.7) (1.5) (1.1) (0.5) (0.5) (100.0)
Unspecified 61 23 16 5 4 1 1 111 151 2 264
(%) (55.0) (20.7) (14.4) (4.5) (3.6) (0.9) (0.9) (100.0)
No information available
24 10 12 1 1 1 49 2 59 110
(%) (49.0) (20.4) (24.5) (2.0) (2.0) (2.0) (100.0)
Total 3167 548 211 63 48 20 22 4079 164 61 4304
(%) (77.6) (13.4) (5.2) (1.5) (1.2) (0.5) (0.5) (100.0)
Values in parentheses under each figure represent the percentage relative to the subtotal in each row
annual dialysis patient counts. Table 14 shows the an-nual crude death rates between 1993 and 2014. It had remained in the range of 9.0–9.9% until 2010 but was in the range of 10.0–10.9% in 2011 and 2012. How-ever, it was again in the range of 9.0–9.9% (9.8% in 2013 and 9.7% in 2014).
Cumulative survival rate of incident dialysis patients since 1983
The cumulative survival rates of the incident dialysis patients by the year of starting dialysis since 1983 are summarized in Table 15. The 1- to 10-year sur-vival rates were the lowest for patients who started dialysis in 1992 and were increasing in patients in 1993 or later. However, the 5-year survival rate for patients who started dialysis between 2003 and 2009 and the 10-year survival rate for between 1998 and
2004 remained almost unchanged. The 20- or more year survival rates tended to decrease.
Chapter 2: Current status of microbiological quality of dialysis fluid and its control
Measurement of endotoxin concentration in dialysis fluid
Among 4304 facilities that had at least one bedside con-sole, 4229 facilities (98.3%) responded to the question about the frequency for measuring endotoxin. The JSDT standard [7] for microbiological quality of dialysis fluid recommends that the endotoxin concentration in dialy-sis fluid should be measured at least once a month. The percentage of the facilities that satisfied this recommen-dation was 78.7%, a slight increase from the previous year as 77.7% (Table 16).
Four thousand seventy-nine facilities (94.8%) responded to the question about the endotoxin concentration.
Table 24Annual changes in frequency of endotoxin measurement
Frequency of measurement (per month) 2006 2007 2008 2009 2010 2011 2012 2013 2014
1≦ 953 1153 1253 1373 2810 2914 3141 3238 3329
(%) (27.3) (31.5) (33.1) (36.0) (70.6) (71.9) (76.3) (77.7) (78.7)
<1 2535 2511 2531 2436 1170 1137 977 929 900
(%) (72.7) (68.5) (66.9) (64.0) (29.4) (28.1) (23.7) (22.3) (21.3)
Subtotal 3488 3664 3784 3809 3980 4051 4118 4167 4229
(%) (100.0) (100.0) (100.0) (100.0) (100.0) (100.0) (100.0) (100.0) (100.0)
Unspecified 185 209 244 193 92 99 77 65 69
No information available 312 179 53 48 52 27 8 3 6
Total 3985 4052 4081 4050 4124 4177 4203 4235 4304
Values in parentheses under each figure represent the percentage relative to the total in each column
Table 25Annual change in endotoxin concentration in dialysis fluid
2006 2007 2008 2009 2010 2011 2012 2013 2014
<0.001 817 1688 – 1865 2343 2549 2787 2963 3167
(%) (29.8) (53.0) – (56.1) (62.1) (66.0) (70.7) (73.9) (77.6)
0.001≦, <0.05 1627 1295 – 933 1115 1042 938 849 759
(%) (59.2) (40.6) – (28.1) (29.6) (27.0) (23.8) (21.2) (18.6)
0.05≦ 302 203 – 527 314 271 216 195 153
(%) (11.0) (6.4) – (15.8) (8.3) (7.0) (5.5) (4.9) (3.8)
Subtotal 2746 3186 – 3325 3772 3862 3941 4007 4079
(%) (100.0) (100.0) – (100.0) (100.0) (100.0) (100.0) (100.0) (100.0)
Unspecified – 215 – 253 105 112 197 148 164
No information available 1239 651 – 472 247 203 65 80 61
According to the standard, ultrapure dialysis fluid (UPD) defined as endotoxin <0.001 EU/mL and total viable microbial count (TVC) <0.1 cfu/mL is recom-mended for all dialysis modalities; and standard dia-lysis fluid defined as endotoxin <0.05 EU/mL and TVC <100 cfu/mL is the minimum desirable quality to ensure the safety of dialysis therapy [7]. Endotoxin concentration of <0.001 and <0.05 EU/mL were achieved in 77.6 and 96.2% of the 4079 facilities, re-spectively. These percentages were higher than those in the previous year as 73.9 and 95.1%, respectively (Table 16).
Measurement of TVC in dialysis fluid
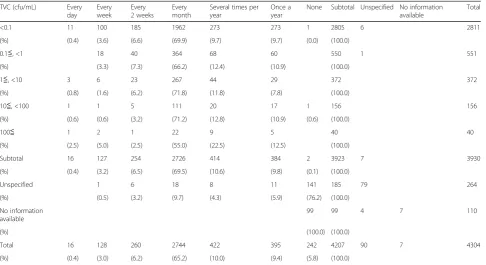
Four thousand twenty-seven (97.7%) among all 4304 facilities responded to the question about the fre-quency of measurement of TVC. The JSDT standard [7] recommends that the TVC in dialysis fluid should
be measured at least once a month. The percentage of the facilities that satisfied this recommendation was 74.8% as similar as 74.7% in 2013 (Table 17).
Three thousand nine hundred thirty facilities (91.3%) responded to the question about the TVC in dialysis fluid. As previously addressed, JSDT guideline defined two qualities on TVC: UPD as <0.1 cfu/mL and the standard dialysis fluid as 100 cfu/mL. TVC of <0.1 and <100 cfu/mL were achieved in 71.5 and 99.0% of the facilities that responded, respectively (Table 17).
Three thousand eight hundred forty of the facilities (89.2%) responded to the question about the culturing media for TVC. In the JSDT standard, Reasoner’s No. 2 agar (R2A) and tryptone glucose extract agar (TGEA) are recommended for TVC in dialysis fluid. The survey results showed that either of these media was used by 86.2% of the facilities that responded.
Table 26Annual changes in frequency of TVC measurement
Frequency of measurement (per month) 2006 2007 2008 2009 2010 2011 2012 2013 2014
1≦ 371 580 751 934 2649 2794 3018 3091 3148
(%) (11.5) (16.9) (20.8) (25.8) (67.8) (70.0) (73.7) (74.7) 74.8%
<1 2857 2861 2856 2693 1260 1196 1077 1046 1059
(%) (88.5) (83.1) (79.2) (74.2) (32.2) (30.0) (26.3) (25.3) (25.2)
Subtotal 3228 3441 3607 3627 3909 3990 4095 4137 4207
(%) (100.0) (100.0) (100.0) (100.0) (100.0) (100.0) (100.0) (100.0) (100.0)
Unspecified 386 412 418 367 158 159 100 94 90
No information available 371 199 56 56 57 28 8 4 7
Total 3985 4052 4081 4050 4124 4177 4203 4235 4304
Values in parentheses under each figure represent the percentage relative to the subtotal in each column
TVCtotal viable microbial count
Table 27Annual changes in TVC in dialysis fluid
TVC (cfu/mL) 2006 2007 2008 2009 2010 2011 2012 2013 2014
<0.1 508 750 915 1123 1819 2017 2397 2570 2811
(%) (48.4) (47.9) (50.7) (54.5) (53.1) (56.4) (63.8) (67.1) (71.5)
0.1≦, <100 509 775 847 901 1542 1498 1305 1214 1079
(%) (48.5) (49.5) (46.9) (43.7) (45.0) (41.9) (34.7) (31.7) (27.5)
100≦ 32 40 43 38 62 62 55 46 40
(%) (3.1) (2.6) (2.4) (1.8) (1.8) (1.7) (1.5) (1.2) (1.0)
Subtotal 1049 1565 1805 2062 3423 3577 3757 3830 3930
(%) (100.0) (100.0) (100.0) (100.0) (100.0) (100.0) (100.0) (100.0) (100.0)
Unspecified 2036 552 575 494 216 227 320 273 264
No information available 900 1935 1701 1494 485 373 126 132 110
Total 3985 4052 4081 4050 4124 4177 4203 4235 4304
Values in parentheses under each figure represent the percentage relative to the subtotal in each column
Three thousand nine hundred fifty of the facilities (91.8%) responded to the question about the sampling volume for TVC. As previously addressed, the JSDT standard recommended that UPD should be indicated for all types of extracorporeal dialysis treatments [7]. The requirement of TVC for UPD is <0.1 cfu/mL so it needs equal or greater than 10 mL of sampling vol-ume of dialysis fluid. At least 10 mL of sampling was performed in 77.1% of the facilities that responded (Table 18). As previously addressed, UPD should sat-isfy both an endotoxin <0.001 EU/mL and TVC of <0.1 cfu/mL. However, the percentage of the facilities that satisfied TVC of <0.1 cfu/mL (71.5%) was ap-proximately 6% lower than that of the facilities that satisfied the endotoxin <0.001 EU/mL (77.6%), indi-cating the need for the improvement of dialysis fluid quality control.
Installation of endotoxin retentive filters
Four thousand two hundred ninety-five (99.8%) responded to questions regarding the installation of endotoxin retentive filters (ETRFs). Among these 4295 facilities, 96.3% had at least one bedside console equipped with an ETRF (Table 19). The 4304 facilities that responded to the questions about the installation of ETRFs had a total of 131,555 bedside consoles, 88.6% of which were equipped with an ETRF. The percentage of bedside consoles equipped with an ETRF increased by 2.6% from the previous year (86.0%) (Table 20) [2].
Theoretically, UPD can be achieved by using an
may have some problems in preventing the contami-nations, such as a high contamination level of raw water, a high level of secondary contamination, con-tamination of ETRF itself, or concon-tamination during sampling. These facilities need to optimize their maneuver of the disinfection of the entire system. The percentages of facilities that did not achieve the required endotoxin of <0.001 EU/mL and TVC of <0.1 cfu/mL with ETRFs were 20.1 and 25.9%, re-spectively (Tables 21 and 22). Standard dialysis fluid should have an endotoxin of <0.050 EU/mL and TVC of <100 cfu/mL. Among the facilities that had bedside consoles equipped with an ETRF, 3.3% did not achieve the required endotoxin and 0.8% did not achieve the required TVC. In contrast, 66.7 and 58.5% of the facilities without ETRFs satisfied the endotoxin and TVC of UPD, respectively. These re-sults suggest that the technologies for purifying dia-lysis fluid have advanced to ensure the purification in the entire dialysate supply system. However, the data also suggested that dialysis fluid was contami-nated by mal-handlings of an ETRF in some cases.
Endotoxin concentration and TVC in dialysis fluid
According to the JSDT standard for on the microbio-logical quality of dialysis fluid, UPD is recommended for all dialysis methods [7]. UPD is defined as an endotoxin of <0.001 EU/mL (lower than the detection limit) and TVC of <0.1 cfu/mL [7]. Among the 4304 facilities that had at least one bedside console, 3919 (91.1%) responded to each question of endotoxin and
Table 28Annual patient count by in-center extracorporeal dialysis modality
Dialysis method 2009 2010 2011 2012 2013 2014
Facility HD 253,807 262,973 270,072 268,275 264,211 255,641
HDF On-line HDF 6852 4829 4890 14,069 23,536 36,090
(%) (40.7) (32.5) (34.6) (64.8) (75.0) (83.4)
Off-line HDF 9299 9421 8573 7157 7149 6315
(%) (55.2) (63.4) (60.7) (32.9) (22.8) (14.6)
Push/Pull HDF 237 159 145 109 263 537
(%) (1.4) (1.1) (1.0) (0.5) (0.8) (1.2)
AFBF 465 458 507 390 423 341
(%) (2.8) (3.1) (3.6) (1.8) (1.3) (0.8)
HDF subtotal 16,853 14,867 14,115 21,725 31,371 43,283
(%) (100.0) (100.0) (100.0) (100.0) (100.0) (100.0)
HD + HDF total 270,660 277,840 284,187 290,000 295,582 298,924
Values in parentheses under each figure represent the percentage relative to the HDF subtotal in each column
Table 29Patient distribution on all types of HDF by gender and age
Age Male Female Subtotal No information
available
Total
<5 2 2 2
(%) (0.0) (0.0) (0.0)
5~9
(%)
10~14
(%)
15~19 7 5 12 12
(%) (0.0) (0.0) (0.0) (0.0)
20~24 24 12 36 36
(%) (0.1) (0.1) (0.1) (0.1)
25~29 87 37 124 124
(%) (0.3) (0.2) (0.3) (0.3)
30~34 199 96 295 295
(%) (0.7) (0.6) (0.7) (0.7)
35~39 514 212 726 726
(%) (1.9) (1.3) (1.7) (1.7)
40~44 1155 491 1646 1646
(%) (4.2) (3.1) (3.8) (3.8)
45~49 1671 781 2452 2452
(%) (6.1) (4.9) (5.7) (5.7)
50~54 2142 1016 3158 3158
(%) (7.8) (6.4) (7.3) (7.3)
55~59 2837 1452 4289 4289
(%) (10.4) (9.1) (9.9) (9.9)
60~64 4064 2369 6433 6433
(%) (14.9) (14.8) (14.9) (14.9)
65~69 4802 2863 7665 7665
(%) (17.6) (17.9) (17.7) (17.7)
70~74 4010 2467 6477 6477
(%) (14.7) (15.5) (15.0) (15.0)
75~79 2927 1903 4830 4830
(%) (10.7) (11.9) (11.2) (11.2)
80~84 1903 1352 3255 3255
(%) (7.0) (8.5) (7.5) (7.5)
85~89 781 706 1487 1487
(%) (2.9) (4.4) (3.4) (3.4)
90~94 171 180 351 351
(%) (0.6) (1.1) (0.8) (0.8)
95≦ 17 25 42 42
(%) (0.1) (0.2) (0.1) (0.1)
Subtotal 27,313 15,967 43,280 43,280
Table 29Patient distribution on all types of HDF by gender and age(Continued)
(%) (100.0) (100.0) (100.0) (100.0)
Unknown 3 3 3
No information available
Total 27,316 15,967 43,283 43,283
Mean age 64.32 66.30 65.05 65.05
S.D. 12.40 12.27 12.39 12.39
Values in parentheses under each figure represent the percentage relative to the subtotal in each column
HDFhemodiafiltration
Table 30Patient distribution by in-center HD/HDF and primary disease
Primary disease In-cnter HD (%) HDF (%)
Chronic glomerular nephritis 76,117 (29.8) 16,311 (37.7)
Chronic pyelonephritis 2456 (1.0) 462 (1.1)
RPGN 2106 (0.8) 304 (0.7)
PIH 1156 (0.5) 378 (0.9)
Unclassified nephritis 1058 (0.4) 207 (0.5)
PKD 9081 (3.6) 1593 (3.7)
Nephrosclerosis 24,036 (9.4) 3132 (7.2)
Hypertensive emergencies 2110 (0.8) 346 (0.8)
Diabetes 100,830 (39.4) 14,284 (33.0)
Lupus 1757 (0.7) 394 (0.9)
Amyloidosis 376 (0.1) 64 (0.1)
Gout 907 (0.4) 163 (0.4)
Inborn errors of metabolism 201 (0.1) 50 (0.1)
Tuberculosis 175 (0.1) 24 (0.1)
Urolithiasis 488 (0.2) 72 (0.2)
Neoplasm of kidney and urinary tract
771 (0.3) 100 (0.2)
Urinary tract obstructive 616 (0.2) 80 (0.2)
Myeloma 245 (0.1) 23 (0.1)
Hypoplastic kidney 455 (0.2) 111 (0.3)
Undetermined 22,799 (8.9) 3763 (8.7)
Rejected kidney 1613 (0.6) 450 (1.0)
Others 6288 (2.5) 972 (2.2)
Subtotal 255,641 (100.0) 43,283 (100.0)
No information available
Total 255,641 43,283
Values in parentheses on the right side of each figure represent the percentage relative to the subtotal in each column