R E S E A R C H
Open Access
Squared frequency-
Kt
/
V
: a new index of
hemodialysis adequacy
—
correlation with
solute concentrations by computer simulation
Kaya Murakami
1, Kenichi Kokubo
1,2,3*, Minoru Hirose
1,2, Kozue Kobayashi
1,2and Hirosuke Kobayashi
1,2Abstract
Background:In patients undergoing home dialysis, conventionally,Kt/Vhas been regarded as an index of the removal efficiency per dialysis session. However, more recently, it has been considered that the hemodialysis product (HDP), rather than theKt/V, is better associated with the clinical symptoms and outcomes in patients undergoing short daily dialysis or nocturnal dialysis. Nevertheless, the HDP lacks a theoretical background, and it does not take into consideration the dialyzer clearance or patient’s body size. The aims of the present study were to clarify the theoretical validity of HDP focusing on its association with solute concentration by computer simulation and to propose a new index of hemodialysis adequacy.
Methods:We used compartment models and calculated the time course of urea andβ2microglobulin (β2MG)
concentrations to determine the peak concentrations and time-averaged concentrations at varying dialysis frequencies (n= 2–7 sessions/week) and durations of dialysis per session (t= 1 to 8 h dialysis sessions).
Results:It was found that the peak concentrations of urea andβ2MG were significantly correlated with the HDP. Based
on this, we theoretically extracted the factor related to the peak concentration and defined the squared frequency-Kt/V (sf-Kt/V), as a new index for determining hemodialysis adequacy (sf-Kt/V = n2Kt/V;K,clearance;V, solute distribution volume;n, frequency;t, dialysis time); this index was well correlated with the peak concentrations of urea andβ2MG,
even when the values ofKandVwere changed.
Conclusions:Since thesf-Kt/Vis an index that reflects peak concentrations of urea andβ2MG, which takes into
account the dialysis frequency, session duration, dialyzer clearance, and the body weight of the patient, it will be a very useful tool for determining appropriate dialysis schedules and dialysis conditions for individual patients.
Keywords:Kt/V, Hemodialysis product, Adequacy of dialysis, Home hemodialysis
Background
Home hemodialysis has the advantage that dialysis sched-ule (frequency and duration of dialysis) can be changed at the patients’own convenience. Many modalities of dialysis suitable for home hemodialysis have been proposed, in-cluding short daily dialysis [1], nocturnal dialysis [2–5], and daily nocturnal dialysis [6]. Home hemodialysis has been reported to be linked to increased survival [1,7, 8], better blood pressure control [2], reduced left ventricular mass [4], improved mineral metabolism [4], enhanced
quality of life [7, 8], and lower cost [2, 3, 5]. In home hemodialysis, since the dialysis schedule can be flexibly determined, a reliable index useful for determining the ap-propriate home dialysis modality, dialysis schedule (fre-quency and duration), and dialysis treatment conditions is required.
The Kt/V is a well-known index of the removal effi-ciency per dialysis session. To compare different dialysis modalities, the standard Kt/V was proposed as an index that can be uniformly used to measure and explicitly com-pare dialysis doses [9–11]. The use of this index was rec-ommended by the National Kidney Foundation Kidney Disease Outcomes Quality Initiative (KDOQI) guidelines [12] in 2006 and also by the most recent KDOQI in 2015 * Correspondence:[email protected]
1Kitasato University Graduate School of Medical Sciences, Sagamihara, Japan 2Kitasato University School of Allied Health Sciences, Sagamihara, Japan
Full list of author information is available at the end of the article
[13], to evaluate the optimal dialysis dose and schedule for frequent dialysis; however, it was still not widely used, probably because (1) its calculation process is quite complex; (2) the calculation required values of single-pool Kt/Vand equilibratedKt/Vto fit the original definition of standardKt/V, a mass generation per unit volume of body fluid normalized by the concentration; and (3) there is little advantage to usestandard Kt/Vas an alternative to Kt/V Daugirdas which has already been widely used in daily clinical practices for three times a week schedule.
It was also reported that the hemodialysis product (HDP), rather than theKt/V, is better correlated with the clinical symptoms and outcomes in patients undergoing short daily dialysis and nocturnal dialysis, the modalities most often used for home hemodialysis [14]. HDP is an index of the adequacy of hemodialysis proposed by Scribner and Oreopoulos [14] in 2002 as their opinion. This index incorporates the dialysis frequency as an im-portant variable:
HDP¼n2t
where n is the dialysis frequency [times/week], and t is the dialysis time per session [h/session].
HDP has been proposed simply based on the very positive results with more frequent dialysis reported by De Palma et al. [15], Buoncristiani et al. [16], Bonomini et al. [17], Pierratos et al. [2, 3], and Lockridge et al. [18]. The HDP has been shown to be well correlated with the patients’symptoms [14], and fewer symptoms [19–28] in dialysis patients has been reported in the treatment at HDP > 70, although these are retrospective observational studies where HDP has not been used as a treatment criterion. Use of the HDP as an index of the adequacy of hemodialysis has major limitations: it is an empirical index that lacks a physiological or theoretical background and ignores the effects of the dialyzer clear-ance and patient’s body size. Therefore, although many types of dialyzers (low flux to super high flux) are
currently available, it is difficult to select a dialyzer and operating condition suitable for short daily dialysis or nocturnal dialysis on the basis of the HDP.
The purpose of the present study was to explore a new index based on solute removal useful for ascertaining the adequacy of hemodialysis that would incorporate dialysis schedule (frequency and duration), the dialyzer clearance, and patient’s body size. To this end, we first sought to identify factors (such as the time-averaged concentrations/peak concentrations) that are strongly correlated with the HDP using a kinetic model. From our results, we developed an index that was also well correlated with these factors and validated the index using a kinetic model.
Methods
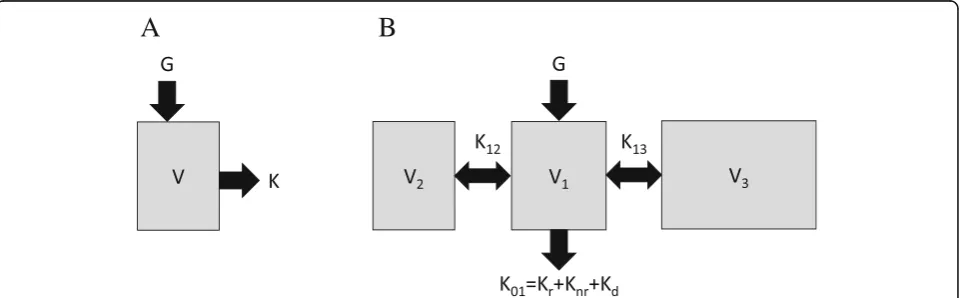
Kinetic model for urea
We used the single-pool model (Fig. 1a) and calculated the time course of the concentrations of urea to deter-mine the peak concentrations and time-averaged con-centrations under various dialysis schedules (Table1).
The change of the blood urea level during dialysis was calculated using the following equation:
V dCBðtÞ
dt ¼−KuCBðtÞ þGu
That is,CBðtÞ ¼KuCBð0Þ−Gu
Ku e
−Kut V þGu
Ku.
And the change of the blood urea level outside the period of dialysis was calculated by the following equation:
V dCBðtÞ
dt ¼−KuCBðtÞ þGu
That is,CBðtÞ ¼Gu
VtþCBðt1Þ
where CB is the blood urea level, CB(t1) is the blood
urea level at the end of dialysis,Kuis the urea clearance,
andGuis the endogenous production rate of urea. Using
these equations, assumingKu= 0, and a steady state (we
A
B
repeatedly calculated the concentrations until the con-centrations at the beginning and end of the week were equal), the time courses of the urea concentrations were calculated by the treatment conditions and the produc-tion rate of urea [29] (Table2).
Kinetic model forβ2-microglobulin
Three-compartment models (Fig.1b) in whichβ2
-micro-globulin (β2MG) was distributed in a slowly moving pool
and fast moving pool were used to calculate the time courses of β2MG concentration under various dialysis
schedules (Table 1). The values of total clearance, inter-compartmental clearance parameters, and compartmen-tal volumes reported by Odell et al [30] forβ2MG were
used. The equation of mass transfer in each compart-ment could be expressed by the following equations:
V1dC1
dt ¼−ðK01þK12þK13ÞC1þK12C2þK13C3 þGβ
V2dC2
dt ¼K12C1−K12C2 V3dC3
dt ¼K13C1−K13C3
K01¼KrþKnrþKd
Vd ¼V1þV2þV3
where Kr, Knr, and Kd are the renal, non-renal, and
dialyzer clearance, respectively. The distribution volume, Vd, is the sum of the compartmental volumes, andGβis
the endogenous production rate of β2MG. The
differential equations were solved numerically using a
Runge-Kutta routine, using reported values [30] (Table3). The time courses of the solute concentrations were calculated by the treatment conditions, such as the mass transfer coefficient between pools, solute produc-tion, and clearance of dialyzer.
We compared the correlation between the peak concentrations/time-averaged concentrations of solutes and the HDP, total dialysis time, or squared frequency-Kt/ V(sf-Kt/V), by determining the coefficients of determin-ation (R2), likelihood (L), and Akaike Information Criterion (AIC).
Model fitness
Regarding HDP (n2t) and total dialysis time (nt), we com-pared which one better estimates peak concentration and time-averaged concentration. Wilcoxon’s signed-rank sum test was used to check whether there was a significant dif-ference in the absolute value of the difdif-ference between the approximate curves calculated by a least squares method and the calculated values by simulation.
Likelihood ratio test was used to compare the HDP (n2t, degree of freedom is 2) andsf-Kt/V(degree of free-dom is 4). We compared the fitness between the HDP or thesf-Kt/Vand the peak concentrations of small mol-ecules at varying dialyzer clearances (Fig. 4a, b), and the fitness between the HDP or the sf-Kt/V and the
Table 2Treatment conditions used to calculate the time courses of urea concentration using a single-pool model
Clearance of urea,Ku 90, 120, 150, 180 [mL/min]
Endogenous production rate of urea,Gu 6.2 [mg/min]
Fluid volume before the start of dialysis,V 36,000 [mL]
Table 3Treatment conditions used to calculate the time courses ofβ2MG concentration using a three-compartment model
Clearance ofβ2MG,Kβ 40, 60, 80 [mL/min]
Non-renal clearance,Knr 2.82 [mL/min]
Renal clearance,Kr 0 [mL/min]
Intercompartmental clearance,K12 75 [mL/min]
Intercompartmental clearance,K13 28.8 [mL/min]
Endogenous production rate,Gβ 0.159 [mg/min]
Fluid volume before the start of dialysis,V 36,000 [mL]
Volume of compartment 1 per body weight 53 [mL/kg]
Volume of compartment 2 per body weight 39 [mL/kg]
Volume of compartment 3 per body weight 109 [mL/kg]
Table 1Setting conditions in the simulation
Group A4 A5 A6 A7 A8 B4 B5 B6 B7 B8 C4 C5 C6 C7 C8 D3 D4
Dialysis frequencies [sessions/week] 2 2 2 2 2 3 3 3 3 3 4 4 4 4 4 5 5
Dialysis time per session [h/session] 4 5 6 7 8 4 5 6 7 8 4 5 6 7 8 3 4
HDP 16 20 24 28 32 36 45 54 63 72 64 80 96 112 128 75 100
Group D5 D6 D7 D8 E2 E3 E4 E5 E6 E7 E8 F1 F2 F3 F4 F5 F6
Dialysis frequencies [sessions/week] 5 5 5 5 6 6 6 6 6 6 6 7 7 7 7 7 7
Dialysis time per session [h/session] 5 6 7 8 2 3 4 5 6 7 8 1 2 3 4 5 6
HDP 125 150 175 200 72 108 144 180 216 252 288 49 98 147 196 245 294
time-averaged concentrations of urea andβ2MG at
vary-ing dialyzer clearances (Fig.4c, d).
First, the maximum log likelihood (L) was calculated from the residual sum of squares of the approximate curves and the calculated values by simulation by the following equation.
logL¼−N
2 log 2ð Þ þπ logσ
2þ1
whereσ2is the maximum likelihood estimator of vari-ance, and N is sample size. The difference of the devi-ance was calculated by multiplying logLby−2,
ΔD¼−2logLHDP−ð−2logLs f−Kt=VÞ
We performed a chi-square test for ΔDwith a differ-ence of 2 degrees of freedom to compare HDP with sf-Kt/V regarding which one would be better for fitting to the peak concentrations of urea andβ2MG at varying
dialyzer clearances.
AIC was also calculated by the following equation:
AIC¼−2Lþ2ðnumber of parametersÞ
When the AIC is smaller, the model is considered to be a better fitting model after taking into account the number of parameters used.
Results
Search for factors correlated with the HDP
We assumed that if we could identify the factors that were more strongly correlated with the HDP than with the total weekly dialysis time, we would be able to esti-mate why HDP (n2t) is better correlated with the clinical symptoms than the total weekly dialysis time (nt). We focused on the peak concentrations and time-averaged concentrations of solute molecules per week. We used a single-pool model to investigate the kinetics of urea and a three-compartment model to investigate the kinetics of
β2MG [30].
The time courses of solute concentrations under vari-ous dialysis schedules (varying dialysis frequencies from 2 to 7/ week and varying dialysis times per session from 1 to 8 h/session) were calculated (Table 1). We deter-mined the peak concentrations and time-averaged con-centrations for each solute.
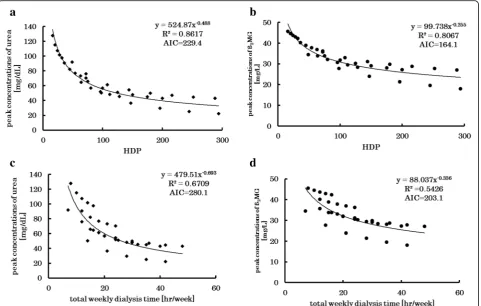
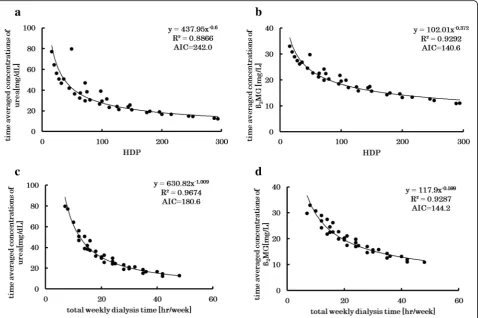
The peak concentrations of all molecules were found to be significantly better correlated with the HDP than with the weekly total dialysis time (Fig. 2). While the time-averaged concentrations of urea were more tightly correlated with weekly total dialysis time than with HDP (Fig. 3). Thus, our results suggested that the HDP is
strongly correlated with the peak concentrations of urea andβ2MG.
The “unphysiological nature” of dialysis may also be demonstrated by the difference between the maximum and minimum concentrations. This parameter was, how-ever, not well correlated with HDP (data not shown).
We propose HDP × K/V (n2t×K/V) as a new index called sf-Kt/V (Appendix). This index incorporates both solute removal (K) and fluid volume of the patient (V), whereas the HDP does not. We then investigated whether this index would still be well correlated with the peak con-centrations of small molecules when the clearance of the dialyzer was varied. The correlation of the sf-Kt/V with the concentrations showed higherR2and lower AIC than that of HDP, and the difference in maximum log likeli-hood (deviance) was statistically large, meaning that the sf-Kt/Vshowed significantly better correlations with the peak concentrations of small molecules than HDP (Fig.4). In other words, while the correlations with the HDP be-came weak when we used a different dialysis clearance, thesf-Kt/Vstill showed strong correlations with the peak concentrations of urea. Sincesf-Kt/Vis obtained by multi-plying HDP byK/V, that is, the dialyzer clearance and pa-tient’s body weight is also considered in the calculation of the sf-Kt/V; this index is deemed as being a useful new index for comparing the adequacy of dialysis based on sol-ute removal (dialysis dose).
While no precise threshold value of the HDP has been determined based on clinical evidence, HDP > 70 pro-posed by Scribner and Oreopoulos [14] is well accepted as being indicative of adequate dialysis. In a patient with a dry weight of 60 kg (body fluid volume, 36 L) undergo-ing dialysis with a dialyzer providundergo-ing an average urea clearance of 160 mL/min and HDP > 70 will be equiva-lent tosf-Kt/V> 18.7.
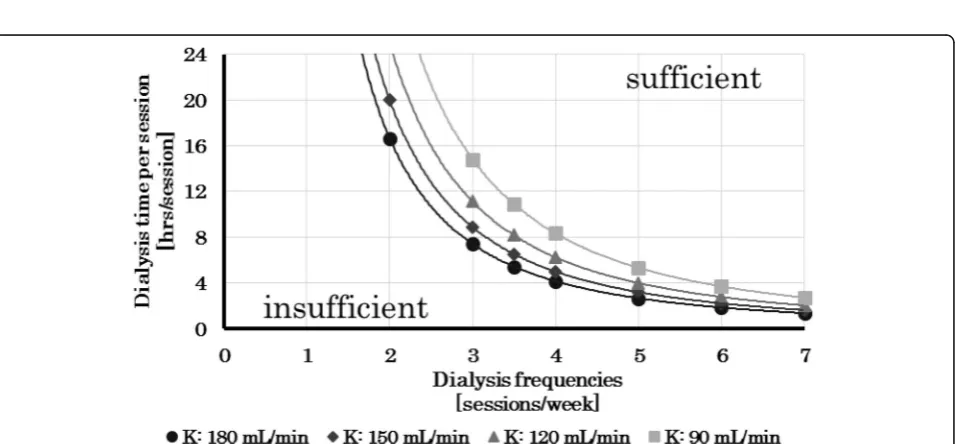
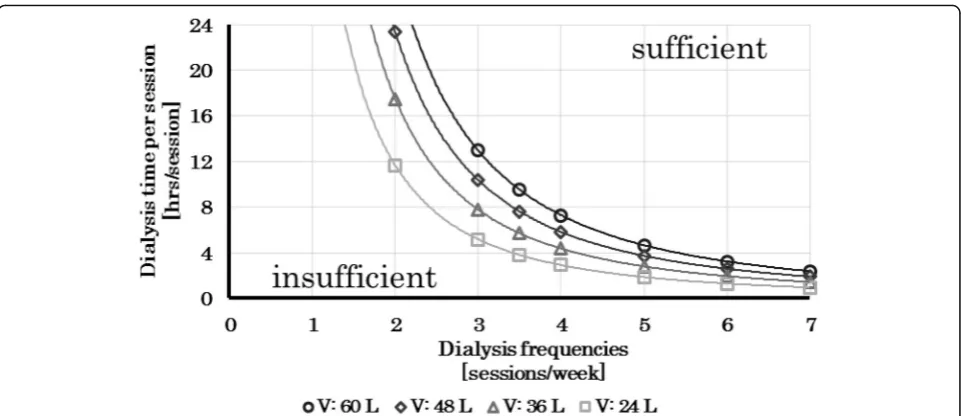
Assuming that HDP > 70 is the threshold value for determining the adequacy of dialysis, we would deter-mine the treatment schedules at varying dialyzer clearances (Fig. 5) and varying patient body weights (Fig. 6) that would yield sf-Kt/V values of over 20. When conducting dialysis four times a week, 6-h dia-lysis sessions are enough to obtain an HDP value of over 70 (42
Discussion
The results of simulations revealed strong correlations of the HDP with the peak concentrations of urea and
β2MG. Considering these results and the fact that the
HDP was empirically related to the clinical symptoms of patients, from viewpoint of solute removal, a large value of HDP would mean smaller peak concentrations, which could explain the reduction of the clinical symptoms.
In the field of pharmacokinetics, the toxicity of the substances is known to be time-dependent and concentration-dependent [31]. The experience that greater the HDP led to lighter the symptoms in dialysis patients [14] and the results we obtained that peak con-centration of urea and β2MG better correlated with
HDP than total dialysis time suggest that the toxicity due to accumulated substances in dialysis patients may concentration-dependent.
Since the results obtained here may be dependent on the parameters listed in Table3, we have illustrated how the re-sults would change when other values are selected for the relevant parameters. When the parameter changed by about 20%, which was the standard deviation of the measured data
in the patients [30] (Table 4), the percent changes of the peak (Table5) and time-averaged concentrations (Table 6) were determined. Intercompartmental clearances and vol-umes of the compartments changed the concentration by a few percentage points, and the endogenous production rate ofβ2MG changed the concentration by 25%. However, the
difference among the schedules was only a few percentage points, which would be expected to have had no significant influence on the correlation between the HDP and the peak concentration or time-averaged concentration.
Ultrafiltration and intercompartmental fluid shift may somehow have an influence, especially the concentra-tions of intermediate-sized molecules like β2MG. We
checked the effects of ultrafiltration (data not shown). The results were similar to those obtained without tak-ing into consideration ultrafiltration, for both urea and
β2MG. In regard to intercompartmental fluid shift, we
can discuss the results of the effects of the changes in the volumes of the compartments and intercompart-mental clearances. The differences in the peak and time-averaged concentrations among the schedules ob-tained by varying the values of these parameters were Fig. 2Peak concentrations vs. HDP and total weekly dialysis time. Relationships between the HDP and peak concentrations of small molecules (a) andβ2MG (b) for various dialysis schedules and the relationships between the total weekly dialysis time and peak concentrations of urea (c) and
only a few percentage points, which would be expected to have exerted no significant influence on the correla-tions between the HDP and peak concentration or time-averaged concentration.
The average weekly clearance per week, that is, EKR, is expressed using time-averaged concentration (TAC) and generation rate as [32,33]:
EKR¼ðG=TACÞ:
If dialysis is performedntimes per week with the same clearance, same dialysis time, and same intervals be-tween the dialysis treatments, the concentration changes during the n dialysis sessions per week would be equal and the total removal amount per week can be calcu-lated as:
EKRTw¼nKt;
whereTwis the total number of minutes in the week =
168 h. In actual clinical situations, although the intervals between dialysis treatments are not the same and the TAC is estimated from limited sampled data (the
exponential decrease in the concentration was not taken into consideration), we may approximate the above as:
EKRTw≒nK t:
This approximation has been shown as a good ap-proximation for thrice-weekly therapy [34]. Therefore, using this approximation:
TAC¼GTw=nK t¼ ð1=ntÞðGTw=KÞ:
This approximation can lead to a difference from the actual value. The difference is considered to be attribut-able to the intervals between dialysis treatments being dif-ferent (therefore, the concentrations at the beginning of each dialysis session are not the same), and the fact that G,K, andVcannot be regarded as constant [34].
Fig. 4Peak concentrations vs. HDP andsf-Kt/V. Relationships between the HDP (a) or thesf-Kt/V(c) and the peak concentrations of urea at for varying dialyzer clearances and relationships between the HDP (b) or thesf-Kt/V(d) and the peak concentrations ofβ2MG at varying dialyzer clearances. When we entered different dialysis clearances, thesf-Kt/Vshowed significantly better correlations with the peak concentrations of both urea andβ2MG than HDP (p< 0.01 for both cases)
Fig. 2d, implying that the dataset (dialysis frequency and dialysis time for each session) was selected with little bias and the influence of time and frequency of dialysis on the peak concentration and average concentration can be ad-equately investigated using this dataset.
Therefore, in this study, a new index sf-Kt/Vwas de-vised considering the factors influencing the peak con-centrations, sf-Kt/V=n2Kt/V. The sf-Kt/V was established as an indicator showing strong correlations with the peak concentrations. Sincesf-Kt/Vis an indica-tor based on solute removal that takes the dialyzer clear-ance and patient’s body size into consideration, it can be used to propose a dialysis schedule appropriate for each individual patient and to determine the appropriate dia-lyzer clearance, dialysis time, dialysis frequency, etc.
Scribner and Oreopoulos recommended HDP > 70 based on the 30-year excellent survival outcome in Tassin [19–23]. HDP > 70 is equivalent to sf-Kt/V> 20 when the dialyzer used assumed to have an average urea clearance is 160 mL/min and the average dry weight of the patient is 60 kg. Therefore, assuming that HDP > 70 is a threshold value for determining the adequacy of dialysis, it can be considered that ansf-Kt/Vvalue of about 20 for urea may be an approximate threshold of an indicator of the ad-equacy of dialysis. Currently, there are no data on
comparisons of the clinical efficacy usingsf-Kt/Vas an in-dicator, and we propose to analyze clinical data in the fu-ture to establish a satisfactory threshold ofsf-Kt/V. As this threshold value can be determined for each solute, it is ne-cessary to clarify these thresholds not only for urea but also forβ2MG.
When we calculate sf-Kt/V, single-pool Kt/V can be used for urea and equilibrated Kt/Vfor β2MG as Kt/V.
For simple calculation to determine the dialysis sched-ule, dialysis time, and dialyzer clearance, we can use K as the dialyzer clearance corrected by the blood and di-alysate flow rate,tas the dialysis time, andVas the esti-mated body fluid volume. However, if we use this simple calculation,sf-Kt/V would be affected by the differences between the estimated and actual body fluid volume and between the calculated clearance and actual clearance caused by a decrease in the actual blood flow rate or re-circulation. Therefore, when conducting cohort studies or randomized controlled trials to determine the thresh-old value of sf-Kt/V, it is considered better to use single-pool Kt/V for urea and equilibrated Kt/V for
β2MG for the calculation ofsf-Kt/V.
There were several limitations of the present study. This study was not a clinical study. Whether it is indeed an ap-propriate index is yet to be confirmed by a cohort study Fig. 6Dialysis schedules that would yieldsf-Kt/Vvalues of over 20 for varying body weights of the patient at constantK(K= 180 mL/min). Each line shows the schedule that would yield ansf-Kt/Vvalue of 20. The area above this line represents the dialysis times/frequencies that yieldsf-Kt/V values of over 20. As the body weight of the patient increases, the dialysis time/frequency needed to obtain ansf-Kt/Vvalue of over 20 increases. Thus, the optimal dialysis schedule depends on the patient’s body weight
Table 4Values of the parameters of three-compartment model applied for measured data ofβ2MG in patients [30]
V1[mL/kg] Knr[mL/min/kg] V2[mL/kg] K12[mL/min/kg] V3[mL/kg] K13[mL/min/kg] Gβ[mg/hour/kg] Mean ± SD 53 ± 9 0.047 ± 0.010 39 ± 11 1.25 ± 0.25 109 ± 27 0.48 ± 0.09 0.159 ± 0.041
Ratio of SD [%] ± 17 ± 21 ± 28 ± 20 ± 25 ± 19 ± 26
or randomized controlled trial. Furthermore,sf-Kt/V> 20 was also calculated by assuming that HDP > 70 is the threshold value for determining the adequacy of the dialysis schedule; however, HDP > 70 has not yet been con-firmed by clinical trials whether this threshold value is ap-propriate or not. WhenK= 180 mL/min,V= 36,000 mL, the dialysis duration that would yield sf-Kt/Vvalues of over 20 was calculated as 8 h, meaningKt/V= 2.4. Current dialysis guidelines for hemodialysis prescription [35] recommend Kt/V= 1.4 or more as the target dose for thrice-weekly dialy-sis. How to ensure consistency with the current guideline is an important issue while using this index.sf-Kt/Vis also not a precise index, like the standardKt/Vor EKR, and does not reflect the residual kidney function. However, it does reflect the peak concentrations of the accumulated solutes in dialy-sis patients. With further clinical studies, this index has the potential to become a better indicator for determining the adequacy of dialysis in individual patients.
Conclusions
Thesf-Kt/Vis an index that takes into account the dialy-sis frequency, session duration and clearance, and the body weight of the patient and correlates with the peak
concentrations more tightly than HDP. It offers the promise of being a very useful index for determining ap-propriate dialysis schedules and dialysis conditions for individual patients.
Appendix
Development of a new index and its validation
Taking into account the results that the peak concentra-tions of small molecules were better correlated with the HDP than with the total dialysis time and that the HDP has been shown to be well correlated with the clinical symptoms [14], we considered the peak concentrations of small molecules as the candidate factors closely re-lated to the clinical symptoms.
Using a simple kinetic model ignoring changes of the body weight associated with water removal and intake, the concentrations of the solutes just before dialysis for thrice-a-week dialysis were calculated using the follow-ing equations:
C1¼C0 expð−Kt=VÞ þGT1=V
C2¼C1 expð−Kt=VÞ þGT2=V
Table 6The percent changes of time-averaged concentrations determined by the calculation using maximum and minimum value (mean ± SD) of each parameter shown in Table3
Dialysis schedule Percent changes of time-averaged concentration [%]
n t V1 Knr V2 K12 V3 K13 Gβ
Maximum value (mean + SD) 2 7 −2.10 −8.94 −2.27 −0.07 −0.40 −1.88 25.79
3 4 −1.88 −8.92 −1.89 −0.18 0.65 −1.75 25.75
5 7 −2.40 −4.98 −2.79 −0.12 −0.33 −2.30 25.82
7 4 −2.79 −5.08 −2.30 −0.33 1.29 −2.23 25.74
Minimum value (mean−SD) 2 7 2.25 10.75 2.57 0.11 1.15 2.45 −25.79
3 4 2.36 10.85 2.40 0.30 −0.56 1.96 −25.76
5 7 2.99 5.56 3.33 0.19 1.13 3.05 −25.77
7 4 3.09 5.66 3.00 0.46 −1.48 2.52 −25.82
Table 5The percent changes of the peak concentrations determined by the calculation using maximum and minimum value (mean ± SD) of each parameter shown in Table3
Dialysis schedule Percent changes of peak concentrations [%]
n t V1 Knr V2 K12 V3 K13 Gβ
Maximum value (mean + SD) 2 7 −1.76 −11.30 −2.07 −0.02 −3.28 −0.56 25.79
3 4 −1.69 −10.61 −2.09 −0.06 −2.80 −0.69 25.77
5 7 −2.45 −6.76 −3.18 −0.04 −4.58 −1.02 25.89
7 4 −3.02 −5.63 −2.99 −0.19 −1.34 −1.97 25.78
Minimum value (Mean− SD) 2 7 1.81 13.93 2.18 0.03 4.12 0.74 −25.79
3 4 2.04 13.08 2.32 0.09 3.72 0.83 −25.65
5 7 2.98 7.67 3.66 0.06 6.27 1.45 −25.77
C0¼C2 expð−Kt=VÞ þGT3=V
whereKis the dialysis clearance [mL/min];tis the dialy-sis time per session [min]; T1,T2, and T3are the
inter-dialysis times;Vis the body fluid volume [mL]; andGis the generation of solutes [mg/min].
IfT3is the maximum dialysis interval,C0becomes the
peak concentration per week,Cpeak:
Cpeak¼
G
V T3þT2exp−
−Kt V
þT1exp − 2Kt V
1−exp −3Kt V
Similarly, in the case of four-times-a-week dialysis, the following equation can be obtained.
Cpeak¼ G
V T4þT3exp−
−Kt V
þT2exp −2Kt V
þT1exp− −3Kt
V
1−exp −4Kt
V
From these equations, in the case of the condition that theKt/Vis greater than 1, the peak concentration,Cpeak,
will become higher when the maximum dialysis interval becomes longer, or when the dialysis frequency (n) de-creases or theKt/Vbecomes less.
Therefore, the peak concentration would be well cor-related with: n Kt V 1 Tmax ;
where Tmax is the maximum interval between dialysis
sessions [h].
This can be arranged into a dimensionless form asnðKt VÞ
ðTw
TmaxÞ
This index should be well correlated with theCpeak. If
the intervals between dialysis sessions are equal, then:
Tmax≒Tw n ;
and the following equation can be obtained.
n Kt V
Tw Tmax
≒n2 Kt
V ¼n
2
t K V
Because HDP =n2t, it is easy to conceive why the peak concentrations of small molecule solutes are well corre-lated with the HDP as well as this index. This index in-corporates both solute removal (K) and fluid volume of the patient (V), whereas the HDP does not. Therefore, this index can be used more flexibly, and we propose this index as a new index called squared frequency-Kt/V (sf-Kt/V).
Abbreviations
AIC:Akaike Information Criterion;CB: Blood level [mg/mL];Cpeak: Peak concentration per week [mg/mL]; EKR: Average weekly clearance per week [mL/min];Gu: Endogenous production rate of urea [mg/min];
Gβ: Endogenous production rate ofβ2-microglobulin [mg/min]; HDP: Hemodialysis product;K: Dialysis clearance [mL/min];Kd: Dialyzer clearance [mL/min];Knr: Non-renal clearance [mL/min];Kr: Renal clearance [mL/min];Ku: Clearance of urea [mL/min];L: Likelihood;n: Dialysis frequency [sessions/week];N: Sample size;R2: Coefficients of determination;sf-Kt/ V: Squared frequency-Kt/V;t: Dialysis time per session for HDP [h/session]; t: Dialysis time per session [min/session];T1,T2,T3: Inter-dialysis times [min]; TAC: Time-averaged concentration [mg/mL];Tw: Total number of minutes in a week (10,080 min) [min];V: Body fluid volume [mL];V1,V2,V3: Volume of compartments 1, 2, and 3 per body weight [mL/kg];Vd: The sum of the compartmental volumes [mL];β2MG:β2-microglobulin;σ2: Maximum likelihood estimator of variance
Acknowledgements
Not applicable.
Funding
Institutional research fund.
Availability of data and materials
Not applicable.
Authors’contributions
KM provided the research design, carried out the simulation and data analysis, and wrote the manuscript. KeKo provided the working hypothesis, participated in the research design, and wrote the manuscript. MH and KoKo participated in the research design and substantially contributed to the study concept. HK provided the working hypothesis, participated in the research design, and substantially contributed to the study concept. All authors read and approved the final manuscript.
Ethics approval and consent to participate
Not applicable.
Consent for publication
Not applicable.
Competing interests
The authors declare that they have no competing interests.
Publisher’s Note
Springer Nature remains neutral with regard to jurisdictional claims in published maps and institutional affiliations.
Author details
1Kitasato University Graduate School of Medical Sciences, Sagamihara, Japan. 2Kitasato University School of Allied Health Sciences, Sagamihara, Japan. 3
Department of Medical Engineering and Technology, Kitasato University School of Allied Health Sciences, 1-15-1 Kitasato, Minami-ku, Sagamihara, Kanagawa 252-0373, Japan.
Received: 27 September 2018 Accepted: 8 January 2019
References
1. Kjellstrand CM, Buoncristiani U, Ting G, Traeger J, Piccoli GB, Sibai-Galland R, et al. Short daily haemodialysis: survival in 415 patients treated for 1006 patient-years. Nephrol Dial Transplant. 2008;23:3283–9.
2. Pierratos A, Ouwendyk M, Francoeur R, Vas S, Raj DS, Ecclestone AM, et al. Nocturnal hemodialysis: three-year experience. J Am Soc Nephrol. 1998;9:859–68. 3. Pierratos A. Nocturnal home haemodialysis: an update on a 5-year
experience. Nephrol Dial Transplant. 1999;14:2835–40.
5. Agar JW, Knight RJ, Simmonds RE, Boddington JM, Waldron CM, Somerville CA. Nocturnal haemodialysis: an Australian cost comparison with conventional satellite haemodialysis. Nephrology (Carlton). 2005;10:557–70. 6. Pierratos A. Daily nocturnal home hemodialysis. Kidney Int. 2004;65:1975–86. 7. Mowatt G, Vale L, MacLeod A. Systematic review of the effectiveness of
home versus hospital or satellite unit hemodialysis for people with end-stage renal failure. Int J Technol Assess Health Care. 2004;20:258–68. 8. Oberley ET, Schatell DR. Home hemodialysis: survival, quality of life, and
rehabilitation. Adv Ren Replace Ther. 1996;3:147–53.
9. Gotch FA. The current place of urea kinetic modelling with respect to different dialysis modalities. Nephrol Dial Transplant. 1998;13(Suppl 6):S10–4. 10. Leypoldt JK, Jaber BL, Zimmerman DL. Predicting treatment dose for novel
therapies using urea standard Kt/V. Semin Dial. 2004;17:142–5.
11. Diaz-Buxo JA, Loredo JP. Standard Kt/V: comparison of calculation methods. Artif Organs. 2006;30:178–85.
12. National Kidney Foundation. KDOQI Clinical Practice Guidelines and Clinical Practice Recommendations for 2006 updates: hemodialysis adequacy, peritoneal dialysis adequacy and vascular access. Am J Kidney Dis. 2006; 48(Suppl 1):S1–S322.
13. National Kidney Foundation. KDOQI Clinical Practice Guideline for Hemodialysis Adequacy: 2015 update. Am J Kidney Dis. 2015;66:884–930. 14. Scribner BH, Oreopoulos DG. The hemodialysis product (HDP): a better index
of dialysis adequacy than Kt/V. Dialysis & Transplantation. 2002;31:13–5. 15. DePalma JR, Pecker EA, Maxwell MH. A new automatic coil dialyser system
for“daily”dialysis. Hemodial Int. 2004;8:19–23.
16. Buoncristiani U, Quintaliani G, Cozzari M, Giombini L, Ragaiolo M. Daily dialysis: long-term clinical metabolic results. Kidney Int. 1988;33(Suppl 24):S137–40. 17. Bonomini V, Mioli V, Albertazzi A, Scolari P. Daily-dialysis programme:
indications and results. Nephrol Dial Transplant. 1998;13:2774–7. 18. Lockridge RS, Albert J, Anderson H, Barger T, Coffey L, Craft V, et al. Nightly
home hemodialysis: fifteen months of experience in Lynchburg, Virginia. Home Hemodialysis Int. 1999;3:23–8.
19. Charra B, Calemard E, Cuche M, Laurent G. Control of hypertension and prolonged survival on maintenance hemodialysis. Nephron. 1983;33:96–9. 20. Charra B, Calemard E, Ruffet M, Chazot C, Terrat JC, Vanel T, et al. Survival as
an index of adequacy of dialysis. Kidney Int. 1992;41:1286–91.
21. Charra B, Chazot C, Jean G, Laurent G. Long, slow dialysis. Miner Electrolyte Metab. 1999;25:391–6.
22. Charra B, Laurent G. Long hemodialysis: the key to survival? In: Brown EA, Parfrey PS, editors. Complications of long-term dialysis. Oxford: Oxford University Press; 1999. p. 228–56.
23. Laurent G, Calemard E, Charra B. Long dialysis: a review of fifteen years experience in one centre 1968–1983. Proc Eur Dial Transplant Assoc. 1983;20:122–35. 24. The FHN Trial Group. In-center hemodialysis six times per week versus three
times per week. N Engl J Med. 2010;363:2287–300.
25. Woods JD, Port FK, Orzol S, Buoncristiani U, Young E, Wolfe RA, et al. Clinical and biochemical correlates of starting“daily”hemodialysis. Kidney Int. 1999; 55:2467–76.
26. Ok E, Duman S, Asci G, Tumuklu M, Onen Sertoz O, Kayikcioglu M, et al. Comparison of 4-and 8-h dialysis sessions in thrice-weekly in-centre haemodialysis: a prospective, case-controlled study. Nephrol Dial Transplant. 2011;26:1287–96.
27. Lacson E Jr, Xu J, Suri RS, Nesrallah G, Lindsay R, Garg AX, et al. Survival with three-times weekly in-center nocturnal versus conventional hemodialysis. J Am Soc Nephrol. 2012;23:687–95.
28. Culleton BF, Asola MR. The impact of short daily and nocturnal hemodialysis on quality of life, cardiovascular risk and survival. J Nephrol. 2011;24:405–15. 29. Sargent JA, Gotch FA. The analysis of concentration dependence of uremic
lesions in clinical studies. Kidney Int. 1975;7(Suppl 2):S35–44.
30. Odell RA, Slowiaczek P, Moran JE. Beta2-microglobulin kinetics in end-stage renal failure. Kidney Int. 1991;39:909–19.
31. Begg EJ, Barclay ML, Kirkpatrick CJ. The therapeutic monitoring of antimicrobial agents. Br J Clin Pharmacol. 1999;47:23–30. 32. Popovich RP, Moncrief JW. In: Nolph KD, editor. Transport kinetics.
Peritoneal dialysis, ed. by, vol. 115. Boston: Martinus Nijhoff Publication; 1985.
33. Mineshima M, Suzuki T, Sudo N, Takemoto M, Agishi T, Ota K, et al. Solute removal dynamics in CAPD. Jpn J. Dialysis Therapy. 1983;16:321–4 (Article in Japanese).
34. Mineshima M, Hoshino T, Era K, Nakazato S, Kubo K, Sanaka T, et al. Validity of 1-compartment model for urea on adequate dialysis. Jpn J Artif Organs. 1993;22:320–4 (Article in Japanese).