R E S E A R C H
Open Access
Designing a collaborative visual analytics
system to support users’ continuous analytical
processes
Dong Hyun Jeong
1*, Soo-Yeon Ji
2, Evan A Suma
3, Byunggu Yu
1and Remco Chang
4*Correspondence: [email protected]
1Department of Computer Science and Information Technology, University of the District of Columbia, 4200 Connecticut Avenue NW, 20008 Washington, DC, USA
Full list of author information is available at the end of the article
Abstract
In recent, numerous useful visual analytics tools have been designed to help domain experts solve analytical problems. However, most of the tools do not reflect the nature of solving real-world analytical tasks collaboratively because they have been designed for single users in desktop environments. In this paper, a complete visual analytics system is designed for solving real-world tasks having two integrated components: a single-user desktop system and an extended system suitable for a collaborative environment. Specifically, we designed a collaborative touch-table application (iPCA-CE) by adopting an existing single-user desktop analytical tool (iPCA). With the system, users can actively transit from individual desktop to shared collaborative environments without losing track of their analysis. They can also switch their analytical processes from collaborative to single-user workflows. To understand the usefulness of the system for solving analytical problems, we conducted a user study in both desktop and collaborative environments. From this study, we found that both applications are useful for solving analytical problems individually and collaboratively in different environments.
Keywords: Visual analytics; Collaborative visual analysis; Analysis process; Table-top environment
1 Introduction
Collaboration in real-world analysis can be regarded as a process of working together or sharing decision-making to develop a joint strategy or answer for the given complex tasks. Since collaboration is beneficial for solving complicated tasks, domain experts often work together to solve analytical problems in a collaborative setting [1]. However, it has been known that real-world analysts typically perform both individual and group tasks, and as a result must frequently transition between single-user and multi-user collaborative workflows during the course of their analysis [2,3]. Despite this fact, most visual analytics solutions have been designed either as standalone single-user applications or as purely collaborative systems, and very few analytical tools have been developed that cohesively support both activities.
Although data analysis is often considered to be a stand-alone task, previous research has shown that analysis of empirical data in collaborative environments is important
and should be considered when developing visualization applications [4,5]. While col-laborative analytics can occur in a variety of interaction modalities, we focus specifically on collaboration using a multi-touch table. Specifically, a complete visual analytical sys-tem is designed for solving real-world tasks ought to have two integrated components: a single-user desktop application and an extended system suitable for a collaborative environment. Specifically, an existing single-user desktop analytical tool for exploring data using principal component analysis (called iPCA [6]) is adapted into a collaborative touch-table application (called iPCA-CE [7]). Extending an existing desktop application into a collaborative touch-table environment introduces unique technical challenges. The inherent differences between mouse and touch-based interaction require that the user interface must be redesigned, and limitations may also be imposed by factors such as system performance. However, despite the costs of converting an existing applica-tion into a new interacapplica-tion modality, we believe that supporting both single-user and collaborative work in an integrated fashion provides important benefits for real-world analysis.
With the iPCA and iPCA-CE applications, analysts can perform their analytical tasks by switching back and forth between sign-user desktop and collaborative visual analytics environments. As a result, the system parameters and analytical findings for these tools are tightly integrated so that analysts may seamlessly transition without losing track of the analysts’ analysis process. To support the sharing of analytical results (i.e. findings), which many experts consider it to be the purpose of collaboration [2], we defined an XML-based format for managing the findings from analyses, which can “follow” the user as they transition between single-user and collaborative contexts. In a single-user desktop envi-ronment, we performed a user study to see the effectiveness of iPCA for solving analytical tasks, and creating and sharing findings in a single-user desktop environment. To under-stand how participants cooperate and share their findings for solving analytical tasks in a collaborative environment, we conducted an additional user study with a varying number of available workspaces in a collaborative environment.
This paper is organized as follows. First, we discuss the previous research in collab-orative visualization that is relevant to our approach. In Section 3, we represent our viewpoint to support analysts’ continuous analytical processes in different environments. In Section 4, we provide an overview of our visual analytics tools and outline the technical challenges involved with extending an existing application for deployment in a collabo-rative environment. Next, in Section 5, we then describe the improvements made to our applications to support the sharing of analytical processes. In Sections 6 and 7, we report the user study that was performed to understand users’ analytical processes in a desktop and collaborative environment, respectively. Finally, in Section 8, we discuss future work and conclude the paper.
2 Previous work
Grimstead et al. [9] reviewed 42 collaborative visualization systems in terms of five attributes: number of simultaneous users, user access control, communication architec-ture, type of transmitted data, and user synchronization. They found that a synchronous system, in which all collaboration takes place simultaneously, has the benefits of bring-ing groups of individuals together over a distance, bridgbring-ing the knowledge gaps between them, and building their knowledge structure concurrently. However, they noted that a synchronous system is still limited, in that people have to be in front of computers at the same time. In an asynchronous collaborative visualization system, collaboration occurs at different times. If people are in different time zones and different places, an asynchronous collaborative system might be beneficial, since important knowledge can be shared with others at their own convenience [10].
Mark and Kobsa [11] performed an empirical study to understand the differences between group and individual behavior within collaborative information visualization environments. They found that a group solves the given questions more accurately and spends less time doing so. However, it is still unknown what features should be sup-ported within a collaborative data analysis system on a touch-table in order to reliably gain these benefits. Ma [12] discussed existing web-based collaborative workspaces in terms of sharing high-performance visualization facilities, visualizations, and findings, and noted that sharing visualization resources will eventually provide support for collab-orative workspaces. Despite the numerous collabcollab-orative visualization systems that have been developed, it is still unclear how these systems should be designed, though some guidelines have been suggested. Heer and Agrawala [13] provided design considerations for asynchronous collaboration in visual analytics environments. Additionally, in a review of existing applications in terms of controlling the visualization, Johnson [14] outlined challenges and suggested guidelines for the design of synchronous collaborative visu-alizations. However, none of these guidelines address how analytic processes might be extended across both single-user and collaborative modalities, as we focus on in this paper.
In a co-located collaborative environment, numerous studies [15-17] have been per-formed to understand users’ collaborative analytical processes and how best to design useful collaborative visualization or visual analytics systems. Notably, Isenberg [16] pro-posed design guidelines for designing an efficient collaborative environment. Robinson [15] also provided design guidelines for collaborative synthesis supporting visual ana-lytics tools. Although most of these studies are designed to understand users’ analytical processes, they focus on single co-located environments. However, in our study, we observed that a collaborative environment imposed several limitations on the users’ ana-lytical processes (see Section 5 for details). These results guided us to think differently about creating and supporting a continuous analytical process, namely by combining both a single-user desktop environment and a collaborative environment into a complete, integrated system.
both environments, it is mainly designed for table-top collaborations and does not allow analysts to migrate their findings between collaborative and single-user contexts. Additionally, Forlines and Lilien [18] converted a single-user, single-display molecular visualization into a collaborative multi-display system. Each display is intended for the group as a whole, and there seems to be no consideration or ability for a user to break away from the collaborative environment, perform individual analysis within an isolated workspace, and then return to the collaborative environment to share their results. They provide a separate tablet PC that is used to make more accurate selections than is pos-sible on their touch table. Although they do speculate that each user could have their own tablet, these personal interfaces serve only for making selections in the collaborative space, not conducting individual analyses.
Likewise, a very closely related system for conducting geospatial analysis utilizes tablet PCs to allow users to issue commands to the collaborative environment [19]. Interestingly, they theorize that their single shared display might discourage individuals from explor-ing, while providing individuals their own personal interfaces might make them more comfortable exploring their own ideas in private before sharing them with collaborators. Indeed, our work builds on this speculation, examines the issues involved, and provides a mature implementation that supports and encourages this behavior. Overall, to the best of our knowledge, there is no visual analytics tool has been mainly designed to support both single and collaborative environments. Most visual analytics tools are designed to work in a single desktop environment. Therefore, they need to be modified or rebuilt to make them work in a collaborative environment. Since modifying or rebuilding existing visual analytics tools requires additional time and efforts, web-based technology is com-monly adopted to build collaborative visual analytics spaces [12]. In this paper, we explain how our visual analytics tools (iPCA and iPCA-CE) are designed to support both envi-ronments with emphasizing some technical considerations how to overcome technical limitations of supporting the environments (see Section 4.4).
3 Users’ analytical processes
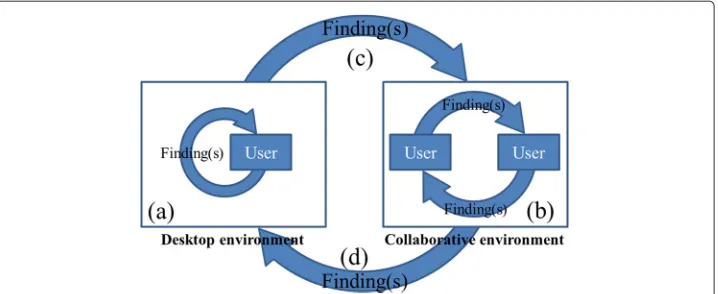
Based on understanding existing literature of collaborative environments, we suggest that users’ analyses should not be isolated in one environment (i.e. desktop or collaborative environments). An individual user performs a data analysis and compiles a list of findings in a desktop environment. When enough interesting results are found, the user meets with other analysts in a collaborative environment to discuss and share these findings. After sharing findings with each other, the users then work together interactively to per-form a collaborative group analysis. Afterwards, the users then take the findings from the collaborative analysis back into a single-user setting for individual analysis and validation. This process then continuously repeats.
Figure 1 An illustration of users’ processes of solving complex analytical problems and sharing analysis results (findings).It shows four users’ processes including(a)asynchronous self-sharing in a desktop environment,(b)synchronous sharing in a collaborative environment, and(c, d)asynchronous transitional sharing processes between environments.
environment, while processes (c) and (d) form a global loop through which the entire analysis process iterates over time. By providing support for all four sharing processes, we form an integrated visual analytics system which reflects the analytical processes carried out by real-world experts.
The illustration of users’ processes of solving complex problems and sharing analy-sis results (findings) has been presented as a poster [7] at the visualization conference (VisWeek 2010). Visualization experts’ opinions were positive to our idea of preserving users’ continuously analysis process in different environments instead of isolating them in one environment. Some of them commented that providing two visual analytics tools is good for performing collaborative and single-user analytical processes, especially when solving difficult analytical problems.
4 System overview
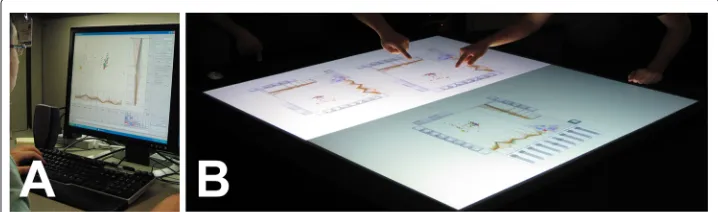
Although supporting collaboration when solving real-world analytical tasks is important, most visual analytics tools have been designed as single-user desktop systems [7,20]. Since we believe that user-friendly visualizations in a collaborative environment enable users to find results more accurately, we chose to extend a known and useful application to work in a collaborative touch-table environment. Multi-touch surfaces support a rich set of inter-actions that allow multiple users to work together to solve complex analytical problems interactively. We selected the Interactive Principal Component Analysis (iPCA) applica-tion, which has been shown to be an effective and easy to use desktop visualization for analysing data sets and interactively exploring the parameters of principal component analysis [6]. Figure 2 shows a system overview showing iPCA and iPCA-CE with an analy-sis of the Glass dataset, which is a publicly available scientific result from the UCI Machine Learning Repository [21].
Figure 2 A system overview showing (A) iPCA and (B) iPCA-CE, both with the Glass dataset.Four views (1∼4) and a set of sliderbars (5) are shown in both applications. Buttons and menus (6) in iPCA were converted to several touchable buttons (6 and 7). In iPCA-CE, the sliderbars can be expanded and collapsed by pressing the toggle button (8), and tab buttons (9) were added to access users’ findings and annotations. Both applications support manipulating and changing the scale of the projected data items.
applications support similar user interaction techniques (selection, manipulation, zoom-ing, etc.) to perform interactive data analysis [6]. Therefore, the users can perform a smooth transition with their findings from one environment to another.
4.1 Principal component analysis
Principle Component Analysis (PCA) is a mathematical procedure widely used for high dimensional data analysis. PCA is a powerful tool capable of reducing dimensions and revealing relationships among data items. It has been viewed as a “black box” approach that is difficult to grasp for many of its users because the coordinate transformation from original data space into eigenspace makes it difficult for the user to interpret the under-lying relation [22]. PCA projects a dataset to a new coordinate system by determining the eigenvectors and eigenvalues of the dataset. It involves a calculation of a covariance matrix of the dataset to minimize the redundancy and maximize the variance. With the covariance matrix, the eigenvectors and eigenvalues are calculated. The eigenvectors are unit eigenvectors (lengths are 1). Once the eigenvectors and the eigenvalues are calcu-lated, the eigenvalues are sorted in descending order. This gives us the components in order of significance. The eigenvector with the highest eigenvalue is the most dominant
principle component of the dataset (PC1). A detailed explanation about PCA can be found in [22,23].
4.2 iPCA
iPCA (Figure 2A) is designed (1) to help the user understand the complicated black-box operation of principal component analysis [22] and (2) to allow the user to analyse complex data sets interactively [6]. Specifically, it focuses on assisting the user in bet-ter understanding and utilizing PCA for analysis by visualizing the results of principal component analysis using multiple coordinated views and a rich set of user interactions. The application is designed primary for use on a standard desktop computer. Since our primary goal of this study is to design a collaborative visual analytics system to sup-port a continuous analysis process, the system has been upgraded to supsup-port annotation techniques (see Section 5 for detail).
The application consists of four views: Projection view (Figure 2A-1), Eigenvector view (Figure 2A-2), Data view (Figure 2A-3), and Correlation view (Figure 2A-4). In the Projection view, all data items are projected based on the first and second principal components by default. The Eigenvector view displays the calculated eigenvectors and eigenvalues in a vertically projected parallel coordinate view. The distances between the eigenvectors in the parallel coordinate view vary based on their eigenvalues, separating the eigenvectors based on their mathematical weights. The Data view shows the original data points in parallel coordinates. The Correlation view represents Pearson-correlation coefficients and relationships between variables as a matrix of scatter plots and values. Pearson-correlation coefficient provides a value between +1 and -1 by measuring the lin-ear correlation between two variables. If the value is close to 1, the two variables maintain a positive correlation. Otherwise (close to -1), the two variables preserve a negative cor-relation. All views are closely connected, such that if the user changes the elements in one view, its corresponding results are updated in other views (brushing & linking). This interactivity allows the user to infer relationships between the coordinated spaces (see the paper [6] for details).
4.3 iPCA-CE
iPCA-CE (Figure 2B) is an extension of iPCA designed specifically for use in a collabo-rative touch-table environment [24]. Each workspace in iPCA-CE displays the same four views as iPCA. However, the system provides the capability to create multiple workspaces within the application, each of which can be used independently. We deployed iPCA-CE on a multi-touch display system designed by the Renaissance Computing Institute (RENCI) (http://www.renci.org). It provides a 46 ×42 work surface using two high resolution projection displays.
To support users managing and sharing their findings, annotation techniques are added to both applications. A detailed explanation about these annotation techniques is included in Section 5.
4.4 Technical challenges
Creating a collaborative tabletop visual analytics system based on a single-user desktop counterpart is not without technical challenges. These challenges involved with the tran-sitioning of a single-user, single-touch system to a multi-user, multi-touch environment include performance limitations, differences in rendering mechanisms, and differences in user input modalities. Here, we present the most significant challenges in detail and describe our solutions for overcoming them.
4.4.1 Performance
With a few exceptions, multi-threaded operation is not usually required for desktop-based visual analytics applications since all interactions are desktop-based on single mouse input. However, in a collaborative environment, multiple processes and threads are necessary to manage the display and listen for incoming touch events. By utilizing a multi-process and multi-threaded architecture, iPCA-CE becomes significantly more complex than iPCA. However, this architecture allows the application to take advantage of a multi-core CPU to support non-interrupted real-time interactivity for multiple users.
In the development of the collaborative system, it is important to use two concurrent processes, one of which utilizes individual threads. The multi-touch engine runs in its own process, which detects finger touches on the table and sends input event messages to the client application via TCP/IP. In the iPCA-CE process, the input thread receives messages from the multi-touch engine and adds them to a queue. The content of each of these messages is relatively simple, but describes the position of a user’s touch, as well as the state of the touch (finger-down, finger-drag, etc.). A separate thread then processes the queue to determine its relevance to updating the iPCA-CE interface. For instance, multiple (false) touches will be condensed into one single touch by this thread to reduce unnecessary computation. Finally, the rendering thread receives update requests based on the processed queue. It then renders the visual interface and, if necessary, performs principal component analysis on the underlying data.
4.4.2 Rendering mechanisms
The rendering mechanism for iPCA-CE differs significantly from the desktop version since iPCA-CE needs to support multiple interfaces for multiple users. While iPCA uti-lizes a single OpenGL context, iPCA-CE needs to create multiple “virtual” contexts, one for each of the interfaces. The general architecture of the iPCA-CE interface is based on the Pad++ metaphor [25], in which each interface is called a “portal”.
rotates or resizes a portal, each geometry will update its global coordinates to reflect the change.
This low-level change to the rendering mechanism affects the implementation of several features in iPCA-CE. For instance, a screen capture of a user’s hand-drawn annotations can no longer be accomplished by copying a rectangular frame buffer because the portal might not be axis-aligned. The operation now requires two steps, one to render the portal in an axis-aligned manner using an additional back buffer, and the second operation to capture the image.
4.4.3 Input modalities
In traditional mouse-based interaction, the user can move a mouse over a visual ele-ment to highlight the eleele-ment (such as to display its label) without the use of the mouse buttons. In a multi-touch environment that utilizes infrared refraction and reflection to detect a user’s touch, there is no way to discern the difference between mouse-over and mouse-drag (holding down a mouse button and moving the mouse) because both operations require the user’s finger to be touching the surface of the table .
One method for overcoming this inherent difference is to use a multitude of gestures to describe each possible operation. However, given the number of features in iPCA-CE, creating a gesture for each feature will inevitably confuse the user and steepen the learning curve, thereby lowering the usability of the system. We therefore take a “low-tech” approach by creating buttons along the borders of each portal (see Figure 2B). The majority of the features in iPCA-CE can be performed by activating or toggling these buttons. However, for the user’s convenience, a few popular gestures that have been widely adopted by multi-touch devices (such as the iPhone) have been incorpo-rated into the iPCA-CE interface. These gestures include resizing, zooming, and rotation by using two fingers simultaneously. During our user study, we observed that these ges-tures were intuitive for participants and did not introduce usability concerns during their analyses.
4.5 Integration
Together, iPCA and iPCA-CE form an integrated toolset which allows analysts to switch back and forth between the two visualizations on separate hardware without losing track of their current analysis tasks. While single-user analysis could technically be performed on the touch-table using the collaborative application, this might not be as effective and productive as using the standalone desktop application. Since experts often pre-fer to work alone and switch their analysis process into a collaborative group activity only when necessary [3], it is important to provide both applications, using hardware appropriate for the type of interaction required by each. Since iPCA and iPCA-CE appli-cations support a continuous analysis process that permits analysts to switch back and forth between desktop and collaborative environments, users can export findings and system parameters back and forth between applications, allowing them to transition from single-user to collaborative contexts without losing track of their current analytical process.
5 Sharing analytical processes
In a collaborative environment, it is easier to share findings and communicate ideas than on a single-user desktop computer, but it may be more difficult to perform individual analyses due to interference [26]. Consequently, analysts may continuously switch back and forth between desktop and collaborative workflows (see Figure 1(c-d)). Based on this model, we improved the iPCA and iPCA-CE applications to support this continuous anal-ysis process. We suggest that providing support for managing and sharing findings is as important as providing useful analysis tools because the users’ end goal is to discover evidence that supports their hypotheses.
5.1 Managing findings
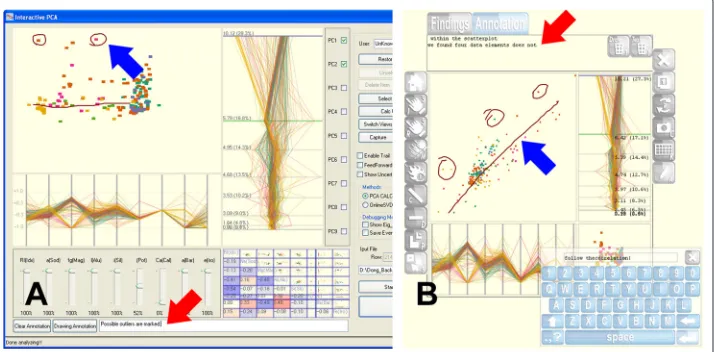
A finding from visual analysis procedures may be represented as a screenshot, which shows what was found during the analysis, and may include an annotation, which explains in more detail what the screenshot represents. In iPCA and iPCA-CE, both screenshots and annotations are used to manage users’ findings. The applications provide two meth-ods for providing annotations: text and drawing. Text-annotation is an indirect approach for explaining the details of a user’s finding. Drawing-annotation allows users to directly indicate important elements or features visually on-screen. In iPCA, both methods of annotation are performed using a keyboard and mouse. However, in iPCA-CE, annota-tions needed to be supported differently because all interacannota-tions are initiated by finger touches. Therefore, a virtual keyboard is displayed for text-annotation, and a drawing tool is used for drawing-annotation. Figure 4 shows examples in which users utilize these annotation tools to indicate their findings in iPCA and iPCA-CE.
Findings are stored in an XML format (see Figure 5) similar to the P-Set model [27]. However, since our design philosophy does not require us to track all of a user’s explo-ration procedures, we simply describe each finding with parameter sets. The parameter sets are similar to the sets defined in the P-Set model, though defined specifically for our visual analytics system. Sets represent interactive operations (such as selection and deletion), view, sliderbar control, text- and drawing-annotations, and a final result. Since
Figure 5 An example of (A) an analytical finding defined in an XML format and (B) a screenshot of the final result.A user has selected eight possible outliers during the analysis, which are highlighted in the screenshot.
users’ findings can easily be recreated with the parameter sets, it is an important and use-ful feature for sharing findings with others. Each finding is identified by the user’s name and a timestamp.
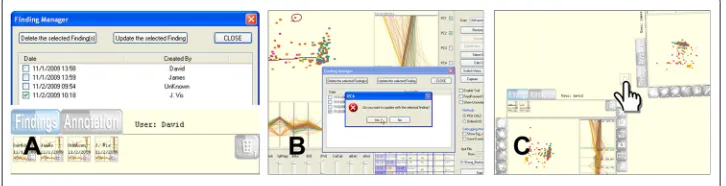
Figure 6 shows how findings are managed. In iPCA, all findings are listed chronologically in a separate window, and the user is provided with buttons for updating or deleting findings in the list (see top of Figure 6A). A finding is created using the cur-rent view and annotations and added to the list by selecting a button in the main window. In iPCA-CE, however, the differences in display and interaction require that findings be managed differently than the desktop applications. Findings are managed within a tabbed window activated by a button above each workspace (see bottom of Figure 6A). Each finding is represented as a screenshot thumbnail identified with the user’s name and timestamp. Findings are created by touching a capture button in the workspace, and find-ings can be moved into the workspace for updating via a simple drag-and-drop operation. Since multiple users can use iPCA-CE simultaneously, each user has their own storage space (i.e. directory or folder) to manage findings.
5.2 Sharing findings
Asynchronous self-sharing occurs in most single user desktop applications (see Figure 1a). In iPCA, the user can continuously create findings and track the history of their analysis by viewing the previously created findings (see Figure 6B). Previously saved findings can
Figure 6 Interacting with findings.(A)Management of findings in iPCA (top) and iPCA-CE (bottom). Findings are displayed chronologically and are identified by a timestamp and the creator’s name.(B)
be displayed, allowing the user to track the history of the analysis and continuously update previous findings based on recent results.
Transitional sharing from the desktop application to the collaborative environment rep-resents the process by which the results from a single user’s analysis are made public for the rest of the group (see Figure 1c). If the user wants to take their findings from iPCA into a collaborative setting, the XML file can be transmitted over the network and imported into iPCA-CE.
Synchronous sharing in the collaborative environment provides users with the capa-bility of viewing others’ findings to gain the understanding of collaborators’ analytical processes (see Figure 1b). This type of sharing allows users to work together simultane-ously to find new analytical results. This is analogous to traditional procedures for sharing analysis results, such as preparing presentation slides or written reports to present and discuss in a group meeting. This is accomplished in iPCA-CE by dragging findings directly from one workspace to another (see Figure 6C). Using this direct passing operation, collaborators can easily become aware of each other’s analytical processes and results, although they each still maintain an individual workspace for performing their analyses. Since this sharing operation should be subject to the agreement of the collaborator, a con-firmation window is displayed to ask for permission to accept the finding being shared by another.
Transitional sharing from the collaborative environment back to the desktop appli-cation (see Figure 1d) has not been considered in many previous collaborative visual analytics systems. However, we believe this is an important method for users to further investigate interesting results that were shared during the collaborative session. Thus, it is also possible to export the findings of collaborative analysis from iPCA-CE as an XML file for transmission over the network to iPCA. To understand the sharing processes, we per-formed user studies in two different environments. In following sections, we described how we performed the studies and what we found.
6 Understanding users’ analytical processes in a single-desktop environment
Although it has been found that the initial version of iPCA is superior to SAS/INSIGHT for solving analytical questions [6] from the within-subjects user study, the effectiveness of the updated version of iPCA for solving analytical tasks, and creating and sharing find-ings in single-desktop environments has not been clearly determined. To understand the users’ analytical processes as well as the effectiveness of capturing and sharing findings with iPCA, we performed a user study. In the study, we asked participants to capture their findings with utilizing text- and drawing-annotations. This study was conducted under the approval (protocol number: 325298-1) by the institutional review board (IRB) at the University of the District of Columbia.
6.1 Study design and procedure
About 10 participants joined to the study (eight male and two female). Four participants were undergraduate students, five were graduate students, and one was a faculty. Each participant was asked to solve the five task questions, which were:
• Find a dimension that most and least affects the PCA outputs in the Projection View using the first and second principle components.
• Find two dimensions that maintain a highly positive and negative correlation. • How does removing the first dimension affect the PCA results using the first and
second principle components? List as many observations as possible.
The order of the questions was counter-balanced to avoid learning effect. Prior to beginning the task questions, participants were given a tutorial how to use the system. In addition, a plenty of time was given to make them feel comfortable about using the application. For the tutorial session, the Iris dataset [21] (150 data items×4 dimensions) was used. All participants were allowed to solve each task question in maximum five minutes. For the task questions, the Wine dataset (179 data items×13 dimensions) was used. They were requested to find and record evidence using both the text and drawing annotation methods supported by the application. During the study, all participants’ time-stamped interactions were captured by built-in functions of the system and saved automatically into log files.
Overall task completion time and their findings were evaluated by analysing the recorded interaction logs and the captured findings. After solving each task question, a post-task questionnaire was given for tracking their personal opinions about the task and the tool for solving the task. At the end of the study, their personal factors of ease of use and usefulness of the system were asked using a 5-point Likert scale, with higher num-bers corresponding to more positive ratings. In addition, they were asked to provide their personal qualitative feedback about the application.
6.2 Study results
Although half of the participants are new to visualization, approximately 72% of the par-ticipants answered correctly. About 78% of the parpar-ticipants mentioned that iPCA was very or somewhat useful for solving the all task questions. From the study, we noticed that most participants spent relatively large amount of time by trying to find correct answers through interaction with dimensions (specifically for the task 3 and 4).
After the evaluation, post-evaluation questionnaire was given as,
• Does iPCA help you understand the dataset better?
• Do the 4 views (Projection, Eigenvector, Data, and Correction view) allow you to perform a better analysis on the dataset?
• Is the manipulation (by using the Dimension Slider and the Control options) useful for understanding the dataset and solving the task questions?
• Would the ability to interactively alter the data help you explore what-if scenarios? • Overall, how well do you understand PCA? (why? and why not?)
Figure 7 Post-evaluation results.Most participants answered positively to all post-evaluation questions. For the question 5, three participants pointed out that they did not fully understand PCA because of time limitation.
solving analytical questions, most participants answered positively. Seven participants (M=4.2,SD=0.92) answered iPCA was “very easy” and “easy” to use and eight partic-ipants (M= 4.5,SD= 0.85) mentioned iPCA was “very useful” and “useful” for solving the given analytical task questions.
6.3 Discussion
Since interaction is somewhat related to users’ reasoning [29], we can assume that our participants’ performance in using iPCA is attributed solely to the interface design and the set of interactions. We believe that interaction plays a significant role in solving analytical task questions by understanding PCA deeply. Unfortunately, we are not able to isolate the specific factor(s) that plays a major role in determining the participants’ performance due to the multiple coordinated views, the interactions, or others. We simply believe that the interactions play a significant role in that the user’ direct and continuous manipulation with PCA is rewarded with immediate visual feedback.
We found that the single desktop application (i.e. iPCA) is good for understanding data, identifying anomalies, and sharing their findings. By analysing log files, we found that most participants tend to create findings and track the history of their analysis by check-ing the previously created findcheck-ings. They created about three±two findings on average when completing each given task. Participants commented that the supported annota-tion techniques in iPCA are useful and efficient to manage and share their findings. However, we found that they prefer not to share findings since iPCA does not support a direct sharing mechanism over the network. From this study, we found that single desk-top environments have advantages for providing private working environments that help users concentrate on solving analytical problem themselves without getting interrupted by other people. However, this approach includes a limitation as:
• It is difficult to work together collaboratively with others in single desktop environments because of limited shared space.
7 Understanding users’ analytical processes in a collaborative environment
numerous studies on collaborative visualization have been performed. However, a limited number of studies have been performed to find limitations in a collaborative environ-ment, such as our multi-touch table, especially when solving analytical problems. Based on our understanding of user behaviors when solving complex analytical problems, along with the results of studies of real-world analysts [2,3], we performed an additional user study with the collaborative iPCA-CE application in single, double, and multiple workspaces. This study was conducted under the approval (protocol number: 09-11-04) by the institutional review board (IRB) at the University of North Carolina at Charlotte.
7.1 Study design
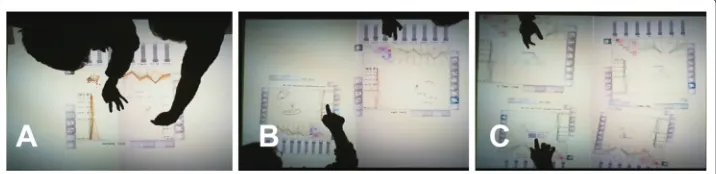
A total of 12 graduate students participated in the study (nine male, three female). Eight participants had limited experience using a multi-touch table, and four of them had no experience. The experiment required two participants to work together to solve a given task. The study used a within-subjects design with three conditions, corresponding to the number of available workspaces (see Figure 8):
• Single: The two participants shared a single workspace. • Double: Each participant had their own personal workspace.
• Multiple: Participants were allowed to create as many workspaces as they desired.
The order of the conditions was counterbalanced across the study to eliminate ordering effects.
7.2 Study procedure
Prior to beginning each condition, participants were given a tutorial about the tool they were about to use which instructed them on basic functionalities. Similar to the study in desktop environments, the Iris dataset was used for the tutorial session. Participants were given sufficient time to familiarize themselves with the task and user interface. For each condition, participants were asked to find the most striking outlier(s) in one of the follow-ing datasets: the E.Coli dataset (336 data items×7 dimensions), the Forest Fire dataset (517 data items×11 dimensions) and the Glass dataset (214 data items×9 dimensions). They were instructed to have a discussion with their partner to justify their findings, and were requested to find and record evidence using both the text and drawing annotation methods provided by the application. Participation in the study took approximately one hour.
Figure 8 These pictures show people performing multiple collaborative data analyses in iPCA-CE.
During the study, all interactions on the multi-touch table were recorded internally using screen capture software. In addition, participants’ interactions were video captured using a high-definition camera facing down from the ceiling and their verbal communica-tions were audio recorded. Additionally, all participants’ time-stamped interaccommunica-tions were captured by built-in functions of the system and saved automatically into log files. Based on the interaction logs and recordings, we calculated the following task performance measures from their analysis: (1) overall task completion time, (2) verbal communication time spent discussing or justifying findings, and (3) number of findings discovered. After each condition, participants completed a post-condition questionnaire in which they were asked to report the condition’s ease of use and intuitiveness. They were also asked to rate how well they were able to understand the data and how well they were able to commu-nicate with their partner. All ratings were on a 5-point Likert scale, with higher numbers corresponding to more positive ratings. At the end of the study, participants were asked to specify their preferred condition for solving problems and indicate which condition they felt best facilitated communication and sharing ideas with others. They were also asked to provide qualitative feedback describing the advantages and disadvantages of each condition.
7.3 Study results
7.3.1 Task performance
Each of the task performance measures was treated with a repeated measures ANOVA testing the within-subjects effect of workspace condition. The analysis for task comple-tion time (M = 531.57sec.,SD = 254.76) was not significant,p = .19. Time spent in verbal communication (M= 211.64sec.,SD= 182.82) was also not significant,p= .72. The analysis for the number of findings discovered was significant,F(2, 10)=15.67,p< .01,μ2p = .76. We conducted post-hoc analysis using paired-sample t-tests with a Bon-ferroni corrected significance value ofα=0.17 to reduce error in multiple comparisons. Participants using a single workspace (M = 2.33,SD = 1.03) discovered fewer find-ings than those using a double workspace (M = 5.83,SD = 2.32),p < .01, or multiple workspaces (M = 5.17,SD = 2.14), p < .01. The double workspace and multiple workspace conditions were not significantly different, p = .42. Figure 9(A-B) shows the results for the task performance measures. These results indicate that in a collaborative system, providing each user with their own personal workspace (or multiple workspaces) allows them to better perform an analysis task, although the task completion time and time spent communicating were not affected.
7.3.2 Post-condition ratings
Figure 9 Results broken down by conditions.(A)Average completion time and verbal communication time and(B)the number of findings across workspace conditions. Distribution of participant ratings for(C)ease of use and intuitiveness and(D)abilities to understand data and communicate ideas with a partner.
This is because this participant had contradictory ideas about the analysis procedure as compared to his/her partner. We will discuss this in more detail later (see Section 7.4).
7.3.3 Preferences and qualitative feedback
With regards to overall preferences for solving problems, four participants preferred dou-ble workspaces, and eight participants preferred multiple workspaces. No participants indicated a preference for the single workspace condition. These preferences are consis-tent with our results indicating that they were able to discover fewer findings when using a single workspace. However, when asked which condition they preferred for communi-cating and sharing ideas, half of the participants preferred a single workspace, with the remaining six split evenly between the multiple and double workspace conditions. This indicates that a single shared workspace may be effective for communicating findings since users are looking at the same visual representation of the data. When review-ing participants’ qualitative feedback, we found that most participants pointed out that the multi-touch table interactions were helpful in understanding the data. However, the overall feedback we received for this collaborative visual analytics application was very positive.
7.4 Discussion
we also noticed that when partners had different ideas of how to solve a problem, collaborating in a shared workspace became difficult.
Overall, four participants mentioned that although a collaborative environment is use-ful to share ideas and findings, it is difficult to perform visual analysis simultaneously. For example, in the double and multiple workspace conditions (see Figure 8B and 8C), one participant pointed out that he felt like he was racing his partner to discover more findings. Participants suggested that they would also like to have an isolated workspace (such as a desktop environment) for solving analytical problems. Additionally, though all recruited participants were healthy and of average fitness, most participants mentioned that standing in front of the multi-touch table for long periods of time was difficult due to fatigue.
From this study, we found that collaborative environments have advantages for solving analytical problems, especially when sharing ideas and findings. However, this approach has several limitations, such as:
• It is difficult to collaborate in a shared workspace when users’ ideas conflict. • Interference between collaborators may cause difficulty in forming new ideas or
strategies.
• Users become fatigued when standing at a multi-touch table for long periods of time.
In light of both the advantages and limitations of collaborative environments, we sug-gest that users’ analyses should not be isolated in one environment. As shown in Section 3, the developed informal model for the general analytical process should be supported and maintained to allow analysts to switch back and forth between single-user and collabora-tive workflows. An individual user performs a data analysis and compiles a list of findings in a desktop environment. When enough interesting results are found, the user meets with other analysts in a collaborative environment to discuss and share these findings. After sharing findings with each other, the users then work together interactively to per-form a collaborative group analysis. Afterwards, the users then take the findings from the collaborative analysis back into a single-user setting for individual analysis and validation. This process then continuously repeats.
iPCA and iPCA-CE applications support a continuous analysis process that permits analysts to switch back and forth between desktop and collaborative environments. Users can export findings and system parameters back and forth between applications, allowing them to transition from single-user to collaborative contexts without losing track of their current analytical process. As shown in Figure 1, we defined that sharing findings between the two different environments is performed as asynchronous transitional sharing pro-cesses. However, synchronous sharing between the two environments can be supported depending on how applications are designed. In such case, it is important to support iso-lating users if they want to work themselves. The two applications are available publicly online at the URL http://www.knowledgeviz.com/iPCA/.
8 Conclusion and future work
analytical problems. However, on their own, neither of these two modalities entirely reflects the continuous analytic processes carried out by real world experts. In this paper, we presented an integrated visual analytics toolset composed of a single-user desktop application and a collaborative touch-table system. Based on the consideration of sharing findings, we presented an informal model for the general analytical process that occurs as analysts switch back and forth between single-user and collaborative environments. By following this model, both the desktop and collaborative applications support this continuous analysis process.
Since the exact processes for sharing ideas and analysis findings is still unclear, there is much work to be done in understanding the knowledge sharing process in collaborative environments. In the future, it will be necessary to perform an expert evaluation of shar-ing analysis results between the sshar-ingle-user and collaborative environments. These results will provide guidelines for designing visual analytics systems that accurately reflect the analytical processes carried out by real-world experts.
Competing interests
The authors declare that they have no competing interests.
Authors’ contributions
DJ carried out the implementation of the system and usability studies and drafted the manuscript. SJ participated in the first usability study and performed the statistical analysis of the study result. ES and BY participated in analyzing the study results and helped to draft the manuscript. RC conceived of the study, and participated in it design and coordinating. All authors read and approved the final manuscript.
Acknowledgements
This work was partially supported by US Army Research Office (ARO) grant W911NF-13-1-0143.
Author details
1Department of Computer Science and Information Technology, University of the District of Columbia, 4200 Connecticut
Avenue NW, 20008 Washington, DC, USA.2Department of Computer Science, Bowie State University, 14000 Jericho Park Rd., 20715 Bowie, MD, USA.3Institute for Creative Technologies, University of Southern California, 12015 Waterfront Drive, 90094 Playa Vista, CA, USA.4Department of Computer Science, Tufts University, 419 Boston Ave, 02155 Medford, MA, USA.
Received: 11 November 2014 Accepted: 29 January 2015
References
1. Pike WA, Stasko J, Chang R., O’Connell TA (2009) The science of interaction. Inf Visualization 8(4):263–274. doi:10.1057/ivs.2009.22
2. Chin G. Jr., Kuchar OA, Wolf KE (2009) Exploring the analytical processes of intelligence analysts. In: Proceedings of the SIGCHI Conference on Human Factors in Computing Systems. CHI ’09. ACM, New York, NY, USA. pp 11–20. doi:10.1145/1518701.1518704
3. Fink GA, North CL, Endert A, Rose S (2009) Visualizing cyber security: usable workspaces. In: Visualization for Cyber Security, 2009. VizSec 2009. 6th International Workshop On. IEEE. pp 45–56. doi:10.1109/VIZSEC.2009.5375542 4. Carlbom I, Hsu WM, Klinker G., Szeliski R, Waters K, Doyle M, Gettys J, Harris KM, Levergood TM, Palmer R, Palmer L,
Picart M, Terzopoulos D, Tonnesen D, Vannier M, Wallace G (1992) Modeling and analysis of empirical data in collaborative environments. Commun ACM 35(6):74–84. doi:10.1145/129888.129893
5. Ekanayake J, Pallickara S, Fox G (2008) A collaborative framework for scientific data analysis and visualization. In: Collaborative Technologies and Systems, 2008. CTS 2008. International Symposium On. IEEE. pp 339–346. doi:10.1109/CTS.2008.4543948
6. Jeong DH, Ziemkiewicz C, Fisher BD, Ribarsky W, Chang R (2009) ipca: An interactive system for pca-based visual analytics. Comput Graph Forum 28(3):767–774
7. Jeong DH, Suma EA, Butkiewicz T, Ribarsky W, Chang R (2010) A continuous analysis process between desktop and collaborative visual analytics environments. In: IEEE Visual Analytics Science and Technology. IEEE. pp 231–232 8. Coleman J, Goettsch A, Savchenko A, Kollmann H, Kui W, Klement E, Bono P (1996) Teleinvivotm: towards
collaborative volume visualization environments. Comput Graphics 20(6):801–811
9. Grimstead IJ, Walker DW, Avis NJ (2005) Collaborative visualization: a review and taxonomy. In: Proceedings of the 9th IEEE International Symposium on Distributed Simulation and Real-Time Applications. DS-RT ’05. IEEE Computer Society, Washington, DC, USA. pp 61–69. doi:10.1109/DISTRA.2005.12. http://dx.doi.org/10.1109/DISTRA.2005.12 10. Marchese FT, Brajkovska N (2007) Fostering asynchronous collaborative visualization. In: Proceedings of the 11th
11. Mark G, Kobsa A (2005) The effects of collaboration and system transparency on cive usage: An empirical study and model. Presence 14(1):60–80
12. Ma K-L (2007) Creating a collaborative space to share data, visualization, and knowledge. SIGGRAPH Comput Graph 41(4):4–144. doi:10.1145/1331098.1331105
13. Heer J, Agrawala M (2008) Design considerations for collaborative visual analytics. Inf Visualization J 7:49–62 14. Johnson G (1998) Collaborative visualization 101. ACM SIGGRAPH - Comput Graphics 32(2):8–11
15. Robinson AC (2008) Collaborative synthesis of visual analytic results. In: Visual Analytics Science and Technology, 2008. VAST ’08. IEEE Symposium On. IEEE. pp 67–74. doi:10.1109/VAST.2008.4677358
16. Isenberg P (2009) Collaborative information visualization in co-located environments. PhD thesis, University of Calgary, Calgary, Canada
17. Wigdor D, Jiang H, Forlines C, Borkin M, Shen C (2009) Wespace: The design development and deployment of a walk-up and share multi-surface visual collaboration system. In: Proceedings of the SIGCHI Conference on Human Factors in Computing Systems, CHI ’09. ACM, New York, NY, USA. pp 1237–1246. doi:10.1145/1518701.1518886 18. Forlines C, Lilien R (2008) Adapting a single-user, single-display molecular visualization application for use in a
multi-user, multi-display environment. In: Proceedings of the Working Conference on Advanced Visual Interfaces, AVI ’08. ACM, New York, NY, USA. pp 367–371. doi:10.1145/1385569.1385635
19. Forlines C, Esenther A, Shen C, Wigdor D, Ryall K (2006) Multi-user, multi-display interaction with a single-user, single-display geospatial application. In: Proceedings of the 19th Annual ACM Symposium on User Interface Software and Technology, UIST ’06. ACM, New York, NY, USA. pp 273–276. doi:10.1145/1166253.1166296 20. Mahyar N (2014) Supporting sensemaking during collocated collaborative visual analytics. PhD thesis, University of
Victoria
21. Bache K, Lichman M (2013) UCI Machine Learning Repository. http://archive.ics.uci.edu/ml
22. Jolliffe IT (2002) Principal component analysis. 2nd edn.. Springer Verlag, New York. doi:10.1007/b98835 (http://www.springer.com/us/book/9780387954424)
23. Jeong DH, Ziemkiewicz C, Ribarsky W, Chang R (2009) Understanding principal component analysis using a visual analytics tool. In: Technical Report, Charlotte, Charlotte Visualization Center at UNC Charlotte, USA
24. Jeong DH, Ribarsky W, Chang R (2009) Designing a PCA-based collaborative visual analytics system. IEEE Visualization Workshop on Collaborative Visualization on Interactive Surfaces (CoVIS) 09, pp. 24-27
25. Bederson BB, Hollan JD (1994) Pad++: a zooming graphical interface for exploring alternate interface physics. In: Proceedings of the 7th Annual ACM Symposium on User Interface Software and Technology, UIST ’94. ACM, New York, NY, USA. pp 17–26. doi:10.1145/192426.192435
26. Tse E, Histon J, Scott SD, Greenberg S (2004) Avoiding interference: how people use spatial separation and partitioning in sdg workspaces. In: Proceedings of the 2004 ACM Conference on Computer Supported Cooperative Work, CSCW ’04. ACM, New York, NY, USA. pp 252–261. doi:10.1145/1031607.1031647
27. Jankun-Kelly TJ, Ma K-L, Gertz M (2007) A model and framework for visualization exploration. IEEE Trans Vis Comput Graph 13(2):357–369
28. Shneiderman B, Plaisant C (2006) Strategies for evaluating information visualization tools: Multi-dimensional in-depth long-term case studies. In: Proceedings of the 2006 AVI Workshop on BEyond Time and Errors: Novel Evaluation Methods for Information Visualization, BELIV ’06. ACM, New York, NY, USA. pp 1–7. doi:10.1145/1168149.1168158 29. Dou W, Jeong DH, Stukes F, Ribarsky W, Lipford HR, Chang R (2009) Recovering reasoning processes from user
interactions. IEEE Comput Graph Appl 29(3):52–61. doi:10.1109/MCG.2009.49
Submit your manuscript to a
journal and benefi t from:
7 Convenient online submission 7 Rigorous peer review
7 Immediate publication on acceptance 7 Open access: articles freely available online 7 High visibility within the fi eld
7 Retaining the copyright to your article