R E S E A R C H
Open Access
Characterizing the hyperspecialists in the
context of crowdsourcing software
development
Anderson Bergamini de Neira
1, Igor Steinmacher
2,3*and Igor Scaliante Wiese
2Abstract
Companies around the world use crowdsourcing platforms to complete simple tasks, collect product ideas, and launch advertising campaigns. Recently, crowdsourcing has also been used for software development to run tests, fix small defects, or perform small coding tasks. Among the pillars upholding the crowdsourcing business model are the platform participants, as they are responsible for accomplishing the requested tasks. Since successful crowdsourcing heavily relies on attracting and retaining participants, it is essential to understand how they behave. This exploratory study aims to understand a specific contributor profile: hyperspecialists. We analyzed developers’ participation on challenges in two ways. First, we analyzed the type of challenge that 664 Topcoder platform developers participated in during the first 18 months of their participation. Second, we focused on the profile of users who had more collaborations in the development challenges. After quantitative analysis, we observed that, in general, users who do not stop participating have behavioral traits that indicate hyper-specialization, since they participate in the majority of the same types of challenge. An interesting, though troubling, finding was the high dropout rate on the platform: 66% of participants discontinued their participation during the study period. The results also showed that
hyperspecialization can be observed in terms of technologies required in the development challenges. We found that 60% of the 2,086 developers analyzed participated in at least 75% of challenges that required the same technology. We found hyperspecialists and non-specialists significantly differ in behavior and characteristics, including
hyperspecialists’ lower winning rate when compared to non-specialists.
Keywords: Crowdsourcing, Topcoder, Hyperspecialization
Introduction
A new business model is gaining steam in the software development industry and drawing the attention of com-panies [1, 2], developers [3, 4], and researchers [5, 6]. Crowdsourcing for software development benefits from the pool of globally distributed developers to accomplish tasks for companies from all around the world [7]. Crowd-sourcing provides engaged participants with a way to earn money, notoriety, and even professional opportunities [8]. Companies find in crowdsourcing an economical and
*Correspondence:[email protected]
2Departamento de Computação, Universidade Tecnológica Federal do Paraná,
Campo Mourão, PR, Brazil
3School of Informatics, Computing, and Cyber-Systems – Northern Arizona
University, Flagstaff, AZ, USA
Full list of author information is available at the end of the article
reliable way to develop software, relying on the “wisdom of crowds” [9] to accomplish tasks.
To maintain a prosperous and advantageous environ-ment for all those involved in crowdsourcing, a high level of interaction must occur among companies (that need software artifacts), developers (who are able to produce these artifacts), and platforms (that manage the needs) [10]. To create a sustainable environment, the onboard-ing and retention of new developers to these platforms must be ensured. Due to the importance of the develop-ers to the success of the crowdsourcing model, researchdevelop-ers have been discussing characteristics of contributions and the profile of crowdsourcing developers [10,11]. Although the studies found in the literature analyze some charac-teristics about the different ways to contribute [1,8], and there is an increasing number of studies related to crowd-sourcing for software [12], much is still unknown about
the contributor profile and the behavior of developers working in this type of environment.
In 2011, Malone et al. [13] predicted that we would enter the age of hyperspecialization. For these authors, hyper-specializationmeans “breaking work previously done by one person into more specialized pieces done by sev-eral people.” Still, for the authors, participants would fol-low this concept of hyperspecialization, or the in-depth knowledge of some specific subjects, which goes against the current full-stack developers. For example, full-stack developers may have to perform a task in which they are not completely proficient, what may lead to delays and lower quality solutions. On the other hand, with available hyperspecialists, more qualified people can handle these tasks, delivering faster and higher quality results. Devel-opers with this hyperspecialist profile benefit from the growth of crowdsourcing; they make it possible for com-panies to count on a global pool of specialists at a low cost, since it is not always possible to find professionals with specific skills in the region or the high cost can make unfeasible to hire them.
The goal of this work is to characterize the hyper-specialist profile in crowdsourcing software develop-ment environdevelop-ments. The Topcoder platform was chosen as our case study because it is one of the largest crowdsourcing-based software development platforms in the world, with more than one million registered partic-ipants1. It received more than 22,000 assignments and distributed more than 80 million dollars in reward since its founding2. Companies with international reputations use the Topcoder platform such as NASA, IBM, eBay, and Honeywell.
In Topcoder, the companies create the tasks that reflect their development needs, providing details about the problem, deadlines, and reward value. After that, the tasks are made available in the platform and the developers can register to work on them. The registered develop-ers may then work on producing the artifacts, ultimately submitting them to accomplish the task. The artifacts are reviewed following a predefined criteria set, and the results are then published. After the appeal period, the owner of the winning submission is asked to follow up, providing potential changes and revisions on their artifacts. Revising and delivering a new version of the artifacts with the suggested fixes is part of the process of guaranteeing the quality of the deliverable. During the whole process, companies can opt to hire experi-enced members of the platform, theco-pilots. These co-pilots support the interaction between the company and developers, helping developers throughout the task and reviewing and following up the process on behalf of the company.
Based on this, in this study, our goal was to answer the following mainRQ(research question) :
• RQ. How is the hyperspecialization phenomenon observed in the TopCoder platform?
Our study was conducted in two phases. For both phases, we relied on data collected from Topcoder using their public API (application programming interface). In the first phase, we investigated the initial 18 months of 664 developers to verify whether we could identify the hyperspecialist phenomenon in terms of the type of chal-lenges the developers participate in. In Topcoder, the challenges are classified into three different types: devel-opment, design, and data science. We used this classifica-tion to conduct our analysis. Preliminary results indicate that 94% of the users who contributed during the ana-lyzed period continued to contribute to similar challenges, indicating the possible existence of the hyperspecializa-tion menhyperspecializa-tioned by Malone et al. [13]. Another important result was the high dropout rate found: about 66% of the participants participating in at least one challenge on the platform stopped collaborating.
In the second phase, we decided to further explore the phenomenon by focusing on the challenges classified as “development.” We chose this specific type since compa-nies propose these challenges (as opposed to data science, which are proposed by the Topcoder, and mainly related to marathon-like challenges) and give financial rewards. We analyzed all challenges between August 2003 and September 2016 in the “development” category, resulting in a total of 18,659, with the participation of 2086 devel-opers. The obtained data was quantitatively analyzed. The results indicate that 60% of the 2086 developers were specialists (since at least 75% of the challenges they sub-mitted require the same technology). A great majority of the specialists contributed only to challenges requiring the technology in which they specialize. We also found a high correlation between the number of challenges available for technologies and the number of special-ists attracted by the challenges. Therefore, technologies that are required in most part of the tasks at Topcoder, like Java, Javascript, .NET, HTML (HyperText Markup Language), and iOS, also present a high number of spe-cialist participants. Interestingly, we could not identify hyperspecialists for important technologies like MySQL, PostgreSQL, or Docker.
improve the quality of the software artifacts received. Analysis of historical data could also inform decisions on what kind of challenges would inspire contributions by specialists.
The rest of this paper is structured as follows. The “Related work” section presents the related work. In the “Overall research setting” section, we report the high-level description of the research method. In the “Phase 1: A high-level analysis of hyperspecialization” section, we present the details about the phase 1 of this study, includ-ing method and results, while in the “Phase 2: Hyper-specialization in development challenges” section, we present the details about the phase 2. A discussion about our results is presented in the “Discussions” section. “Limitations and threats to validity” section presents the limitations and potential threats to validity, and in the “Conclusion” section, we draw conclusions.
Related work
In many domains, crowdsourcing has become an advan-tageous option for completing tasks that generally require intensive human interaction. In the scope of software development, this phenomenon has also been observed in recent years. Mao et al. [7] affirm that crowdsourcing for software development can be understood as the action of undertaking any task in the field of software engineering outside the company. These demands are made available to a generally large group of people, enabling them to decide on which tasks to work.
For LaToza and van der Hoek [10], platforms that implement crowdsourcing for software development can operate in three distinct ways: peer production, competi-tion, and the micro-task model. In the first approach, the participants collaborate to build a single artifact and, in general, receive no payment for these collaborations. One example of this approach is the open-source model. In the competition model, companies describe their needs in the form of tasks and open a public competition for the best contribution, for which they usually pay the devel-oper. Finally, in the microtasks model, the needs of the client company are broken down into small (micro) tasks that can be completed in minutes. The owner of the con-tribution receives the reward offered by the work, which is later attached to the results of the other tasks completing the company’s demand.
According to Hosseine et al. [14], the success of crowd-sourcing rests on four pillars: the company, the plat-form, thetasks, and theworkers. Despite the importance of workers, many aspects related to the interaction and behavior of users on the platforms are not yet understood. Some recent studies analyze the behavioral traces of developers in crowdsourcing platforms. For example, Gadiraju [15] suggested analyzing and classifying users who breaks the rules of the platform, or who are not
unable to provide good contributions. In a different line, Gray et al. [16] describe cases in which crowdworkers help each other, collaborating to keep the crowd motivated to continue contributing to the platform. Although these papers analyze behavior in crowdsourcing, none of them focuses on better understanding the hyperspecialization phenomena.
The crowdsourcing model leverages community mem-bers’ diversity of experiences and knowledge to attract companies that invest time and money in providing tasks for participants to complete. In order to improve the quality of the submissions received in a task, some authors focus their efforts on creating recommendation approaches to suggest the most appropriate users to par-ticipate on a task [1,4,17]. These approaches use informa-tion such as reward value, required skills, task descripinforma-tion and creation, and closure dates to build member partici-pation profiles which allow the model to recommend the best fit for the tasks.
Despite the importance of recommending the most appropriate people for a task, Karim et al. [4] focused on a way to identify the people who would not win a chal-lenge. Doing this saves time and effort of participants and reviewers, reduces competition, and helps partici-pants to be available to work on tasks that are a better fit for them. When recommending winners, Karim et al. [4] achieved a recall of 94.07%; their goal was to predict a participant who would be among the most well-suited for the task. The authors also showed that using the rec-ommendation in a 30-day period, it would be possible to save about 3.5 days for more experienced members and about 4.6 days for less experienced members. Similar to the aforementioned studies, we leverage data extracted from crowdsourcing platforms, like skills, challenge par-ticipation, number of winning submissions, etc. However, in contrast to the literature, we focus on analyzing one specific profile: the hyperspecialist.
Other studies analyze the contribution profile of soft-ware crowdsourcing participants. For example, Saremi and Yang [8] mention that more experienced members of Topcoder platform are more prone to work on tasks from internationally renowned companies or with high rewards. They point out that more experienced people produce more, increasing their odds to win challenges. Mao et al. [1] report that the most qualified members of Topcoder register as soon as the task is made avail-able, which ultimately inhibits the registration of other top-level competitors.
complement the state-of-the-art, in this paper, we are interested in examining the behavior and characteristics of the so-called hyperspecialists. We believe that this clas-sification can help in improving the existing mechanisms of recommendation, as well as benefit companies and plat-form maintainers who can better understand this specific profile.
Overall research setting
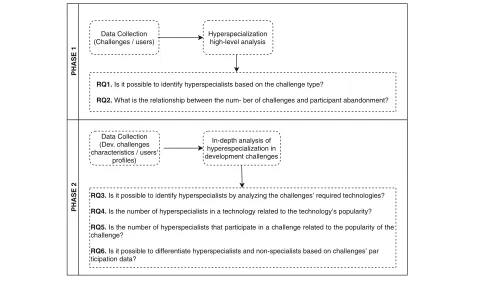
As mentioned in the “Introduction” section, this work was conducted in two phases, each of which involved its own data collection, curating, and analysis. Figure1 presents a high-level snapshot of the method followed for both phases, which this section describes, including details on data collection and analysis for each phase (“Phase 1: A high-level analysis of hyperspecialization” section for phase 1 and “Phase 2: Hyperspecialization in development challenges” section for phase 2).
In phase 1, we conducted an exploratory study to explore the hyperspecialists phenomenon at a high level, analyzing the behavior of the participants in terms of types of challenges chosen. We collected data from more than 350,000 Topcoder users and randomly sampled 664 to conduct phase 1. For each user, we focused on their first 18 months of interaction, starting from the date of each users’ first challenge. We split the 18-month period into three 6-month periods. We counted the num-ber of challenges that each user registered for in each
these periods, classifying the participation by type (in TopCoder there are three main types of challenge: design, development, and data challenge). We then analyzed the hyperspecialization phenomenon in terms of type of chal-lenge, verifying whether their participation changed or not during the three periods, answering RQ1-2.
Given the promising results of phase 1, we decided to explore one specific kind of challenge in more depth. Therefore, in phase 2, we conducted a more in-depth analysis of the development challenges focusing on com-petition tasks with financial rewards. We analyzed all the developers who submitted responses to at least three challenges classified as development. We collected all the technologies that had been required by the chal-lenges that these developers submitted to. Then, we analyzed whether the developers participated in chal-lenges recurrently requiring a specific technology (hyper-specialists) or not and compared the groups to answer RQ3–RQ6.
For the sake of readability, we present the method and results for each of the phases separately: phase 1 in the next section and phase 2 in the “Phase 2: Hyperspecializa-tion in development challenges” section.
Phase 1: A high-level analysis of hyperspecialization
The goal of this phase was to preliminarily explore the phenomenon of hyperspecialization in crowdsourcing for
PHASE 1
Data Collection (Challenges / users)
Hyperspecialization high-level analysis
RQ1.Is it possible to identify hyperspecialists based on the challenge type?
RQ2. What is the relationship between the num- ber of challenges and participant abandonment?
PHASE 2
Data Collection (Dev. challenges characteristics / users'
profiles)
In-depth analysis of hyperespecialization in development challenges
RQ3. Is it possible to identify hyperspecialists by analyzing the challenges’ required technologies?
RQ4. Is the number of hyperspecialists in a technology related to the technology’s popularity?
RQ5.Is the number of hyperspecialists that participate in a challenge related to the popularity of the challenge?
RQ6. Is it possible to differentiate hyperspecialists and non-specialists based on challenges’ par ticipation data?
software development. In this phase, we aimed to ver-ify the possible manifestation of hyperspecialization in a broad context. To achieve this, we analyzed how Topcoder user’s participation evolved over time according to the type of challenge. The details about the method are pre-sented in the following.
Research method
We defined the following research questions to guide this phase:
• RQ1. Is it possible to identify hyperspecialists based on the challenge type?
• RQ2. What is the relationship between the number of challenges and participant abandonment?
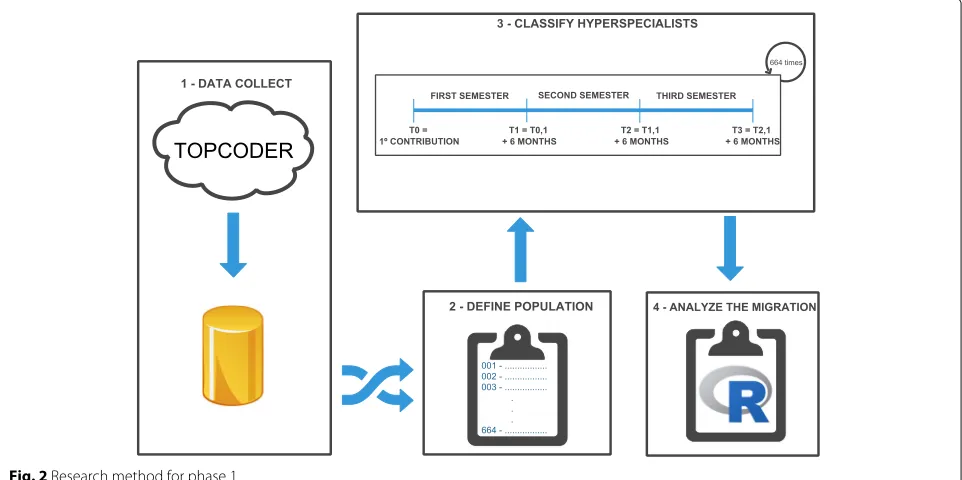
The method followed in this phase to answer the research questions is presented in Fig. 2. Data collec-tion and filtering (steps 1–2) and analysis (steps 2–4) are specified in the subsections below.
Data collection and filtering
The data collection (Fig.2, Step 1) was performed using a public API offered by the Topcoder platform. Firstly, we queried the challenges’ API3 to retrieve the infor-mation from past challenges and collect the usernames, so it would be possible to obtain detailed information about each challenge in which the users participated. By querying the users’ API using the usernames previously collected, we obtained data about the users’ participation in the challenges4and other user information5.
In this phase, we collected and made use of the rela-tionship between users and challenges users’ participa-tion in the challenges. All necessary data was stored in a local database to facilitate analysis. Data collection was performed from August 2016 to January 2017. The database stored all the participation in the various types of challenges of about 350,000 platform users.
In step 2 (Fig.2), we defined our population, imposing the following criteria: (i) users should have participated in at least one challenge and (ii) the first challenge date should be at least 18 months before the beginning of the data collection, since this was the timeframe in which we analyzed the users. For each of these users, we collected the 18 months of their participation, i.e., each participant has a specific 18-month timeline. Among the users that met the criteria, 664 were randomly sampled. Sampling population size was defined with a confidence level of 99% and a margin of error of 5%.
Data analysis
The data analysis included two other steps. In step 3, we counted the number of challenges in which each user in our sample participated. Since it was a preliminary analy-sis, submissions to the challenges were not mandatory; we only analyzed the registration in the tasks. After this, we analyzed if the hyperspecialization was observed, consid-ering the types of tasks chosen by the users. In Topcoder platform, tasks were classified into three major types: development, design, and data science. The purpose of this step was to conduct a temporal analysis for each user,
checking the number of challenges that each user partic-ipated in, according to the type (development, design, or data science). This classification served as the basis for the analysis of the existence (or not) of hyperspecialization over time. We individually defined the timeline of each participant, considering the date that the users partici-pated in their very first challenge. This timeline was set to 18 months, starting with the date of the first challenge. To analyze hyperspecialization, this period was split into three 6-month periods, as depicted in Fig.2.
Based on the users’ timeline (split into 6-month peri-ods), we classified each user as hyperspecialist or non-specialist for each period analyzed. We considered that a participant would be considered as a hyperspecialist if at least 75% of the challenges in which they participated were the same type. If the 75% threshold was not achieved, the participant was classified as “non-specialist.” In addi-tion, we classified those users who did not participate in any challenge in a given 6-month period as “no contribu-tion.” This only occurred in the second or third analysis period, since we only sampled developers with at least one challenge. The 75% threshold was defined by the authors, since we found no values in the literature that could be used for this purpose. We determined this value as fair to study the phenomenon in this preliminary work, since it is based on the distribution of the developers in the plat-form, yet we understand that this may pose a threat to validity.
In step 4, we analyzed user classification according to hyperspecialization over the three time periods. We ver-ified whether there was a “change” or a “maintenance” of the participants’ specialty, comparing the initial 6-month period with the following periods. Through this compar-ison, a descriptive analysis of the data was conducted in order to verify if the hyperspecialization phenomenon was observed.
We also verified whether those users who kept con-tributing over the three periods varied in the number of challenges in which they participated. For this analysis, we used the ANOVA one-way repeated measure statis-tical test to compare three results from the observation of the same group of samples. In the context of this study, all the users who participated in the three peri-ods (including non-specialist users) were selected. We tested the following null hypothesis (H0): participation in the three periods is equal regarding the number of challenges.
We used the chi-square test to evaluate whether a low number of challenges related to abandonment or perma-nence in the platform. For this test, were created two groups. The first group was composed of the number of challenges that theparticipants who continuedin the plat-form in the second semester, the second group was com-posed of the participants who abandoned the platform
(did not take part in any challenge) in the second semester. The null hypothesis (H0) is:the amount of participation in the challenges is not associated with the permanence or abandonment of the users in the platform.
Results
In this section, we present the results of phase 1, organized according to the research questions.
RQ1. Is it possible to identify hyperspecialists based on the type of the challenges?
Among the 664 participants analyzed, only 98 (14% of the sampled population) continued contributing through-out the three periods (18 months) of the study. Of these 98, 92 (93.8% of the participants who remained) kept contributing to the same type of challenge over the 18-month period. This result indicates that hyperspe-cialization may manifest itself in relation to the type of challenge. The number of hyperspecialists in the three periods according to the type of challenge was: 8 hyper-specialist users in development, 4 in design, and 80 in data science.
In addition to the above, we observed that 35 partici-pants were absent in the second half of the analysis, but returned in the third. Among these participants, only 3 (8.6%) changed their specialty from the first to the third period—all of them were classified asdata science special-ists in the first semester, whereas in the third they were classified as development (2) and design (1) specialists. The remaining 32 (91.4%) were classified with the same specialty in both periods.
Interestingly, the users who kept contributing through-out the three periods differed in the number of contribu-tions they made. To analyze this characteristic, we used the ANOVA test, comparing the number of challenges they participated in over the three periods. The result shows a difference in the number of challenges (F = 6.07; p value = 0.003), rejecting H0. The results of the multi-comparisonspvalues were adjusted using the Tukey method, which showed that the number of disputed chal-lenges in the first period differed from the second period (t-ratio= 2.48;pvalue=0.04). There was also a differ-ence in the number of challenges between the first and third periods (t-ratio=3.36;pvalue=0.002). However, there is no evidence that the values for the second and third periods differ (t-ratio = 0.881; p value = 0.653). By means of this analysis, we verified that the contribu-tion of users who contribute in all periods peaks in the first semester, reducing the number of contributions in the second period, which remains constant in the third (Fig.3).
RQ2. What is the relationship between the number of challenges and participant abandonment
First semester Second semester Third semester
Number of challenges
Fig. 3Distribution of the number of challenges in the three analyzed periods
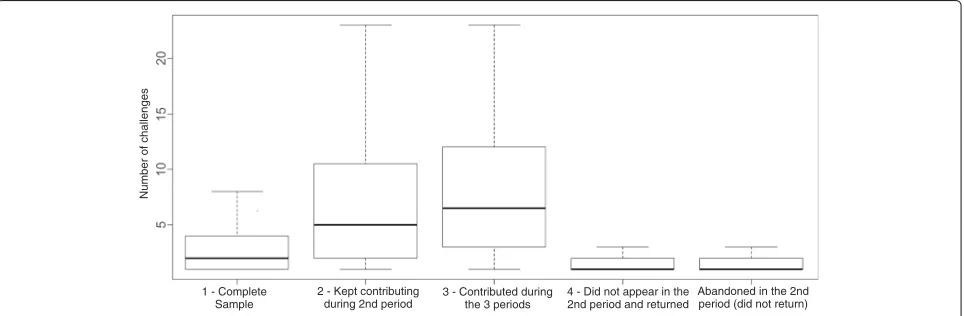
first user participation) indicates the possible abandon-ment of their platform. This fact corroborates the results presented by Zanatta et al. [5], in which the authors present the barriers that newcomers face while attempt-ing to participate in challenges in the platform. In our study, we observed that 272 of the 441 users who stopped contributing participated in only one challenge. The other 169 users who quit varied between two and 28 chal-lenges (median = 3, standard deviation = 3.44). This characteristic may indicate at least five potential situa-tions: (i) users did not adapt themselves to the platform standards (difficulty to find appropriate tasks, problems with interacting with the platform and with other users, among others), (ii) users lacked knowledge to complete tasks, (iii) inefficiency of the training methods proposed by the platform, (iv) users already achieved their goal to participate/train in some specific technology or to earn a given amount of money, or (v) users looking to make money quickly did not win the first challenges and thus invested their time without the expected “return of investment.”
In Fig. 4, it is possible to observe the distribution of the amount of participation of our sample in the first period (outliers are not presented for a better visualiza-tion). Looking at the boxplots, it is possible to notice that, in general, users who stop contributing (abandon) participate in fewer challenges than users who remain active on the platform in the following periods.
To validate the analysis of theboxplotsand verify if there is a relationship between the participation amount and the abandonment/permanence in the platform, we per-formed a chi-square test. The result of the test indicates that the number of challenges that a user participated in is an indication of abandonment/permanence, rejectingH0 (X2=197.18,pvalue = 0.001). However, this is only a pre-liminary analysis. Other studies still need to be conducted to better understand this phenomenon.
Phase 2: Hyperspecialization in development challenges
Given the promising results of phase 1, in which we evidenced the hyperspecialization phenomenon in terms
1 - Complete Sample
2 - Kept contributing during 2nd period
3 - Contributed during the 3 periods
4 - Did not appear in the 2nd period and returned
Abandoned in the 2nd period (did not return)
Number of challenges
of the type of challenge, in phase 2, we decided to fur-ther explore the hyperspecialization in a more specific context. We decided to focus on the challenges classi-fied as “development.” We chose this specific type since these challenges are proposed by companies (as opposed to data science, which are mainly related to marathon-like challenges) and offer financial rewards. Thus, our goal in this phase was to characterize the hyperspecialists in the context of development challenges in Topcoder.
Research method
To guide our research during the second phase of our study, we defined the following research questions:
• RQ3. Is it possible to identify hyperspecialists by analyzing the challenges’ required technologies? • RQ4. Is the number of hyperspecialists in a
technology related to the technology’s popularity? • RQ5. Is the number of hyperspecialists that
participate in a challenge related to the popularity of the challenge?
• RQ6. Is it possible to differentiate hyperspecialists and non-specialists based on challenges’ participation data?
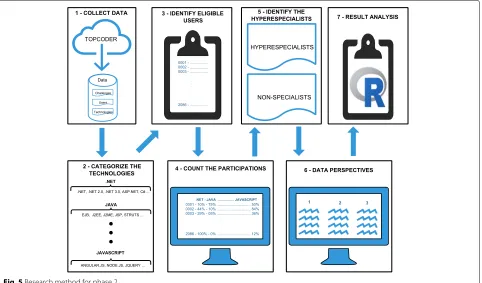
To answer these questions, we followed the method pre-sented in Fig.5. Data collection and selection (steps 1–4)
and analysis (steps 5–7) are specified in the subsections below.
Data collection and selection
During step 1 of the method (Fig. 5), we collected data of development challenges and users of the Topcoder platform. The collection was done, once again, by query-ing the Topcoder API.
Firstly, we again collected the challenges data and user-names from the challenge APIs6. A total of 15,351 unique identifiers of development challenges were collected. With these identifiers, once again, the API was queried7, so it was possible to collect the names of the 29,276 (unique) users who participated in a challenge. For each user, we use the API8 to collect data related to their participa-tion in challenges, including the role played (competi-tor, reviewer, co-pilot), placement in each challenge, and information on the number of submissions. When the user had a submission that resulted in a financial reward, called a winning submission, that information was also stored.
In addition, challenge data such as the total of rewards, the start of registration, and the required technologies were also collected and stored. In the platform, each chal-lenge may require multiple technologies. Therefore, we collected and mapped the association between technology and challenge as a many-to-many relationship.
It is important to note that throughout the collection, we identified some inconsistencies in users’ data. We basi-cally identified two types of problems: (i) for some users, it was not possible to iterate through all the challenge pages, and (ii) some users did not have data available for collec-tion because they had shut down their accounts. A total of 39 users with these problems were discarded.
After the collection, we could identify the existence of 200 different technologies associated with the challenges. However, by examining these technologies, we noticed the existence of similar or identical technologies repre-sented by different names, as well as specific versions of a technology and specific frameworks related to specific technologies. So, in step 2, we classified the retrieved tech-nologies into more generic categories to reduce the initial set. This classification was carried out by the authors of this paper in meetings dedicated for this purpose. We used a card-sorting-based approach, in which we discussed every technology and how to classify it. The process was iterative, until there was a consensus on the classifica-tion. Examples of categorization include the following: C#, .NET, .NET 2.0, and .NET 3.0 were classified as “.NET”; J2EE, J2SE, and Java were classified as JAVA. We under-stand that we lose in terms of granularity; however, work-ing with specific technologies would make it harder to analyze the phenomenon. The complete list of categories and technologies are available here9.
In step 3 (Fig. 5), we selected our participants based on certain criteria. We used more restrictive criteria in phase 2 than in phase 1, since our goal here is to analyze the users’ entire lifetime in the platform. Thus, we filtered those users who registered and submitted solutions for at least 3 different challenges. The threshold of three was defined after analyzing the distribution of the number of challenges in which the users collected participated, and three as delimited the third quantile. This action was taken to choose only the users who actually interacted with the platform. It is important to note that we only considered those users that participated as a “submitter” in three chal-lenges, i.e, the users that submitted a proposed solution (artifact) to the challenge. This differed from phase 1, in which registering to the challenges was enough. Thus, we discarded people from staff (e.g., reviewers and co-pilots) and users who just registered for the challenge but did not submit a solution. Regarding the challenges, we con-sidered only those that offered a financial reward, started registration before September 1, 2016, and had at least one required technology listed.
After applying the criteria to select users and challenges, we reached the population of 2086 users considered in our analysis. These users were considered in step 4, in which we defined each user’s participation rate per technology. This rate was calculated by counting the number of chal-lenges that required a given technology in which the user
had submitted a solution and dividing by the total num-ber of challenges in which the user submitted solutions regardless of technology. For example, if JohnDoe partici-pated in 10 challenges, of which 8 required Java and in 4 of them HTML was required, the “HTML rate” for JohnDoe is 40% and his “Java rate” is 80%.
Data analysis
In order to classify developers into hyperspecialists and nonspecialists (step 5), we also used the 75% threshold used in phase 1. Specialists were defined as those users who had at least 75% of their submissions on challenges that required at least one technology in common (technol-ogy rate). Using JohnDoe for the example once again, since his rate for Java is 80%, he is classified as a Java specialist. It is also possible that the developers are hyperpecialists in multiple technologies, since challenges may require more than one technology. In this case, developers reach the threshold of 75% for each of the technologies. For exam-ple, Mary participated in 10 challenges, and for 9 of them, PHP and HTML are required. So, Mary was considered specialist in PHP and HTML.
As mentioned previously, we consider 75% a fair thresh-old to analyze this phenomenon, given that the developers who reached that threshold predominantly focus on a specific technology (or set of technologies) when choos-ing their tasks, indicatchoos-ing that they are hyperspecialists. Moreover, in phase 2, this threshold enabled us to have a fairly balanced distribution of hyperspecialists’ and non-specialists’ groups. We understand that different thresh-olds could be used, but we reiterate that no indicator exists in the literature to support our decision.
In step 6 (Fig. 5), the data were analyzed from three perspectives: (i) technologies, (ii) challenges, and (iii) par-ticipants. From a technology perspective (i), we analyzed the number of challenges in which each technology was required, the total number of participants submitted to the challenges in which it was required, and the total num-ber of specialists in that technology. From the perspective of the challenges (ii), we considered the total number of participants and the number of specialists that submit-ted to each challenge. Finally, from the perspective of the participant (iii), we analyzed for each participant the total number of challenges, the number of technologies they had contact with, and the total number of victories (num-ber of challenges that the user was in a placement that guaranteed financial reward). In the case of hyperspe-cialists, we also analyzed the number of challenges with submissions and the number of victories in the challenges that contained some technology in which the user was a specialist.
by graphs presenting different perspectives of our data. In some cases, some attributes were used to compare hyper-specialists and non-hyper-specialists. In these cases, we used the Mann-Whitney-Wilcoxon statistical test, given that it is a nonparametric test that does not require the assumption of normal distributions. We also made use of the effect size test called Cliff-delta to compare the groups. For the other RQs (RQ4 andRQ5), we used the Spearman cor-relation test since, once again, our data did not follow a normal distribution. ForRQ4, we compare the number of challenges and the number of participants per technology. Similarly, we used the correlation test onRQ5to compare the number of participants and the number of specialists per challenge.
Results
As in phase 1, we present the results according to the research questions previously presented.
RQ3. Is it possible to identify hyperspecialists analyzing the challenges’ required technologies?
The answer is yes. Considering the 2086 users analyzed, 1256 (≈60%) were classified as hyperspecialists in at least one technology. Among the 74 categories of technologies analyzed, we found specialists in 34. For the other 40, no specialist could be found. In Table1, we can observe that from the 1256 users cataloged as hyperspecialists, 1106 specialized in 1 technology, 60 specialized in 2 technolo-gies, 88 specialized in 3, and 2 users were classified as specialists in 4 technologies.
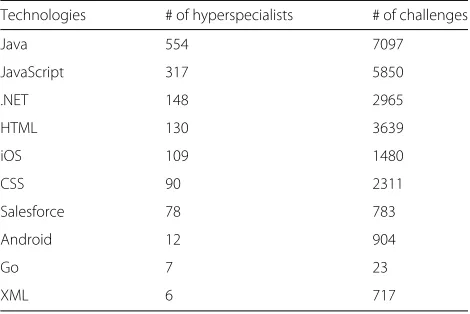
Table2shows the 10 technologies with the higher num-ber of identified hyperspecialists and the numnum-ber of chal-lenges that required each technology. Java, JavaScript, and .NET are the top three in terms of the number of hyper-specialist with 554, 317, and 148 respectively. Considering the number of challenges, we observed that the top three technologies are different, since the HTML appeared in the third position instead of .NET. It is also possible to notice that the language Go appears as required in only 23 challenge; however, it was possible to identify 7 hyperspecialists in this technology.
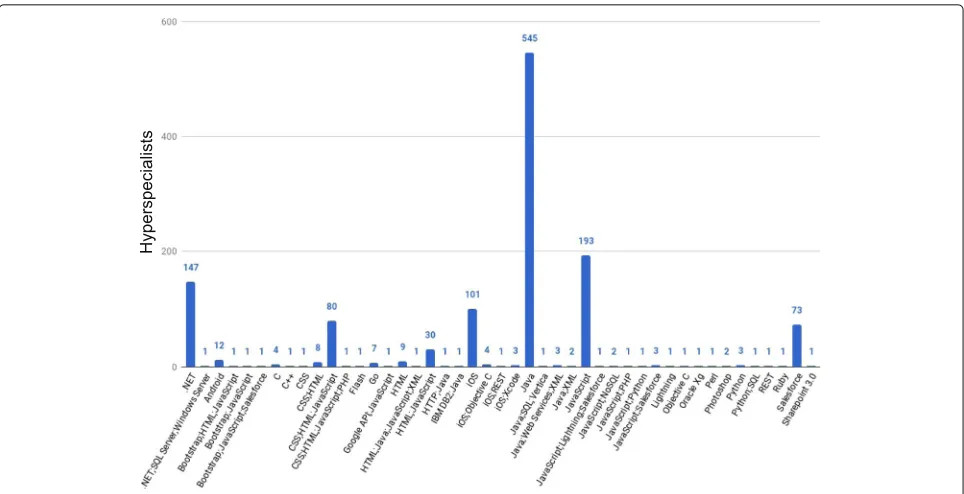
Figure 6 provides more details about the num-ber of hyperspecialists per technology, including the combination of hyperspecializations observed. From the
Table 1Distribution of the hyperspecialists by the number of
technologies in which they specialize
# of hyperspecialists # of technologies
1106 1
60 2
88 3
2 4
Table 2Top 10 technologies in terms of the number of
hyperspecialists available
Technologies # of hyperspecialists # of challenges
Java 554 7097
JavaScript 317 5850
.NET 148 2965
HTML 130 3639
iOS 109 1480
CSS 90 2311
Salesforce 78 783
Android 12 904
Go 7 23
XML 6 717
45 hyperspecializations presented in the figure, 23 present multiple technologies. By summing the number of hyper-specialists on these combinations, we found that 151 (9.1%) users present multiple specialties. Among them, 89 include HTML and CSS (Cascading Style Sheets): 8 spe-cialists in only in CSS and HTML; 80 in CSS, HTML, and JavaScript; and 1 in CSS, HTML, JavaScript, and PHP. These are apparently extreme cases of hyperspecializa-tion, in which the users seek out challenges requiring a given set of technologies.
Fig. 6Number of hyperspecialists per technology or combination of technologies
In addition, we investigated the existence of hyperspe-cialists in relational databases, instead of in a specific database technology. To do so, we aggregated PostgreSQL, MySQL, DB2, SQL Server, Oracle, and SQL (Structured Query Language) in a category and checked for users who would be called hyperspecialists in a relational database because they participated in challenges requiring any of the listed technologies. We found 7 hyperspecialists; however, 5 of them had been previously identified as hyperspecialists in specific DB (database) technologies (SQL(2), DB2(1), Oracle(1), and SQL Server(1)). Thus, we found only 2 hyperspecialists by aggregating the database technologies. This observation reinforces the hypothesis
Table 3Top-10 technologies with no hyperspecialist
Technology # of challenges
MySQL 414
PostgreSQL 279
PhoneGap 127
Flex 77
Commerce Server 2009 72
XSL 54
Ruby on Rails 47
Docker 46
Google App Engine 46
UML 44
that users were attracted to other technologies and not databases.
RQ4. Is the number of hyperspecialists in a technology related to the popularity of the technology?
The short answer is yes. To answer the question, we cal-culated the correlation between the number of challenges that required a particular technology and the percent-age of the participants that were hyperspecialists in the challenges that involved that technology. The ratio was calculated to normalize the data and analyze the “den-sity” of hyperspecialists, instead of the absolute number (as presented in Table2). The result of the Spearman cor-relation test confirmed the observation (0.689). This result is considered a strong positive correlation [18], indicat-ing that the trendindicat-ing technologies tend to have a higher number of hyperspecialists.
We also calculated the correlation using the abso-lute number of hyperspecialists and number of chal-lenges requiring a technology. The result showed a very strong correlation (0.804) as well, showing that the number of specialists indeed correlates to the num-ber of challenges available requiring the technology they master.
RQ5. Is the number of hyperspecialists that participate in a challenge related to the popularity of the challenge?
moderate positive correlation, indicating that when the number of developers increases, the number of hyperspe-cialists also increases.
In a previous work by Mao et al. [1], the authors men-tion that experienced members register early to challenges they master to prevent other members from participating. However, by analyzing our correlation, it is not possible to understand whether our results align with or contradict Mao and colleague’s result. Therefore, we took a closer look at the distribution of the number of hyperspecial-ists per challenge, which is presented in Table 4. In the table, it is possible to observe that 43% of all challenges do not count on the presence of hyperspecialists. Disre-garding the challenges that do not have hyperspecialists, 62% of the challenges verified have only one hyperspecial-ist user, which to some extent affirms Mao and colleagues’ observation.
RQ6. Is it possible to differentiate hyperspecialists and non-specialists based on challenges participation data?
To answer this question, we analyzed the differences between the hyperspecialists and non-specialists regard-ing the number of technologies the users were engaged with, the number of challenges that the users participated in, the number of victories and the proportion of wins per challenge.
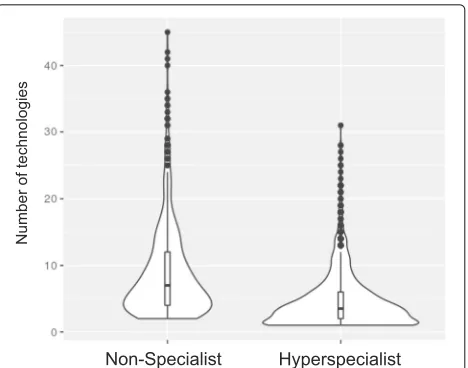
The first characteristic analyzed was the total amount of different technologies that users had contact with. This number was obtained by analyzing the technologies required in the challenges in which users participated. The distribution for hyperspecialists and non-specialists is shown in Fig. 7. It is possible to observe that the majority of the hyperspecialists and non-specialists are in the bottom of the plot. By analyzing the medians and the whiskers, it is possible to verify that hyper-specialists had contact with a smaller number of dif-ferent technologies when compared to non-specialists. This is expected, as hyperspecialists seek challenges that require one (or some) specific technologies, while non-specialists contribute across a wider number of chal-lenges, either by giving less attention to the required technologies or contributing to simpler challenges. This apparent difference was confirmed by Mann-Whitney-Wilcoxon, (pvalue < 0.001), indicating an unequal number
Table 4Number of hyperspecialist per challenge
Challenges Hyperspecialists
8171 0
6525 1
2272 2
865 3
826 ≥4
Fig. 7Distribution of different technologies that users had contact with
of technologies for each user in both distributions. The cliff-delta (cliff-delta = 0.379) shows that there is a medium effect size, which higher for the non-specialists, confirming what is observed in the violin plots.
Figure 8 presents the distribution of number of chal-lenges that the hyperspecialists and non-specialists par-ticipated. Again, we used the Mann-Whitney-Wilcoxon statistical test to compare both distributions. We found that the number of challenges in both distributions is not equal (p value < 0.001). Once again, we found a small effect size (cliff-delta=0.162), indicating slightly higher values for non-specialists. One possible explanation for this result is that non-specialists focus on a wider variety
of challenges, since they are not “constrained” by a set of technologies.
By analyzing the hyperspecialists’ participation in chal-lenges, we found that 60% of hyperspecialists partici-pated only in challenges requiring a technology in which they specialize. In addition, 83% of these hyperspecial-ists participated in less than 10 challenges (as depicted by the—flattened—violin plot). For the non-specialists, we observed that 48% of them (408 users) took part in less than 10 challenges and that there are 5 outliers that sub-mitted to more than 350 challenges, with a maximum of 702. We also took a look at the subset of developers who participated in more than 100 challenges, finding 45 non-specialists (5.4%) and only 29 hypernon-specialists (2.3%). This is more evidence that non-specialists participate in more challenges.
The number of victories is another characteristic we used to compare hyperspecialists and non-specialists. In Fig.9, we can observe many users classified as hyperspe-cialists with no victories. This phenomenon happens to a lesser extent in users who have not been catalogued as hyperspecialists, since the distribution on the graph is more homogeneous in relation to hyperspecialists. As in previous observations, the Mann-Whitney-Wilcoxon test also indicated a significant difference between the wins between the groups (pvalue < 0.001). A small effect size (cliff-delta=0.168) was found in favor of non-specialists. Analyzing the group of hyperspecialists, we found 523 (41.6%) users without wins. As for non-specialists, we found 236 (28.4%) users without any victory. We could not find any explanation for this fact. For those who won at least one challenge, 93% (683 hyperspecialists) have more than 70% of their wins in the challenges that required the technologies in which they hyperspecialized.
Fig. 9Number of victories per user: hyperspecialists vs. non-specialists
Another interesting fact is that a few members are responsible for the most of the victories. Analyzing the top 5% for each group, we found that, for hyperspecial-ists, these 63 users are responsible for 53.8% of the group’s victories (5227 of 9715); for non-specialists, the numbers are similar: 46 people were responsible for 50.98% of the group’s victories (5721 of 11222). Analyzing the top 20%, we noticed that the 80/20 rule is observed (overall, 20% of our population are responsible for 84.4% of the victories). We observed that non-specialists have greater num-bers than specialists of both challenges and victories. By testing the correlation of these two distributions, we found that they are, indeed, strongly correlated: 0.788 con-sidering all the users; 0.746 concon-sidering hyperspecialists only; and 0.832 considering non-specialists. We thus evi-dence that the more users compete, the more they win, regardless their specialization. To make a fair compari-son, we decided to verify whether the ratio of victories (#wins/#challenge) differs when comparing hyperspecial-ists and non-specialhyperspecial-ists. The distribution of this ratio is shown in Fig.10. It is still noticeable that the base of the distribution of hyperspecialists is still larger than for non-specialists (since we have more non-specialists without vic-tories). However, the distributions are now clearer (since there are no outliers after we normalized the data). We cal-culated the Mann-Whitney-Wilcoxon test once again, and the result still shows differences between the populations (p value < 0.001). However, the effect size is negligible (cliff-delta = 0.1163) in favor of non-specialists.
Discussions
The term hyperspecialist was presented by Malone and his colleagues in 2011 [13]; since then, little has been
discussed about it in the literature. Thus, this work sought to propose a way to classify the Topcoder users according to the perspective of the hyperspecialists.
By analyzing the phenomenon, we found differences between hyperspecialists and non-specialists. However, these differences are small or negligible, so it is oppor-tune to discuss them from other perspectives. Analyzing the top 100 users in terms of number of submissions, we found 60% are non-specialists. By analyzing top 100 users in terms of the highest proportion of wins per challenge, this number drops to 46% non-specialists (thus, 54% are hyperspecialists). These facts, along with the analyses conducted in the “Results” section, reinforce the idea that there could be differences in terms of engagement com-paring hyperspecialists and non-specialists. However, it is not possible to infer this level of engagement by merely analyzing our results since (i) the analyzed population was formed with the users who made the most submissions on the platform; (ii) although submitting to fewer chal-lenges, hyperspecialists are more precise, since they have more wins per challenges. In summary, in order to analyze the engagement of hyperspecialists, another study focus-ing on the engagement level would be necessary, perhaps adding other variables to the analysis, such as frequency of contribution, level of confidence of the submissions, etc.
Another interesting comparison would be to analyze how aligned the hyperspecialists and technologies are in relation to the industry outside the platform. By compar-ing the top 5 technologies with most hyperspecialists in this study (Table3) to the top 5 most popular Stackover-flow technologies10, we could verify that Java, JavaScript, and HTML are among the key technologies in both clas-sifications. The technologies that complete the ranks are .NET and iOS (in our study), and CSS and SQL (in Stack-overflow).
This work has direct implications for at least three pil-lars of crowdsourcing (companies, platforms, and devel-opers).
Companies.We could observe a great parcel of devel-opers in Topcoder that were classified as specialists in one or more technologies (RQ3). Companies can con-sider this when making their tasks available. By depending on a taskforce of specialists, it can be possible to easily find help solving specific problems and quickly receive answers from knowledgeable/skilled developers. We also observed that a many non-specialists deliver winning arti-facts. Therefore, companies can also rely on these users to support different kinds of situations. Specifically for Top-coder, we characterized the challenges, technologies, and developers, showing the most requested technologies and the population of hyperspecialists per technology.
Developers. We believe that our results can encour-age developers to join and engencour-age crowdsourcing plat-forms. As it was possible to notice while answering RQ6,
although there is a high number of hyperspecialists, the number of victories achieved by more generalists is higher than by the hyperspecialists. Thus, there is opportunity for different profiles, and it is possible to make money contributing to crowdsourcing projects in both cases.
Platform.The platform is probably the one that benefits most from the research results. Firstly, it was evidenced that a large set of technologies has no identified special-ists (RQ3). The platform could invest in methods to help and foster developers to specialize in these technologies as well as encourage customers to create demands on those technologies. Secondly, few users effectively sub-mit to the challenges, since we could only analyze 2086 users that submitted solutions to at least 3 challenges. Thirdly, in phase 1 we evidenced that 66% of our sample abandoned the platform before the first 6 months. There-fore, the platform maintainers need to think about strate-gies to keep new members engaged, thus reducing this high rate.
Fourth, it has been shown that an “elite class” accounts for most of the victories (RQ6). It is possible that, follow-ing the observations cited in this paragraph, more skilled users can engage in the platform and to potentially win more challenges. Finally, by identifying hyperspecialists, it is possible for the platform to use this characteriza-tion to explore the peculiarities of each group in order to improve its business model or better match demands, thus attracting and retaining more developers to result in better software and consequently improved customer satisfaction.
Researchers. This work can inspire replications, for example, to analyze the manifestation of hyperspecializa-tion in other crowdsourcing models in software engineer-ing and other domains. We believe that the micro-task model is more advantageous for hyperspecialists. Finally, we hope that this work will help in the evolution of the research related to the contribution profiles of users of crowdsourcing for software development and inspire further investigation of this phenomena.
Limitations and threats to validity
Finally, in the 100% threshold scenario, we would have 739 hyperspecialist users. Our goal for phase 2 was to find a balance between hyperspecialists and non-specialists. So, we opted for the 75% threshold.
Another potential threat regards the decision to classify the technologies into generic categories. This action was taken because the purpose of this work is to character-ize the profile of hyperspecialists in a given technology. It would be challenging, or even in possible, to identify this profile if taking too fine-grained of an approach to tech-nologies (frameworks, components), such as if we were to distinguish between versions of a specific technology (.NET 2.0/.NET 3.0, Oracle 9i/Oracle 10g). An alternative way of classifying technologies would be used to analyze the phenomenon from another perspective. The Topcoder platform indicates the most currently used technologies 11; however, this classification does not encompass all the
technologies in the database. In addition, we believe that by generalizing the technologies, it was possible to provide a good snapshot of this phenomenon.
The limit of this work’s results relates to the plat-form and the sample. We analyzed tasks and developers from Topcoder, which is a platform that implements a competition-based crowdsourcing model. Moreover, in the second phase, we focused on development challenges that offered financial rewards for the winners. The results would not apply to other platforms or models. Despite this limitation, the proposed method can be used to repro-duce the analysis of hyperspecialization in other contexts. For instance, this method can be applied in the Topcoder platform itself, considering different ways to classify the challenge or defining the development challenges’ tech-nologies with more granularity or even studying other platforms. In addition, we sample only those users who submitted solutions to at least 3developmentchallenges. We defined this threshold based on the distribution of submissions, opting to analyze the third quantile (top25%) of users.
Conclusion
In this study, we evidenced, in two distinct ways, the exis-tence and characteristics of users that focus their efforts to specific types of tasks or technologies within crowdsourc-ing software development platforms.
The results of phase 1 showed that hyperspecialization can be evidenced in terms of the type of task chosen by the users. Among those who continued contributing for 18 months after their debut, 94% contributed to tasks of the same type (development, design, or data science). In addition, we evidenced a high abandonment rate (66% of our sample contributed only in the first period of analysis). Platform must reverse this trend if they are to maintain a larger pool of workers who can build higher quality systems.
The results of phase 2 showed that in development chal-lenges, 60% of the users are hyperspecialists. There are hyperspecialists in 45% of the technology categories; how-ever, famous and consolidated technologies like Docker, Mysql, and PostgreSQL do not count on specialists. While comparing specialists and non-specialists, we found that non-specialists submit to challenges with a wide range of technologies, participate in more challenges, and surpris-ingly, present a higher winning rate than hyperspecialists. As a future work, we plan to explore more details about the hyperspecialists profile and conduct a more qualitative work to understand strategies, benefits, and drawbacks of being a specialist. We also plan to analyze more charac-teristics of users’ profiles to identify different patterns of contributors in this software development crowdsourcing platforms.
Endnotes
1https://www.topcoder.com/community/members/
2
https://www.topcoder.com/marketplace/the-community/
3http://api.topcoder.com/v2/challenges/past
4https://api.topcoder.com/v3/members/
<USERNAME>/challenges/
5http://api.topcoder.com/v3/members/<USERNAME>
6http://api.topcoder.com/v2/challenges/past?type=
develop&pageIndex=1&Size=16000
7https://api.topcoder.com/v2/develop/challenges/
<CHALLENGE_ID>
8https://api.topcoder.com/v3/members/
<USERNAME>/challenges/?filter=track%3dDEVELOP& limit=50&offset=0&orderBy=submissionEndDate
9https://zenodo.org/record/1169411
10https://insights.stackoverflow.com/survey/2018/#
technology
11
https://hub.appirio.com/cloud-powered-blog/what-are-the-hottest-technologies-in-crowdsourcing
Abbreviations
API: Application programming interface; CSS: Cascading Style Sheets; DB: Database; HTML: Hypertext Markup Language; RQ: Research question
Acknowledgements
We thank Ana Paula Chaves for her support related to statistical methods.
Funding
Not applicable.
Availability of data and materials
All data used in this paper can be found online at:https://github.com/ andersonneira/jbcs-data.
Authors’ contributions
analyzed the data, and wrote the final version of the text. ISW collaborated with the planning, analysis, and final writing of the text. All authors read and approved the final manuscript.
Competing interests
The authors declare that they have no competing interests.
Publisher’s Note
Springer Nature remains neutral with regard to jurisdictional claims in published maps and institutional affiliations.
Author details
1Departamento de Informática, Universidade Estadual de Maringá, Maringá,
PR, Brazil.2Departamento de Computação, Universidade Tecnológica Federal
do Paraná, Campo Mourão, PR, Brazil.3School of Informatics, Computing, and Cyber-Systems – Northern Arizona University, Flagstaff, AZ, USA.
Received: 25 February 2018 Accepted: 20 November 2018
References
1. Mao K, Wang Q, Jia Y, Harman M (2016) PREM: Prestige Network Enhanced Developer-Task Matching for Crowdsourced Software Development. Department of Computer Science, UCL (University College London), London
2. Tunio MZ, Luo H, Cong W, Fang Z, Gilal AR, Abro A, Wenhua S (2017) Impact of personality on task selection in crowdsourcing software development: A sorting approach. IEEE Access 5:18287–18294 3. Xie H, Lui JCS, Jiang JW, Chen W (2014) Incentive mechanism and
protocol design for crowdsourcing systems. In: 2014 52nd Annual Allerton Conference on Communication, Control, and Computing (Allerton). IEEE, Washington, DC. pp 140–147.https://doi.org/10.1109/ ALLERTON.2014.7028448
4. Karim MR, Messinger D, Yang Y, Ruhe G (2016) Decision support for increasing the efficiency of crowdsourced software development. CoRR abs/1610.04142. 1610.04142
5. Zanatta A, Steinmacher I, Machado L, de Souza C, Prikladnicki R (2017) Barriers faced by newcomers to software-crowdsourcing projects. IEEE Softw 34(2):37–43
6. Dubey A, Abhinav K, Taneja S, Virdi G, Dwarakanath A, Kass A, Kuriakose MS (2016) Dynamics of software development crowdsourcing. In: 2016 IEEE 11th International Conference on Global Software Engineering (ICGSE). IEEEE, Washington, DC. pp 49–58.https://doi.org/10.1109/ICGSE.2016.13 7. Mao K, Capra L, Harman M, Jia Y (2015) A survey of the use of
crowdsourcing in software engineering. J Syst Softw 126:57–84 8. Saremi RL, Yang Y (2015) Dynamic simulation of software workers and
task completion. In: 2015 IEEE/ACM 2nd International Workshop on CrowdSourcing in Software Engineering. IEEE, Washington, DC. pp 17–23. https://doi.org/10.1109/CSI-SE.2015.11
9. Surowiecki J (2005) The Wisdom of Crowds: Why the Many Are Smarter than the Few, New York
10. LaToza TD, van der Hoek A (2016) Crowdsourcing in software
engineering: Models, motivations, and challenges. IEEE Softw 33(1):74–80 11. Yang Y, Saremi R (2015) Award vs. worker behaviors in competitive
crowdsourcing tasks. In: 2015 ACM/IEEE International Symposium on Empirical Software Engineering and Measurement (ESEM),
Washington, DC. pp 1–10.https://doi.org/10.1109/ESEM.2015.7321192 12. Ambreen T, Ikram N (2016) A state-of-the-art of empirical literature of
crowdsourcing in computing. In: 2016 IEEE 11th International Conference on Global Software Engineering (ICGSE). IEEE, Washington, DC. pp 189–190
13. Malone TW, Laubacher RJ, Johns T (2011) The age of hyperspecialization. Harv Bus Rev 89(7-8):56–65
14. Hosseini M, Phalp K, Taylor J, Ali R (2014) The four pillars of crowdsourcing: A reference model. In: RCIS Conference 2014. IEEE, Washington, DC. pp 1–12
15. Gadiraju U (2015) Make hay while the crowd shines: Towards efficient crowdsourcing on the web. In: Proceedings of the 24th International Conference on World Wide Web. ACM, New York. pp 493–497 16. Gray ML, Suri S, Ali SS, Kulkarni D (2016) The crowd is a collaborative
network. In: Proceedings of the 19th ACM Conference on
Computer-Supported Cooperative Work & Social Computing. ACM, New York. pp 134–147
17. Mao K, Yang Y, Wang Q, Jia Y, Harman M (2015) Developer
recommendation for crowdsourced software development tasks. In: 2015 IEEE Symposium on Service-Oriented System Engineering, Washington, DC. pp 347–356.https://doi.org/10.1109/SOSE.2015.46