DOI 10.1007/s13174-011-0033-z S I : C L O U D C O M P U T I N G
A
2
HA—automatic and adaptive host allocation in utility
computing for bag-of-tasks
João Nuno Silva·Luís Veiga·Paulo Ferreira
Received: 8 November 2010 / Accepted: 26 July 2011 / Published online: 27 August 2011 © The Brazilian Computer Society 2011
Abstract There are increasingly more computing problems requiring lengthy parallel computations. For those without access to current cluster or grid infrastructures, a recent and proven viable solution can be found with on-demand util-ity computing infrastructures, such as Amazon Elastic Com-pute Cloud (EC2). A relevant class of such problems, Bag-of-Tasks (BoT), can be easily deployed over such infras-tructures (to run on pools of virtual computers), if provided with suitable software for host allocation. BoT problems are found in several and relevant scenarios such as image ren-dering and software testing.
In BoT jobs, tasks are mostly independent; thus, they can run in parallel with no communication among them. The number of allocated hosts is relevant as it impacts both the speedup and the cost: if too many hosts are used, the speedup is high but this may not be cost-effective; if too few are used, the cost is low but speedup falls below expectations. For each BoT job, given that there is no prior knowledge of neither the total job processing time nor the time each task takes to complete, it is hard to determine the number of hosts to allocate. Current solutions (e.g., bin-packing algorithms) are not adequate as they require knowing in advance either the time that the next task will take to execute or, for higher efficiency, the time taken by each one of the tasks in each job considered.
J.N. Silva·L. Veiga·P. Ferreira (
)INESC ID, Instituto Superior Técnico, Technical University of Lisbon, Rua Alves Redol 9-6 Andar, 1000-029 Lisbon, Portugal
e-mail:[email protected] J.N. Silva
e-mail:[email protected] L. Veiga
e-mail:[email protected]
Thus, we present an algorithm and heuristics that adap-tively predicts the number of hosts to be allocated, so that the maximum speedup can be obtained while respecting a given predefined budget. The algorithm and heuristics were simulated against real and theoretical workloads. With the proposed solution, it is possible to obtain speedups in line with the number of allocated hosts, while being charged less than the predefined budget.
Keywords Cloud computing·Scheduling heuristics· Resource allocation·Bag-of-tasks
1 Introduction
Grid and cluster infrastructures have become the epitome of computing/network architecture to address lengthy and heavy computational jobs. However, to take advantage of such an infrastructure, a user needs membership or insti-tutional relationship with the organization, possibly virtual, controlling the computing resources. In this scenario, scien-tists or even home users lacking either the resources or the incentives (e.g., occasional needs) to take advantage of such infrastructures, are left without practical and viable options. Another approach available to such users is provided by utility computing infrastructures such as Amazon Elastic Compute Cloud (EC2). They provide basic mechanisms and interfaces for users to create virtual computers.1Thus, oper-ating system, middleware, and job application code is left to
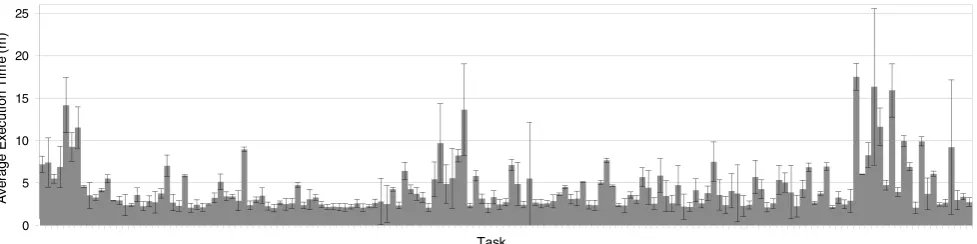
Fig. 1 Average execution time and standard deviation for each task of a software testing BoT job (full week results)
be defined by users, frequently assembled invirtual appli-ances with associated system and disk images. With care-ful setup, clusters of such hosts can be easily created. The creation of such clusters is performed programmatically by means of an Application Programming Interface (API), with the allocation and management of the actual physical re-sources completely hidden from the user. Furthermore, al-lied to easy creation of hosts, utility computing infrastruc-tures employ a simple subscription and payment model, with users required only to pay for the processing time used.
A particularly interesting type of computational jobs is the Bag-of-Tasks (BoT) which are found in several and rele-vant scenarios such as parallel image rendering, data analy-sis, and software testing, among others [6,24,25,31]. Such jobs are CPU intensive and can be split into several tasks, each solving a different slice of the problem space, with no communication required among such tasks (unless to com-municate the result obtained). Thus, this class of jobs can take advantage of hosts by running one (or more tasks) on each one.
To be both efficient and cost-effective, the software in charge of allocating hosts for a BoT job, has to be able to predict their number and instruct their creation to the util-ity computing infrastructure. Naturally, this number varies among jobs and data workloads; determining the optimal number of such hosts must take into account both the time necessary to complete the job, the time taken by each task to run, as well as the minimum time unit subject to payment.
It is important to note that, in such BoT problems, there is no prior knowledge of neither the total job processing time nor the time each task takes to complete. In addition, it is worthy to note that these situations occur often: for example, jobs such as ray tracing, SETI@home, software testing [6], and many others.
For example, consider a software testing BoT job: Fig.1 illustrates a “real-world” scenario running for a whole week (more details in Sect.2). In this case (as is typical in software testing), there are several execution trees, each exploring a possible flow of the software being tested, that run in par-allel on different hosts (each executed by a different task).
The characteristics of such execution trees are not known until they are actually executed [6]. Therefore, finding bal-anced partitions of such execution trees in advance (i.e., be-fore running them) is undecidable. As a matter of fact, not only the subtree size is undecidable, but also the CPU and memory needed to execute it, is unknown a priori. This is the reason why the values presented in Fig.1do not present any pattern and show a large variation of the time taken by each task to execute (solid block lines represent the standard deviation of task executing times).
Therefore, current solutions, such as bin-packing algo-rithms [11] are not adequate to determine the number of hosts to allocate as they require knowing the time taken by all tasks in advance or, at least, of each task sequentially, for each job considered.
The optimal number of hosts for a BoT job allows to ob-tain the best speedup possible within a pre-defined budget. If the execution time of each task is much shorter than the min-imum time unit charged (normally one hour), allocating as many computers as there are tasks, will produce a very low ratio between processing time used and charged. This stems from the fact that only a small fraction of each charged time unit is actually used to perform useful work. On the other hand, in this scenario, in which a large number of hosts is allocated, the maximum possible speedup will be obtained, but this may not be financially feasible (i.e., more money spent than the predefined budget).
– the expected execution time for each task is unknown be-forehand or hard to predict, and
– the unit of charge of virtual computers is much larger in comparison with the execution time that each task re-quires.
Therefore, our goal is to design a solution to this prob-lem by providing the best possible speedup while respecting the predefined budget for a BoT. So, we present an algo-rithm and heuristics capable of dynamically allocating hosts for BoT jobs, maximizing speedups, while ensuring that the cost remains lower than a predefined budget.
For any BoT job, there are two values that define an inter-val within which lies the preferred number of hosts to use, considering the speedup obtained and the predefined bud-get:
– the minimum number of hosts to use; there is no advan-tage on using less than such a value given that the cost to be paid would not decrease accordingly;
– the maximum number of hosts to use; there is no ad-vantage on using more than such a value given that the speedup obtained would not increase accordingly.
Inside this interval, an increase on the number of hosts, with an associated increase on the cost, brings a speedup increase. For a particular BoT job, the lower limit of the interval is obtained dividing the total execution time of all the tasks by the charging unit. The upper limit of the interval is equal to the total number of tasks.
We are convinced that most users are willing to execute their BoT jobs with substantial speedups while within con-strained predefined budgets, instead of paying for the maxi-mum speedup possible. By varying the number of allocated hosts inside the previously mentioned interval, one can get higher or lower speedups, depending on the available bud-get, but guaranteeing that one gets the maximum perfor-mance that value could pay.
Current solutions to the above mentioned problem con-sider users’ estimates of task execution times. However, these are frequently incorrect [21]. In addition, it has been found that proneness to estimation error is higher with less knowledgeable users [18]. Note that such users are those that would benefit most from computing/network infrastructures such as those we are considering (e.g., researchers who are not computer scientists or engineers). If a user estimates fall below the actual task execution time needed, suitable run-time adjustments must be done. However, if estimates are above the tasks execution times required, more hosts than necessary will have been allocated already and no adjust-ment can be done at that moadjust-ment (leading to spending more than the predefined budget).
Our solution is conceptually simple but effective: it is based on automatically predicting the execution time re-quired by each task. Each time a task is completed, its execu-tion time is used to recalculate the number of hosts that must
be used in order to maximize the speedup while respecting the predefined budget. However, several difficulties arise: – how to deal with the unpredictability and (run-time)
vari-ation of tasks execution time,
– the impact of the ordering of task execution on the predic-tion of the number of hosts to allocate,
– how to avoid overallocation of hosts in presence of in-creasingly long-running tasks, and
– deciding if hosts should be kept on running tasks beyond the end of their current charge time unit.
These difficulties are handled by our algorithm and heuristics, thus providing an adequate solution to the prob-lem previously stated, as demonstrated by the evaluation results obtained. A preliminary version of this work was ini-tially presented earlier in [28]. In this paper, we describe real-life scenarios to frame and motivate our proposal, and provide extensive evaluation and analysis through the usage of both synthetic and realistic benchmarks.
The next section addresses the variability of task execu-tion time, presenting a compelling practical example. Sec-tion 3 describes the algorithm and heuristics proposed. In Sect.4, we evaluate our algorithm against traces of both re-alistic and synthetic workloads. Then we describe other so-lutions focusing on why they do not attain our goal while respecting the requirements previously presented. Finally, Sect.6presents some conclusions.
2 Variability of tasks execution time
As previously stated, we propose an algorithm and heuristics suitable for Bag-of-Tasks applications. We assume the num-ber of tasks is on the order of hundreds (or more), requiring several hosts to process them all within an acceptable time interval.
To better illustrate the case of BoT jobs in which the ex-pected execution time for each task is unknown a priori (i.e., before being fully executed), we present a “real-world” soft-ware testing scenario (mentioned in the previous section)2 and two submissions for the Internet Ray Tracing Competi-tion (http://www.irtc.org/).
Figure1 displays, for each task, the average execution time and standard deviation observed during a full week of a software product testing (the OutSystems platform).3The software being tested runs in two computers (hosting a to-tal of 1,480 tasks on each day); from dayN to dayN+1,
2Agile Platform from OutSystems for software development with 1.3 million lines of code (http://www.outsystems.com/).
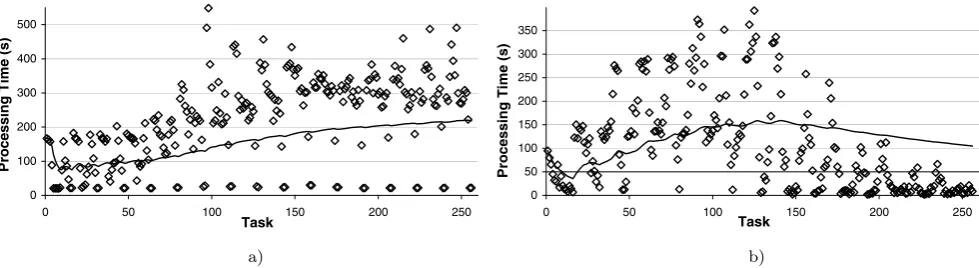
Fig. 2 Time taken by each task in a BoT job for image rendering: (a) image with 2,567 objects, and (b) image with 1,008 objects
the software may suffer modifications to correct bugs that may have been detected on day N. Each task explores an execution tree of the OutSystems platform software.
We can observe the following: (i) the standard deviation of each task execution time may be rather large, (ii) there is no visible pattern that can be used to easily predict the execution time of any task, and (iii) from the set of tasks that have been executed in the past (either on the same day or on past ones) there is no easy way to predict the execution time of the next task (or tasks).4This confirms that the execution time of such tasks is hard to predict as the characteristics of the corresponding execution trees are not known until they are actually executed.
Regarding the two ray tracing BoT jobs, they have dif-ferent levels of complexity (i.e., difdif-ferent number of geo-metric objects): one image has 2,567 objects and the other has 1,008 objects. To evaluate the task execution time pat-terns, we rendered the two images using POV-Ray [25] on a 3.2 GHz Pentium 4 PC. We measured how long each one of the 256 tasks run for each image (each task responsible for rendering a fraction of the image).
Figure 2 presents, for both images, the time each task takes to render the fraction of the image assigned. The solid line shows the average task execution time, taking into ac-count only those tasks that were executed up to that moment. In Fig.2a, we can see that periodically some tasks take about 25 seconds to complete; in Fig.2b, no periodicity is visible. These two examples display different behaviors. In Fig.2a, task execution average time increases slowly and, only when executing the last tasks, the average time reaches its final value. This is due to the fact that the last tasks have a more complex work to perform taking longer to execute. In Fig. 2b, the average value increases until the middle of the computation and then diminishes.
Other images or a different application exhibit a different evolution of the average task execution time. It is this kind of
4Note that similarity in the parameters space explored by different tasks do not necessarily bring similarity in their execution time.
variations on temporal distribution of task completion times that is handled by our algorithm and heuristics (as explained in Sect.3).
Another characteristic of BoT jobs is the amplitude of the variation of tasks executing time. In the examples presented, for the two images considered, this amplitude is about 9 and 7 minutes, respectively (i.e., several times higher than the average time); in other applications, this variation may be much smaller or bigger.
For completeness, similar findings to the ones regarding the BoT ray-tracing jobs could also be drawn regarding jobs comprising the exploration of unbalanced trees [24], an ac-tivity known to defeat static scheduling approaches (such as bin-packing) and requiring continuous load-balancing, due to the highly variable nature of task execution times.
3 Algorithm
We propose an algorithm and heuristics that allow the def-inition of the number of hosts to allocate from a pool of computers, in order to obtain the maximum speedup pos-sible while respecting a predefined budget.
If a user wants to pay the minimum possible, each allo-cated host should execute tasks during the whole duration of the minimum charging unit (one hour, for instance). If too many hosts are allocated, each one will have some idle time that will be charged anyway; if too few hosts are allocated, the job total execution time will increase, with no extra sav-ings.
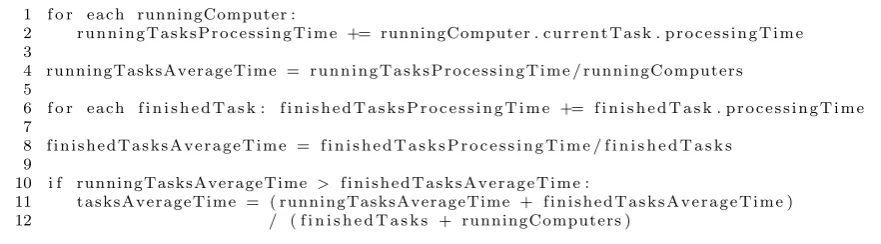
Fig. 3 Pseudocode executed each time a task finishes
from this first approach, the algorithm is then improved suc-cessively by taking into account:
– order of the tasks execution (as it affects the calculated average task execution time),
– preventing hosts overallocation (e.g., when the first tasks to be executed take a long time to complete),
– minimizing the idle time of each host taking into account the unit of charging time, and handling long-running tasks (that may lead to bursts of overestimating the average task execution time).
3.1 Hosts allocation
In order to define how many hosts are needed, it is necessary to know how long a task will take to fully execute. We base our prediction of the time a task takes to execute on the ex-ecution time taken by previous tasks until that moment. So, after knowing the execution time of a few tasks that have completed, we estimate the number of hosts needed, while taking into account the charging time unit and how much the user is willing to pay. This a simple approach that is further refined as explained in the following sections.
When a BoT job is to be executed, the algorithm works as follows. Initially, one host is allocated and starts executing randomly selected tasks. Note that tasks comprised in a BoT are by definition data-independent; the random selection of tasks is to defeat any bias that may exist on their execution time (more details in Sect.3.2).
Whenever a task finishes, the time it took to execute is used to calculate a new value of the average task execution time. Then more hosts are gradually allocated, always taking into account the predefined budget. After allocating more hosts, the execution time of already executed tasks is used to calculate a new value of the average task execution time. Thus, at any instant, with every finished task, the newly cal-culated average task execution time is used to predict the number of hosts needed to conclude the job (while respect-ing the pre-defined budget takrespect-ing into account the chargrespect-ing time unit).
Figure 3 presents the pseudocode of the algorithm that calculates the number of hosts needed, in order to increase
speedups while guaranteeing that charged time on the utility computing infrastructure is lower than the predefined bud-get. This pseudocode is executed whenever a task completes. The code in lines 1–4 calculates the average task execu-tion time based on the time taken by the tasks that have com-pleted so far. This value will later be used to determine the number of hosts needed. In the following lines of code (lines 6–8), for each host, it is predicted how many tasks each one will be able to process until the end of its time charging unit (hostProcessingTimeinterval). Both the remain-ing time each host still has left, and task average execution time, are used in this prediction.
If the user wants to pay the minimum amount possible, every host should run tasks during all its charging unit time. So,hostProcessingTime(lines 10–11) has the same value as the infrastructure charged time unit (e.g., 60 utes). Note that if the user is willing to pay twice the min-imum possible, in a system where the charged time unit is 60 minutes, every host can be idle half of that time (thus, processing tasks only during 30 minutes).
The number of possibly processed tasks ( possible-Tasks, lines 6–8) is then used to find how many tasks cannot be executed by the current hosts (lines 10–11); this is done by dividing the prediction of the remaining tasks execution time by thehostProcessingTime. In other words, the average time previously calculated and the dif-ferenceremainingTasks-possibleTasks are used to infer the number of additional hosts necessary. Note that the additional hosts are not created all at once. The number of additional hosts is corrected with thecreationRatio
factor, as described in Sect.3.3.
3.2 Task selection criteria
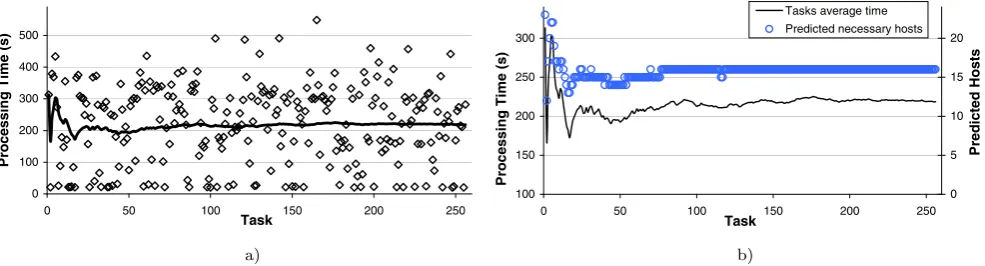
Fig. 4 Random task selection for the image rendering job described in Sect.2with 2,567 objects: (a) execution times observed experimentally, (b) predicted number of hosts using the pseudo-code shown in Fig.3
Fig. 5 Pseudocode executed each time a task finishes (cont.)
would still be allocated, because the previously allocated hosts were not sufficient. However, the number of allocated hosts would be higher than the necessary because the last created ones would be idle after the end of the job. Thus, de-spite the high number of allocated hosts, the job would take longer than required to conclude because, only close to the end, when few tasks remained, some more hosts were added thus increasing the processing power available.
In Fig.2b, we observe a different behavior. At a given instant, the average task execution time is higher than the final value. According to the algorithm previously described, at that moment, more hosts than necessary will be created. In this case, the speedups could be higher than expected but the price to pay would also be higher (possibly above the predefined budget).
The two above scenarios illustrate the problem with the algorithm as it is: if the real task execution average time dif-fers significantly from the value that is calculated at each in-stant, too many or too few hosts may be allocated w.r.t. max-imum speedup possible within a predefined budget. Thus, it is necessary to guarantee a good approximation of the above two values; in other words, the value that is calculated for the average task execution time should be equal to the real value since the beginning of the job, i.e., right after the first completed tasks.
For this, from the beginning, the tasks that are to be ex-ecuted are randomly selected. By randomly selecting tasks, we avoid incurring into a bias on the tasks execution time prediction that could happen by virtue of some job local-ity (e.g., consecutive tasks having similar execution time). Such locality issues do not occur always but, from Fig.1, we can infer that this happens to some extent. Our solution
contributes to make the average task execution time predic-tion to converge more rapidly.
The results presented in Fig.4were obtained for the im-age rendering BoT job described in Sect.2with 2,567 ob-jects (see Fig.2a). Figure4a shows the distribution of task execution time (observed experimentally), when tasks are selected randomly. We can observe that after the execution of 25 tasks, the average task execution time (based on the values observed) is close to the final value.
In Fig.4b, we show the evolution of the predicted number of hosts to be allocated, according to the pseudocode shown in Fig.3; we can observe that this value stabilizes rapidly (approximately after 25 tasks run to completion). However, even with a random task selection, if the execution times of the first tasks of a job to be executed are higher than the final average execution time, as observed in Fig. 4b, too many hosts will be initially created. In this case, when the first task finishes, and the pseudocode of Fig.3 runs, the predicted number of hosts needed to efficiently execute the job is 23. This value is much higher than the final value (16); note that this final value is only calculated after all tasks complete. This problem of hosts overallocation is addressed in the next section.
3.3 Preventing overallocation
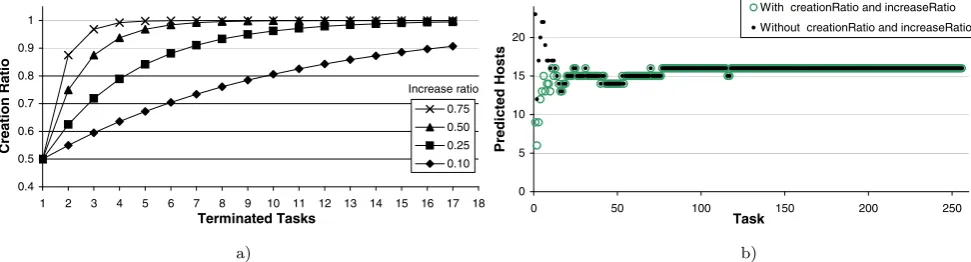
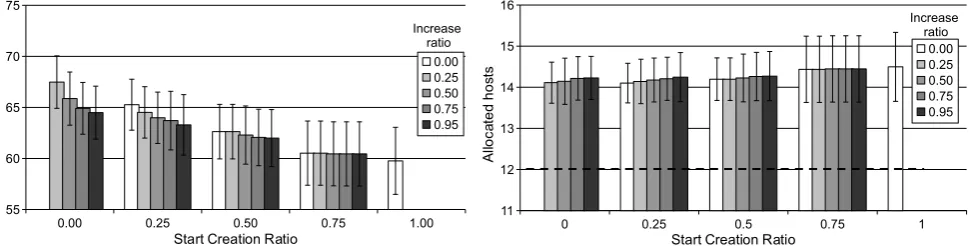
Fig. 6 Impact ofcreationRatioandincreaseRatioon the number of allocated hosts: (a) synthetic values, and (b) when applied to the image rendering job with 2,567 objects already mentioned (pseudocode running is shown in Figs.3and5)
Note that in Fig.5, lines 12–16 are responsible for apply-ing thecreationRatioparameter to the calculated num-ber of new hosts to be allocated (variable necessary-Computers). The value ofcreationRatiois updated whenever a task finishes (line 16).
Initially, i.e., when a job starts, this value is lower than 1 so that the number of initially created hosts is conserva-tively lower than the value based on the average processing time of the tasks that have completed so far. Later, as more tasks run to completion, and the average task execution time converges to the final value, creationRatiomay also converge to 1. Thus, the value of thecreationRatio fac-tor grows as the confidence on the correctness of the average task execution time increases.
The value ofincreaseRatio(line 16 in Fig.5) de-fines how fastcreationRatiochanges. Figure6a shows howcreationRatiovaries for an initial value of 0.5 and severalincreaseRatiovalues. As expected, we observe that for higher values ofincreaseRatiothe number of created hosts grows faster. In other words, w.r.t. the num-ber of hosts to be allocated, the system behaves more ag-gressively for higher values ofincreaseRatioand more conservatively otherwise.
Figure 6b shows, for the case of the image rendering BoT job already mentioned (with 2,567 objects), the effect ofcreationRatiowhen deciding how many new hosts to create at each moment. We can see the curve resulting from the code shown in Fig.3and the curve resulting from the added pseudocode shown in Fig.5(with both variables
creationRatioandincreaseRatio).
We can observe that, when the job starts, the first curve prediction for the number of hosts to be created is 23 (with-out the correction factors of creationRatioand in-creaseRatio). By applying acreationRatioof 0.4, the actual number of new allocated hosts is 9. After about 10 completed tasks, the value ofcreationRatiois 1 (re-sulting from theincreaseRatioeffect). From this point forward, the number of allocated hosts stabilizes close to the final (and optimal) value.
The value ofcreationRatiois used to guarantee that the first predicted number of new hosts to be allocated is not higher than necessary. As this value converges to 1, so does the value of the calculated average of task execution time converges to the final value.
The values of creationRatioand increaseRa-tioare, in fact, the means to heuristically control the be-havior of the algorithm. In other words, they behave as an attenuation factor w.r.t. hosts creation. By setting the initial values ofcreationRatioandincreaseRatio, it is possible for the user to decide if the algorithm has an ag-gressive behavior (i.e., speedup oriented) or follows a more conservative approach (i.e., savings oriented), by creating, in the beginning of the job, more or less hosts. The influ-ence of the initial values of both creationRatioand
increaseRatiois evaluated in Sect.4.
3.4 Adjusting the average execution time
It is worthy to note that, if the algorithm relies only on in-formation gathered when a task ends, and the first processed tasks take too long to complete, it takes a long time before new hosts are created. Thus, periodically, the average pro-cessing time of the executing tasks is calculated, as shown in the pseudocode shown in Fig.7.
This code is periodically executed (every 5 minutes)5on the job coordinator (the host responsible for the coordination of all hosts). As the coordinator holds all the information regarding every host creation times and all running tasks, no extra communication is needed.
This code takes into account the current execution time of the tasks running at that moment. Lines 1–4 in Fig.7 cal-culate the average of the execution time of the currently run-ning tasks (runningTasksAverageTime). If this value is greater than the average execution time of the previously finished tasks (line 10), thetasksAverageTimevariable
Fig. 7 Pseudocode that adjusts the average task execution time; it is executed periodically to take into account the case in which the first tasks to execute are long-running tasks
is updated (lines 11–12). Then the number of new hosts to be created and their creation ratio is calculated as shown in the pseudocode of Figs.3and5.
3.5 Host termination
In order to guarantee that the time each host is running is close to its minimum charging unit, so that wasted time is reduced, every host is terminated just before reaching the minimum charge time (usually one hour). Thus, a running task may be prematurely and abruptly terminated; in this case, that task will be restarted on another host. Obviously, this solution only works if all tasks execution time is much smaller than the charging unit. The following two cases must be considered: (i) the average task execution time is close or higher than the charging unit, and (ii) a long task starts on a host just before it shuts down.
The first case is easily tackled by instructing several hosts to execute multiples of the charging unit (thus, delaying their termination). This way, one host can solve several lengthy tasks, neither wasting idle cycles nor interrupting running tasks.
For a given job, from the number of tasks still pending, the number of hosts running and the average task execu-tion time, the coordinator (the host where tasks are launched from) must decide which host should continue executing af-ter the charged time unit has elapsed, and for how long. All calculations presented so far remain valid. Note that the only value that depends on a host charging time is the number of tasks that it can execute (line 8 on Fig.3); this value is cal-culated taking into account the time interval a host will be running a job’s tasks.
Deciding if a host should be shut down must take into account the following: knowing if the task running on that host should be allowed to terminate or not. When dealing with this issue, it should be taken into account the average task execution time and for how long that particular task has been running. If the task has been running for a short pe-riod of time, no harm comes from restarting it later on an-other host. If the task’s running time surpassed the average
task running time, probably it should be allowed to terminate normally. In this case, the user would pay for more execu-tion time, and use the remaining of the host charging time slice to execute other tasks.
Note that once a task is successfully finished, if the re-maining of the charging time slice is not significantly greater than the average task completion time, the chances of being able to take advantage of this remaining time to complete yet another task are very slim. Nonetheless, no harm comes from starting the execution of a task that either concludes in the available time, or that is terminated and restarted later. This stems from the fact that the whole of the time unit (e.g., an hour) has already been charged; so it always pays off at-tempting to execute a new task in the remaining time, even if there is low probability of it being able to complete. Either solution is still better than wasting the remaining time. Of course, in more aggressive scenarios, allocating a new host for such tasks promotes their earlier completion (and helps to achieve better speedups).
3.6 Handling long-running tasks
Besides the issue of host termination mentioned above, long running tasks raise additional concerns when defining how many hosts to create. As a matter of fact, if too many hosts are created for a BoT job (e.g., the extreme case in which one host is created for each task), hosts running tasks that take less time to complete (when compared to the longest one) will have longer idle times.
To tackle this, after calculating the number of new hosts to be created (i.e., after running the pseudocode shown in Figs.3and5), we perform an additional step: decide if the just calculated number of new hosts will be effectively cre-ated or not. As a result, from this step, no additional hosts may be created. This decision, for a BoT job, is based on the ratio between the total number of tasks of the job and the re-sulting number of hosts (taking into account the calculated value for new ones to be created).
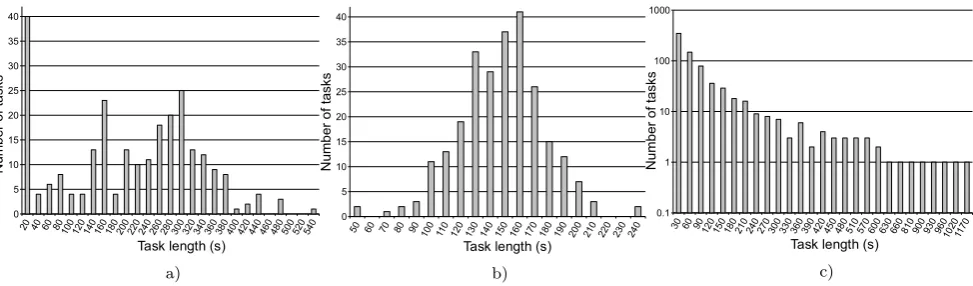
Fig. 8 Tasks processing time distribution for three BoT jobs: (a) real image rendering with 2,567 objects (already described in Sect.2), (b) syn-thetic job set whose tasks processing times have a normal distribution, (c) OutSystems software testing scenario
of tasks, no new hosts are created in fact. Thus, instead of creating more hosts, the running time of the current ones is increased, guaranteeing that the already allocated hosts will execute (at least) twice the charging unit.
This additional adaptation step is continuously applied; it increases the hosts running time when observing that the running time still available (within a charging unit) is not enough for task completion.
4 Evaluation
To evaluate the algorithm and the heuristics described in the previous section, we use three different representative ex-amples of BoT jobs: (i) traces of a real image rendering job with 2,567 geometric objects (already mentioned in Sect.2), (ii) a synthetic job with a set of tasks whose processing times have a normal distribution, and (iii) the OutSystems soft-ware testing job (mentioned in Sect.2). Figure8shows the tasks execution time distribution for these three jobs, i.e., for all the tasks of the corresponding BoT job, the number of tasks that take the same time to complete (note the loga-rithmic scale in the last one). Obviously, these numbers are known only after a job completes.
For these three jobs, we present several results evaluat-ing the effectiveness of the algorithm and heuristics pre-viously described. In particular, we present the impact of bothcreationRatioandincreaseRatioon predict-ing the number of hosts to be created; we also compare this number with the optimal number of hosts that would be cre-ated (only possible to find once a job finishes).
In this evaluation, we tested our algorithm and heuris-tics against 200 different ordering of tasks execution scenar-ios (generated randomly). The image rendering job has 256 tasks (illustrated in Fig.8a), with an average task execution time of 220 seconds and standard deviation of 125 seconds. Regarding the synthetic job (illustrated in Fig. 8b), it has 256 tasks, the average task execution time is 150 seconds
with a standard deviation of 30 seconds. The OutSystems job (Fig.8c) is composed of 1,480 tasks, where half of the tasks have an execution time lower than 30 seconds, and the average execution time is 1 minute. There are few long run-ning tasks with execution times longer than 15 minutes.
For all experiments, the first 5 minutes are spent on creat-ing the virtual machine and launchcreat-ing the operatcreat-ing system and the necessary middleware. This delay renders the usable execution time unit to only 55 minutes (instead of a full 1 h slice); these values are later considered by the heuristic and when making the calculation of the optimal number of hosts. These tests allow us to evaluate the behavior of the al-gorithm and heuristics with jobs comprised of many tasks whose duration is variable, not known in advance and with multiple distributions. The algorithm and heuristics were coded in Python [26], and simulated using the SimPy [29] discrete-event simulator.
4.1 Impact of creationRatio and increaseRatio
Figures 9 to 11 show the total time to complete the jobs previously mentioned and the number of created hosts, for different values of creationRatio and increase-Ratio. Globally, from these graphics, we observe that the algorithm and heuristics previously presented, with a suitable selection ofcreationRatioand increase-Ratioparameters, can predict the number of hosts to cre-ate with a difference between 20% (image rendering) and 35% (OutSystems software testing) w.r.t. the optimal num-ber (18, 12, and 29 indicated by the dashed lines in the al-located hosts graphics in Figs.9,10, and11, respectively). Note that the optimal number of hosts for a job is obtained as follows:6
number_of_tasks∗average_task_execution_time
charging_time_unit .
Fig. 9 Evaluation of the impact ofcreationRatioandincreaseRatioon the job completion time and number of hosts created for the image rendering job (with 2,567 objects)
Fig. 10 Evaluation of the impact ofcreationRatioandincreaseRatioon the job completion time and number of hosts created for the synthetic job with a normal distribution of tasks processing time
It is worthy to note that the above mentioned optimal number of allocated hosts are lower bound values. In order to attain the expected execution times with these number of hosts, it is necessary to schedule all the tasks of each job in such a way that no host has any idle time.
From Figs.9and10we also see that with a creation-Ratioof 1, the standard deviation (solid vertical lines) of both the total job execution time and the number of allocated hosts is higher. As the execution times of the first tasks is used without any correction, these initial values have great impact on the number of allocated hosts. In this case, it is highly probable that the cost of using the number of created hosts exceeds the user’s predefined budget. The reason for that lies in the fact that during job execution, any variation on the average task execution time (and consequent calcu-lated average time) makes the number of created hosts to change rapidly. In other words, the algorithm and heuris-tics respond very rapidly to modifications of the average task execution time. Therefore, a value of creationRa-tiolower than 1 is needed to attenuate the influence of such task execution time variations.
However, note that choosing a too low initial value for
creationRatiodoes not yield good results either: only after too many tasks run to completion, enough hosts are effectively created to run the job’s tasks.
In the case of the OutSystems job (Fig.11), as the ma-jority of the tasks are short termed, it is highly probable that the initial tasks belong to that group. In this case, the cre-ationRatioincreases rapidly, not being possible to ob-serve a distinct difference between the various combinations of both ratios:creationRatioandincreaseRatio.
The influence ofincreaseRatio can be easily ob-served if an initialcreationRatioof 0 is used: higher values ofincreaseRatioreduce the total job execution time while increasing the number of created hosts as well as the standard deviation of both the total job execution time and number of allocated hosts. When using a higher initial
creationRatiovalue, these observations are not so evi-dent but are still present. Thus, the user must decide the val-ues for these two variables according to a more conservative or aggressive posture as described in the next section.
4.2 Speedup and allocated hosts
Fig. 11 Evaluation of the impact ofcreationRatioandincreaseRatioon the job completion time and number of hosts created for the software testing job from OutSystems
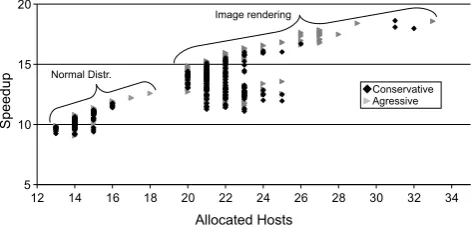
Fig. 12 Speedup evolution with the number of created hosts for two scenarios: conservative (the value of bothcreationRatioand in-creaseRatiois 0.5) and aggressive (the value of both creation-RatioandincreaseRatiois 0.75)
varying number of allocated hosts with two different val-ues ofcreationRatioandincreaseRatio. For rea-sons explained later in this section, w.r.t. the ratio at which new hosts are created, we observe that: When the value of bothcreationRatioandincreaseRatiois 0.5, the system behaves conservatively; when these values are both 0.75, the exhibited behavior is more aggressive.
In both scenarios, conservative and aggressive, the num-ber of created hosts and the speedup do not coincide, but are close. Variations are usually contained within a [46%–61%] interval (see Fig.12); this demonstrates that an aggressive approach does not allocate too many resources, while offer-ing faster execution for a premium.
For example, both conservative and aggressive execu-tions using 13 hosts offer a speedup between 9 and 10. The difference between these values is due to the delay between the start of the job and the final prediction of the exact aver-age task execution time. As this value is found later, i.e., during the job execution, at ulterior instances more hosts need to be allocated to help in reducing the total process-ing time. In this example, the efficiency of the heuristic is about 70% (speedup is 9 for 13 allocated hosts); note that 90% is the possible maximal efficiency taking into account that the charging time unit is only 55 minutes.
It is noticeable that for the same amount of allocated hosts better speedups are attained with an aggressive behav-ior. This is due to the fact that higher values are calculated earlier with the aggressive behavior.
Another difference between the conservative and aggres-sive behaviors is the total number of allocated hosts. When comparing the conservative and the aggressive behaviors, we observe that the first holds a number of created hosts that lies in a narrower interval. The aggressive behavior leads to more hosts being created. In some cases, with an aggressive selection ofcreationRatioandincreaseRatio, the number of created hosts may be close to twice the minimum number of hosts that would deliver an optimal cost per pro-cessing time. The minimum number of allocated hosts and speedup are the same for both behaviors. In all cases, an in-crease on the number of allocated hosts, and cost, is in par with an increase in the speedup obtained.
In conclusion, the user can vary the values of crea-tionRatioandincreaseRatiobetween 0.5 and 0.75, obtaining different variations on the number of created hosts (and charged values), but always with efficiencies higher than 50%.
This difference between the number of allocated hosts and the speedups has two reasons: some hosts are allocated close to the completion of the job, leading to an excess of wasted processing time, or the heuristic maintains them run-ning leading to the charging of an additional charging unit.
4.3 Host termination
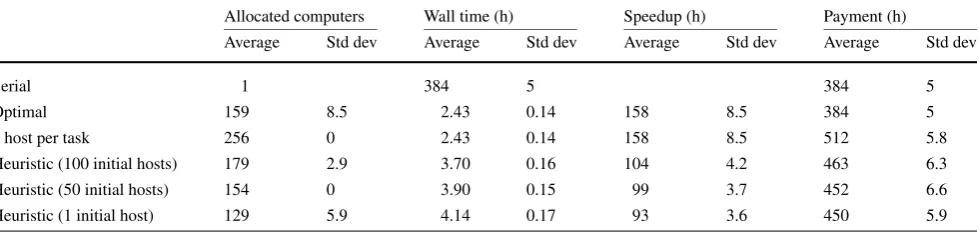
As mentioned in Sect.3.5, a running task may be abruptly interrupted when its host is shut down (just before reaching the minimum charge time). Table1shows how many tasks stop executing in such circumstances, i.e., when the corre-sponding host reaches the limit of the execution charging unit (this happens if the task was running for more than the previously calculated average execution time).
Allocated computers Wall time (h) Speedup (h) Payment (h)
Average Std dev Average Std dev Average Std dev Average Std dev
Serial 1 384 5 384 5
Optimal 159 8.5 2.43 0.14 158 8.5 384 5
1 host per task 256 0 2.43 0.14 158 8.5 512 5.8
Heuristic (100 initial hosts) 179 2.9 3.70 0.16 104 4.2 463 6.3
Heuristic (50 initial hosts) 154 0 3.90 0.15 99 3.7 452 6.6
Heuristic (1 initial host) 129 5.9 4.14 0.17 93 3.6 450 5.9
significant in the case of the image rendering and the Out-Systems jobs: 15% and 20% (3/19 and 8/38), respectively. Since these hosts continue executing (near the completion of the job), their second execution period is mostly wasted. Nonetheless, this feature (not termination of a host) is nec-essary due to jobs with long running tasks.
4.4 Long-running tasks
To evaluate how our algorithm and heuristics handle jobs with long-running tasks, we used a BoT (synthetic) job sim-ulation with a normal distribution of the tasks execution time. We used 200 different ordering of tasks execution sce-narios (generated randomly), for 256 tasks with an average task execution time of 1.5 hours and standard deviation of 20 minutes.
Table2presents the results for five different job execu-tions: three simulations each with 100, 50 and 1 initial hosts, and two extreme cases (optimal and 1 host per task). The second line corresponds to the optimal case scenario, where the job runs for the minimum amount of time with a mini-mum budget. Obviously, this gives us the maximini-mum possi-ble speedup and the minimum possipossi-ble cost. The third line (1 host per task) represents the case where initially one host is created for each task. In this case, the speedup is the best we can obtain, but the cost is the highest, as the hosts re-sponsible for executing the shortest tasks remain idle after finishing their tasks.
The next two lines in Table2show the results of the sim-ulation of our algorithm and heuristics, using the long tasks handling mechanism presented in Sect.3.6, with different numbers of initially created hosts (100 and 50 hosts).
It is worthy to note that the mechanism for handling long-running tasks is very lightweight; however, the results ob-tained are encouraging: when compared to the optimal sce-nario (second line of Table2) the speedup remains high, with the cost being lower than the maximum possible. When us-ing 100 initial hosts, with our algorithm and heuristics, the difference w.r.t. the optimal case is less than 1.5 hours of wall time (2.43 hours and 3.70 hours) for a job that pays for 385 hours.
5 Related work
The allocation of hosts to run BoT jobs solving CPU in-tensive problems, while taking into account the available resources, is a fundamental problem in order to optimize execution time, usage of existing infrastructures and a pre-defined budget. In this context, scheduling algorithms and related heuristics aim at ensuring that requests are handled with a specified quality of service, and the usage of under-lying resources is optimized.
Typically, MPI [20] applications require a fixed predeter-mined number of hosts to cooperate (in order to solve a BoT job); this simplifies the scheduling algorithms (when com-pared to other scenarios). Ingang scheduling, only one task is executing on each allocated host, while incoscheduling
different tasks execute simultaneously on a host. Some hy-brid techniques such as presented by Bouteiller et al. [5] try to conciliate the best of the these approaches.
their architecture, the operating system and the maximum duration of each task. In order to reduce the timespan of tasks running in parallel, grid schedulers employ heuristics that try to take into account the expected task duration as well as the speed and availability of the selected hosts [9].
The family of algorithms addressing the bin-packing (and related knapsack) problem [11] (including one-dimensional, two-dimensional, three-dimensional and multi-dimensional variants) is a very popular approach to perform resource allocation (traditionally: space, area, volume, cost, weight in freighting trucks, storage areas, or disk usage and pro-cess scheduling), when it is known beforehand both the re-quired resources for each item (i.e., its size, area, weight, cost, file/block size, CPU slot required) and the available re-sources in each packing unit (e.g., total space and weight ca-pacity, budget, disk sizes, processor time slices). With both these variables known, bin-packing, which is known to be NP-hard, in its several alternative strategies (fit, first-fit-decreasing, next-first-fit-decreasing, etc.), can produce a mix of optimality (resource usage) and efficiency (time to deter-mine the distribution of items across bins).
However, bin-packing usually requires a priori know-ledge regarding the resource requirements of all the indi-vidual items’ size (e.g., its size, weight, cost, and most rele-vant in our case, execution time) to achieve this optimality, usually to perform some form of preliminary sorting. As de-scribed in Sect.2that is clearly not the case with scheduling real word BoT jobs. Not even a less restrictive version of bin-packing, online bin-packing [12] (that requires knowl-edge of each item’s size, only when it is next in line to be packed, being more efficient but less optimal), would suit our scenario. Therefore, we need an approach based on an algorithm and heuristics that do not require a priori knowl-edge of each task’s execution time but, are nonetheless, able to draw information from the tasks already executed and adapt the scheduling strategy accordingly.
Current cycle-sharing systems, such as BOINC [3], use a greedy approach to allocate hosts to tasks: all available hosts are used to solve part of a job. BOINC clients participate on the selection of tasks to be executed [2]. The BOINC client is responsible for guaranteeing an even distribution of work among different projects for which the user is donating pro-cessing cycles. The user states how much of his computer idle time to give to the different projects. Once a task is com-pleted, and there is still idle time to use, the BOINC client contacts different servers to retrieve more tasks to execute. Some improvements have been made in the algorithms, such as in CCOF [32], in order to take into account the processing characteristics (among others) of the hosts to be used.
Transparent Allocation Strategy [22] allows the alloca-tion of hosts taking into account the number of requested processors (p) and the duration (t r) of each task. Small val-ues ofpandt r allow a better fit of the requests to the
pro-cessing resources available, while larger values oft r accom-modates a wider range of tasks. When hosts that were being used to execute the tasks of the BoT are needed to run higher priority jobs, tasks allocated using Transparent Allocation Strategy are killed to free resources. Later, these tasks can be restarted on other available hosts.
The correct prediction of the above mentionedpandt r values lead to another strategy being proposed: The Explicit Allocation Strategy [27] presents an adaptive heuristic al-lowing, during the execution of the BoT, the definition of bothpandt r for each request, using information gathered by a space-shared resource scheduler. This heuristic takes into account free time slots available on (the cluster of) hosts and the estimated task duration time to request a certain number of hosts. If the tasks included in such a request are successfully executed, the execution time of the longest task will be used in subsequent requests; if the requested time is not enough, the estimated task execution time will be mul-tiplied by an integer factor. Even though some prediction is performed w.r.t. task execution time, this solution tries nei-ther to obtain average task execution times, nor to reduce the unused idle time by the requests.
Existing utility computing infrastructures (e.g. Ama-zon EC2 [1], Enomalism [13], or Eucalyptus [23]) provide means for the management of pools of computers, via de-ployment and execution of virtual machines. Such virtual machines are created from disk images containing an operat-ing system and the needed applications. Images are provided by the users, employing an API to launch and terminate the various instances of such hosts.
In current available utility computing infrastructures, re-source allocation and scheduling details are taken care at a low level. Thus, when a user creates a virtual machine, the software is responsible for assigning a physical computer that can deliver the contracted quality of service. There is no need for the user to know the total execution time for each virtual machine beforehand, as it is only used, after ter-mination, to calculate the amount to charge. Furthermore, in commercial infrastructures, the charged time unit is large, usually one hour, which requires guarantees that machines are idle for a minimum amount of time.
The notion of computing clouds [15] providing virtual clusters has emerged as a natural step for designers of Grid infrastructures. In [16], a number of previously configured Xen [4]-based virtual machines, communicating via MPI, together with information regarding resource (CPU, mem-ory) description and management, are considered as an ag-gregate virtual workspace. Complete agag-gregate workspaces are the basic unit of scheduling. Workspace deployment re-sorts to Globus Toolkit services when enough resources are available to schedule a given workspace.
nology w.r.t. native execution, the ability to suspend VMs allows better overall performance (shorter total execution time and job delays) and system utilization, when com-pared to Grid-based schedulers without preemption. In the case of preemptive Grid schedulers, performance is only slightly worse compensated by greater flexibility and porta-bility (neither need to modify OS, nor code targeting check-pointing libraries).
Computing clouds have become more and more used to solve e-science problems, such as scheduling workflows of astronomy applications [17] comprised of large numbers of small tasks. This approach was compared, with encourag-ing results regardencourag-ing virtual clusters, in different environ-ments: combinations of virtual machines and virtual clusters deployed on the Nimbus science cloud vs. a single local ma-chine and a local Grid-based cluster. In Hill’s work [14], the calculations of MPI-driven ocean climate models are performed on Amazon EC2 using 12 processes, each one running on a virtual machine inside a virtual cluster. They study the cost-effectiveness of the two main classes of ar-chitectures provided by EC2 w.r.t. this type of applications (m1-standard, i.e., single-core andc1-high-cpu, i.e., multi-core virtualOpteron/Xeon processors). They have similar price-performance ratio even though the claims of almost five-fold performance increase in c1-high-cpu are not met experimentally. The authors conclude that it is feasible to run such applications on EC2, despite significant overhead penalties regarding bandwidth and latency of memory and I/O. A virtual cluster created on-demand can perform on par with low-cost cluster systems, but comparatively with high-end supercomputers, performance is much lower.
Job scheduling can also be driven by utility functions fol-lowing an economic or market-driven model [7,8,10,19]. These systems employ an utility function to analytically op-timize system throughput while fulfilling user requirements. They can also make use of pricing models that are auction-based to achieve supply-demand equilibrium.
In summary, taking into account existing solutions (as described above) we can say that current scheduling ap-proaches, regardlessly of targeting cluster, grid, or cloud computing scenarios, do not provide a satisfactory solution to our goal: optimizing the number of hosts to allocate (in such utility computing infrastructures) taking into account a predefined budget. Most of the current solutions do not take into account hard currency paid for the computing power
cution which will not bring any savings. Finally, such ap-proaches consider only a fixed (pre-configured or precalcu-lated) number of participating hosts, unable to dynamically adapt the computing power engaged. This is rather inflexi-ble and, therefore, unsuitainflexi-ble for many proinflexi-blems where task completion times are variable and unknown beforehand.
6 Conclusion
With utility computing infrastructures, hosts can be easily created on demand to execute jobs comprised of indepen-dent tasks. Only after the completion of all tasks, the user will be charged for the time each host ran.
The algorithm and heuristics presented in this paper effi-ciently determine the number of hosts to allocate on such a computing infrastructure, when used to solve Bag-of-Tasks jobs, whose tasks execution times are not known before their execution.
For jobs with short termed tasks, the results show that our algorithm and heuristics determines the number of hosts needed to guarantee that the charged time is close to the de-sired value. The number of allocated hosts is close to the value that would be found if the user knew for how long each task would execute; the speedup accomplished is close to the number of allocated hosts, therefore, achieving cost-efficiency.
Furthermore, our algorithm and heuristics can provide distinct parameterizable behaviors: (i) a conservative one, where the charged values are lower, and (ii) a more aggres-sive one, where the speedups are higher, with a proportional increase on the cost. The user can select within the spectrum of these two behaviors, by varying both the creation-Ratioand theincreaseRatioparameter. This enables either reducing the charged time (with longer job processing time) or reducing the job processing time with an increase in cost.
The algorithm and heuristics are also able to handle jobs with long-running tasks. The speedups obtained remain high, while guaranteeing a lower cost when compared to a case in which one host per task is allocated.
In the future, we intend to further study the task execution time distributions of other jobs, and design a formal model forhosts creation overshooting(i.e., bursts of hosts creation) for users willing to pay more for higher speedups without compromising cost-efficiency.
Acknowledgements We thank OutSystems for providing us with relevant “real-world” data for evaluation purposes. This work was partially funded by FCT projects PTDC/EIA-EIA/113993/2009 and PTDC/EIA-EIA/102250/2008, and by PIDDAC Program funds (INESC-ID multiannual funding).
References
1. Amazon Web Services LLC (2011) Amazon elastic compute cloud (amazon ec2).http://aws.amazon.com/ec2
2. Anderson DP (2007) Local scheduling for volunteer computing. In: IEEE international parallel and distributed processing sympo-sium, IPDPS 2007, 26–30 March 2007, pp 1–8
3. Anderson DP, Fedak G (2006) The computational and storage po-tential of volunteer computing. In: IEEE/ACM international sym-posium on cluster computing and the grid
4. Barham P, Dragovic B, Fraser K, Hand S, Harris TL, Ho A, Neugebauer R, Pratt I, Warfield A (2003) Xen and the art of vir-tualization. In: Scott ML, Peterson LL (eds) SOSP. ACM, New York, pp 164–177
5. Bouteiller A, Bouziane HL, Hérault T, Lemarinier P, Cappello F (2006) Hybrid preemptive scheduling of mpi applications on the grids. Int J High Perform Comput Appl 20:77–90. Special issue 6. Bucur S, Ureche V, Zamfir C, Candea G (2011) Parallel symbolic
execution for automated real-world software testing. In: Proceed-ings of the sixth conference on computer systems, EuroSys’11. ACM, New York, pp 183–198. http://doi.acm.org/10.1145/ 1966445.1966463
7. Buyya R, Abramson D, Giddy J, Stockinger H (2002) Economic models for resource management and scheduling in grid comput-ing. Concurr Comput, Pract Exp 14(13–15):1507–1542
8. Buyya R, Abramson D, Venugopal S (2005) The grid economy. Proc IEEE 93(3):698–714
9. Casanova H, Legrand A, Zagorodnov D, Berman F (2000) Heuris-tics for scheduling parameter sweep applications in grid environ-ments. In: Proceedings 9th heterogeneous computing workshop, HCW 2000, pp 349–363
10. Chunlin L, Layuan L (2006) QoS based resource scheduling by computational economy in computational grid. Inf Process Lett 98(3):119–126
11. Coffman E Jr, Garey M, Johnson D (1978) An application of bin-packing to multiprocessor scheduling. SIAM J Comput 7:1 12. Csirik J, Woeginger GJ (2002) Resource augmentation for online
bounded space bin packing. J Algorithms 44(2):308–320 13. Enomaly Inc (2008) Enomaly: Elastic computing. http://
enomalism.com
14. Evangelinos C, Hill CN (2008) Cloud computing for paral-lel scientific hpc applications: feasibility of running coupled atmosphere-ocean climate models on amazon’s ec2. In: Pro-ceedings of cloud computing and its applications.http://www. cca08.org
15. Figueiredo R, Dinda P, Fortes J (2003) A case for grid com-puting on virtual machines. In: Proceedings 23rd international conference on distributed computing systems, pp 550–559. doi:10.1109/ICDCS.2003.1203506
16. Foster IT, Freeman T, Keahey K, Scheftner D, Sotomayor B, Zhang X (2006) Virtual clusters for grid communities. In: CC-GRID. IEEE Computer Society, Los Alamitos, pp 513–520 17. Hoffa C, Mehta G, Freeman T, Deelman E, Keahey K,
Berri-man B, Good J (2008) On the use of cloud computing for sci-entific workflows. In: IEEE international conference on eScience, vol 0, pp 640–645. http://doi.ieeecomputersociety.org/10.1109/ eScience.2008.167
18. Lee CB, Schwartzman Y, Hardy J, Snavely A (2005) Are user run-time estimates inherently inaccurate? In: Job scheduling strategies for parallel processing, 10th international workshop, JSSPP 2004. Springer, Berlin
19. Li C, Li L (2007) Utility-based QoS optimisation strategy for multi-criteria scheduling on the grid. J Parallel Distrib Comput 67(2):142–153
20. Message Passing Interface Forum (1994) MPI: a message-passing interface standard. Tech rep, University of Tennessee, Knoxville, TN, USA
21. Mu’alem AW, Feitelson DG (2001) Utilization predictability, workloads, and user runtime estimates in scheduling the ibm sp2 with backfilling. IEEE Trans Parallel Distrib Syst 12(6):529–543 22. Netto M, Calheiros R, Silva R, De Rose C, Northfleet C, Cirne W
(2005) Transparent resource allocation to exploit idle cluster nodes in computational grids. In: First international conference on e-science and grid computing
23. Nurmi D, Wolski R, Grzegorczyk C, Obertelli G, Soman S, Yous-eff L, Zagorodnov D (2008) The eucalyptus open-source cloud-computing system. In: Proceedings of cloud cloud-computing and its applications.http://www.cca08.org
24. Olivier S, Huan J, Liu J, Prins J, Dinan J, Sadayappan P, Tseng CW (2007) Uts: an unbalanced tree search benchmark. In: Almási G, Cascaval C, Wu P (eds) Languages and compilers for parallel computing. Lecture notes in computer science, vol 4382. Springer, Berlin, pp 235–250. doi:10.1007/978-3-540-72521-3-18 25. Persistence of Vision Raytracer Pty Ltd (2008) Persistence of
vi-sion raytracer.http://www.povray.org/
26. Python Software Foundation (2008) Python programming lan-guage.http://python.org/
27. Rose CAFD, Ferreto T, Calheiros RN, Cirne W, Costa LB, Fireman D (2008) Allocation strategies for utilization of space-shared resources in bag of tasks grids. Future Gener Comput Syst 24(5):331–341
28. Silva JN, Veiga L, Ferreira P (2008) Heuristic for resources al-location on utility computing infrastructures. In: Proceedings of the 6th international workshop on Middleware for grid comput-ing, MGC’08. ACM, New York, pp 9:1–9:6.http://doi.acm.org/ 10.1145/1462704.1462713
29. SimPy Developer Team: Simpy homepage (2009)http://simpy. sourceforge.net/
30. Sotomayor B, Keahey K, Foster IT (2008) Combining batch exe-cution and leasing using virtual machines. In: Parashar M, Schwan K, Weissman JB, Laforenza D (eds) HPDC. ACM, New York, pp 87–96
31. Viale E (2010) Yasrt—yet another simple raytracer.http://www. yasrt.org/