R E V I E W A R T I C L E
Open Access
The challenges of diagnosing osteoporosis
and the limitations of currently available
tools
Palak Choksi
1, Karl J. Jepsen
2and Gregory A. Clines
1,3*Abstract
Dual-energy X-ray absorptiometry (DXA) was the first imaging tool widely utilized by clinicians to assess fracture risk, especially in postmenopausal women. The development of DXA nearly coincided with the availability of effective osteoporosis medications. Although osteoporosis in adults is diagnosed based on a T-score equal to or below−2.5 SD, most individuals who sustain fragility fractures are above this arbitrary cutoff. This incongruity poses a challenge to clinicians to identify patients who may benefit from osteoporosis treatments. DXA scanners generate 2 dimensional images of complex 3 dimensional structures, and report bone density as the quotient of the bone mineral content divided by the bone area. An obvious pitfall of this method is that a larger bone will convey superior strength, but may in fact have the same bone density as a smaller bone. Other imaging modalities are available such as peripheral quantitative CT, but are largely research tools. Current osteoporosis medications increase bone density and reduce fracture risk but the mechanisms of these actions vary. Anti-resorptive medications (bisphosphonates and denosumab) primarily increase endocortical bone by bolstering mineralization of endosteal resorption pits and thereby increase cortical thickness and reduce cortical porosity. Anabolic medications (teriparatide and abaloparatide) increase the periosteal and endosteal perimeters without large changes in cortical thickness resulting in a larger more structurally sound bone. Because of the differences in the mechanisms of the various drugs, there are likely benefits of selecting a treatment based on a patient’s unique bone structure and pattern of bone loss. This review retreats to basic principles in order to advance clinical management of fragility fractures by examining how skeletal biomechanics, size, shape, and ultra-structural properties are the ultimate predictors of bone strength. Accurate measurement of these skeletal parameters through the development of better imaging scanners is critical to advancing fracture risk assessment and informing clinicians on the best treatment strategy. With this information, a“treat to target”approach could be employed to tailor current and future therapies to each patient’s unique skeletal characteristics.
Keywords:Osteoporosis, Dual X-ray absorptiometry, Peripheral quantitative computed tomography, Skeletal fracture, Skeletal biomechanics, Bisphosphonates, Denosumab, Teriparatide, Romosozumab
Background
Two million osteoporosis fractures occur in the U.S. each year costing approximately $19 billion [1]. Despite the medical and economic costs of fragility fractures, osteoporosis screening is often overlooked and viewed as a low priority. Dual-energy X-ray absorptiometry (DXA)
was introduced in the mid-1980s as a rapid and safe im-aging modality to estimate bone mineral density (BMD) and predict skeletal fracture risk [2]. Up until the wide-spread use of DXA, patients at high fracture risk were not easily identified and effective osteoporosis medica-tions were limited. Today, not only are DXA scanners utilized in hospital radiology departments but they are also found at many physician group outpatient clinical practices.
The World Health Organization (WHO) defines osteoporosis as a BMD T-score of −2.5 or lower at any one location or having a previous fragility fracture. The * Correspondence:clines@med.umich.edu
1
Division of Metabolism, Endocrinology & Diabetes, Department of Internal Medicine, University of Michigan, Ann Arbor, MI, USA
3Endocrinology Section, Ann Arbor VA Medical Center, 2215 Fuller Road,
Research 151, Ann Arbor, MI 48105-2399, USA
Full list of author information is available at the end of the article
rationale for choosing this T-score was that the propor-tion of postmenopausal women with a T-score less than −2.5 is equal to the fragility fracture lifetime risk of 30% [3]. It was expected that individuals who were below this T-score would have a greater fracture risk. Further, this cutoff value of −2.5 was expected to change over time as the accumulation of experience and data would pro-vide insight into a more appropriate cutoff value. How-ever, this cutoff value has not changed in over 25 years despite data indicating that the T-score of−2.5 captures only approximately 50% of women with fragility frac-tures [4]. There is less consensus of the definition of osteoporosis in men. The WHO, however, recommends similar T-score thresholds in men who are greater or equal to 50 years of age [5]. Because of a larger skeletal structure, fracture risk for men is less than in women for any similar T-score; and the fracture risk in men is less than half of women starting at age 55 [6]. Even though fracture rates are less than in men, the mortality associ-ated with fractures is significantly higher [7,8].
Thus, individuals with a T-score below the−2.5 cutoff may be at higher risk of fracturing but they do not ac-count for the majority of fracture cases in either women or men [9, 10]. While one of the challenges in manage-ment is to avoid over-treatmanage-ment, individuals with T-scores above −2.5 with other risks for fracture deserve attention, and should qualify for appropriate treatment as well.
Other commonly used methods to predict fracture risk such as the FRAX scoring system, trabecular bone score and bone turnover markers may provide an incremental improvement in risk assessment when combined with DXA. Ultimately, skeletal biomechan-ics that include size, shape and bone molecular
structure are the predictors of bone strength. Under-standing how each of these variables affects the skel-eton is critical in the development of better fracture prediction tools to accurately identify those at a high risk for fractures.
Bone biomechanics
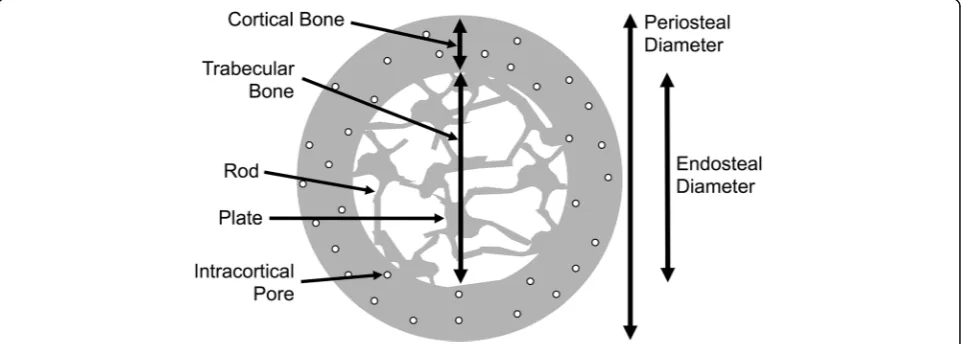
The adult skeleton is composed of 206 uniquely shaped structures, each of which coordinately adapts its morph-ology and tissue-level material properties to support the physiological loads encountered during daily activities. Cortical bone is the dense outer shell that is divided into three surfaces: the periosteum, intracortical pores, and endosteum (Fig. 1). Trabecular bone is surrounded by cortical bone and is comprised of a spongy network of connected plates and rods. To remain strong but light, the system uses cortical bone in the diaphyses and tra-becular bone surrounded by a relatively thin cortical shell in the metaphyseal regions. The proportion of cortical and trabecular bone varies depending on the lo-cation. For example, the ultradistal radius is approxi-mately 25% cortical and 75% trabecular bone. The 1/3 proximal radius is primarily all cortical bone.
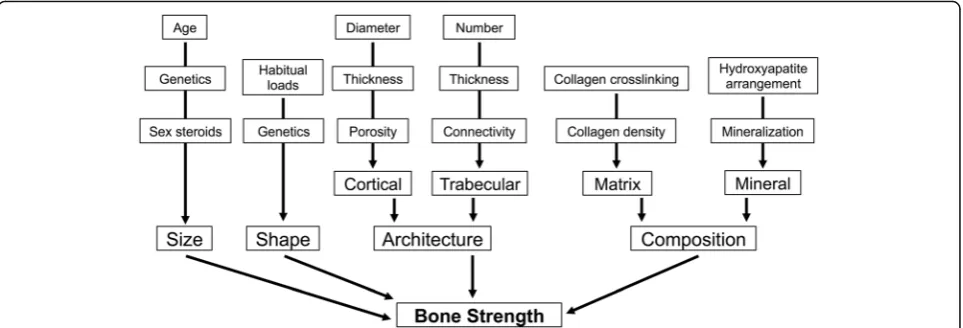
The determinants of bone strength are complex but can be divided into four basic components: size, shape, architecture and composition (Fig.2). Bone has a unique ability to coordinately adjust these traits. This results in a structure that is sufficiently stiff to resist habitual loads but minimizes mass, keeping the overall energy of move-ment to a minimum. The overall strength of a bone de-pends on the proportion of cortical and trabecular tissues, their morphologies and their material properties, and the interactions among these traits. An individual’s unique genetic program also contributes to bone
strength; it is estimated that up to 70% of ultimate bone strength and structure is genetically determined [11].
Bone size
The pubertal transition is the critical period in which bone size is ultimately determined. Under the influence of androgens, the periosteum undergoes expansion resulting in a greater bone cross-sectional area [12]. Endosteal resorption occurs simultaneously but not at the rate of periosteal apposition. The end result is a lar-ger bone and thicker cortex. Estrogens also direct an in-crease in periosteal expansion but not to the degree of androgens. Women generally also have less endosteal bone resorption ultimately leading to a larger bone, al-though smaller than in men, but the strength is main-tained and compensated by a relatively thicker cortex compared to men. Overall, the relatively smaller bone size in women translates to an increased risk for fracture.
Bone shape
Each of the 206 bones is generally well adapted to resist their habitual loads. This process, called functional adap-tation, occurs primarily during growth and results in a biological system that is robust to the relatively narrow range of daily loads. Habitual loading is an important contributor to bone modeling and remodeling, and ul-timately bone shape. Bone surfaces that experience the greatest compressive or tensile loads respond with in-creased bone mass. Conversely, skeletal unloading leads to increased bone resorption and bone loss. Daily activ-ities result in a load (force) being applied to the bones of
the skeleton, whether weight bearing or non-weight bearing. These loads cause the bone to deform with the amount of deformation being dependent on the applied load and the stiffness of the structure. A stiff structure will deform less than a compliant structure under the same load. These loads are generally small enough that the system returns to its original state when the load is removed.
Because bone is well adapted to these habitual loads, this process may leave the bone vulnerable or weak to loads applied in a different direction, such as during a fall. For example, the proximal femur is extremely strong when loaded in a direction consistent with habitual forces. A healthy femur can withstand nearly 8 kN (~ 1800 pounds) before breaking, and so theoretically two femurs should be able to support the weight of an average car. However, the strength of the proximal femur declines by more than 50% when loaded in a direction consistent with that seen during a fall to the side [13]. The mass and material properties are the same regardless of the loading direction, but the orientation of these traits relative to the two loading directions differs greatly. Under a fall-to-the-side loading direction, it is the amount of bone mass remaining within the femur that represents the resistance to fracturing.
Bone architecture
Bone architecture, the trabecular arrangement combined with cortical bone thickness and porosity, provides a scaffold that is significantly stronger than an equal mass of solid bone. The trabecular bone scaffold within the marrow space is composed of plates and rods (Fig. 1)
with a higher plate:rod ratio conferring strength. With aging, plates become more rod-like and plate connectiv-ity with the rods declines, all of which contributes to lower bone strength and stiffness.
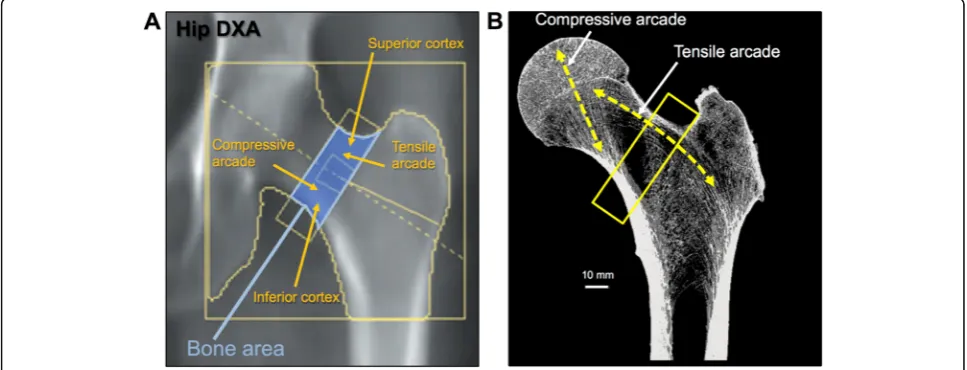
The arrangement of trabecular bone is strategic to provide maximal strength. This is especially evident in the femoral neck [14,15]. The ability of the inferior cor-tex and compressive arcade to resist compressive loads, combined with the superior cortex and tensile arcade to resist tensile loads provides maximal strength and flexi-bility (Fig. 3). Failure of this cooperative network is the reason for femoral neck fractures. Thus, efforts to maintain strength by applying more or greater loads to stimulate bone formation may make the bone stronger for daily loads. Unfortunately, upon losing appreciable bone mass in the femur (e.g., tensile arcade), it remains unclear whether an exercise program will be able to restore lost tissue.
Cortical porosity is another layer that defines cortical strength independent of cortical size. Heightened osteo-clast resorption expand existing Haversian canals, creat-ing large macro-pores and leadcreat-ing to the progressive thinning of the cortical tissue that is capable of bearing load. With age, pore volume increases but pore number remains relatively constant [16]. It is mechanically for-tuitous that the resorptive process begins near the endo-cortical surface. The proximate location of these macropores minimizes the impact on bone strength compared to pores created closer to the periosteal surface [17–19]. Despite this biomechanically favorable location of bone loss, cortical porosity is a strong predictor of frac-ture especially in the cortical rich area of the forearm [20].
Osteoclast resorption and resultant porosity of the tra-becular bone surface also contributes to bone fragility.
Bone composition
Bone quality was originally defined as the factors contributing to strength that are not explained by BMD. From a clinical perspective, this definition provides a name to unexplained factors. From an engineering perspective, this definition makes little sense as it does not provide a definable biomechanical pathway linking strength to physical bone traits and ultimately to the underlying biology [21]. The composition of bone that contributes to bone quality—the regular arrangement of collagen, the degree of crosslinking of adjacent collagen fibrils and mineral to protein matrix ratio—all contribute to bone quality. Diseases such as Paget’s disease, diabetes mellitus, and osteogenesis imperfecta and long-term use of glucocorticoids contribute to poor bone quality. Another example of decreased bone quality are stress fractures that occur due to repetitive damage. High bone turnover is also another component that leads to poor bone quality. Bone turnover markers have been reported to be predictive of fracture risk that is independent of BMD [22–24]. Clinical tests to assess bone quality are currently being developed but are not available for rou-tine clinical use.
Skeletal biomechanical changes with puberty and aging Net bone loss or formation is dependent on the balance between bone resorption and bone formation. The net bone formation of skeletal “modeling” of childhood
ensures structural support during the critical growth period. Before puberty, skeletal development is nearly identical in boys and girls. New bone formation on the periosteum exceeds endosteal bone breakdown resulting in skeletal expansion. Trabecular bone continues to de-velop in this period. Until the period of peak bone mass at 30-40 years of age in men and women, total skeletal bone formation is greater than resorption. With aging, and especially at menopause, this balance tips toward re-sorption and bone loss. After the period of peak bone mass, men and women lose similar amounts of cortical bone by endosteal resorption, but men have greater peri-osteal apposition than women, so that in men, net bone loss is less. Both sexes experience trabecular bone loss with aging, but this effect is more pronounced in women than in men. The decline in estrogen at menopause motes loss of trabecular connectivity and exerts a pro-found impact on bone strength [25].
Tools currently available to assess fracture risk DXA
Despite its underappreciated limitations, DXA is often considered to be the gold standard imaging test for diag-nosing osteoporosis. Unlike older DXA machines that employed higher radiation, today’s scanners emit signifi-cantly less radiation per scan—as little as 1-10 microsie-verts (μSv) with about 7 μSv being the average ionizing radiation dose received from natural background radi-ation [26]. DXA is widely available in hospital and out-patient practices. By utilizing two different energies this technology is able to differentiate the mineralized bone, composed of hydroxyapatite, from soft tissues such as skin, fat and muscle. The two X-ray energies differ in their attenuation profiles after passing through bone and soft tissues. Older DXA units employed a pencil beam that had a limited scan area resulting in longer scan times. Modern DXA units use a fan-shaped beam that translates to scan times of 10-30 s. Standard DXA scans report bone density in grams/cm2 and is derived from dividing the bone mineral content (BMC) in grams by the region of interest (ROI) scanned in cm2.
The standard locations for DXA measurement are the L1-L4 lumbar spine, hip, and forearm. These reference locations were originally selected because morbidity from fractures at these locations is high, especially at the spine and hip. DXA results are reported as the standard deviation (SD) from a population mean, comparing the subject to a population at peak bone mass (T-score) and to an age-matched population (Z-score). One and two SDs from the mean encompass 68 and 95% of a popula-tion, respectively. Since peak bone mass occurs at be-tween 30 and 40 years of age, it is appropriate to use Z-scores in children and young adults who have yet to achieve peak bone mass.
The distribution of bone density across a population is dependent on race, age and gender. For example, African-Americans have lower rates of fracture com-pared to US Caucasians and Asians and this parallels the population distribution differences among races [27]. In one study, the age-adjusted mean for femoral neck BMD was 0.686 g/cm2 in US Caucasians and 0.841 g/cm2 in African Americans [28]. Because of such racial and eth-nic differences, the significance of T-scores must be con-sidered based on the fracture risk of ethnic and racially matched persons. A similar rationale can be applied to men who have larger skeletal structures compared to women. To control for racial differences, DXA calculates T-scores using normative databases based on NHANES III data that include non-Hispanic White, Black, His-panic and Asian individuals [29]. A pediatric normative base is also available.
As stated before, bone size is directly related to strength. DXA does not account for bone size in asses-sing fracture risk. Attempts to correct bone size for height and weight have been reported [30]. Some DXA manufacturers allow for weight correction in the calcula-tion of Z-scores to adjust for an expected decrease in fracture risk as weight increases. Height correction is especially important in assessing fracture risk in children affected by short stature or growth delay [31].
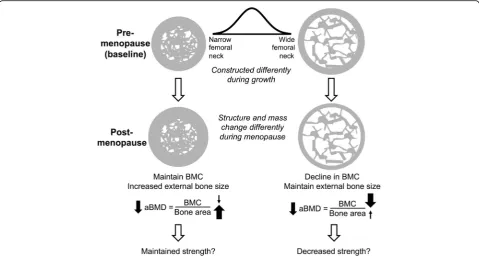
DXA images are a 2-dimensional (vertical and hori-zontal) condensation of a 3-dimensional structure. As such, bone thickness is not measured in this scan. The BMC measured reflects the amount of cortical and trabecular tissue present within a structure that acts to attenuate the X-ray signal; bones with more tissue attenuate the signal to a greater degree resulting in a higher gray value and BMC measure. Bone area is a measure of the size of the ROI. For the hip, the ROI width is fixed and thus variation in bone area reflects differences in external bone size. The ratio of these two variables provides a measure of the mass density but not a measure of morphology or material properties. Further, BMD does not differentiate whether the variation in BMD arises from differences in cortical mass, trabecular mass, or external bone size.
the larger increase in the denominator (area) in women with narrow femoral necks is similarly matched by the lar-ger decrease in the numerator (BMC) in women with wide femoral necks, the result is that both groups have similar losses in BMD over time but for very different reasons. The impact of these structural and mass changes on strength is currently under investigation. In addition to the previous discussion regarding how most fragility frac-tures occur in persons with T-scores >−2.5, this example illustrates another limitation of DXA scanning to accur-ately predict bone strength and fracture risk.
Trabecular bone score (TBS)
Other than BMD, fracture risk is dependent on bone geometry, microarchitecture, microdamage, rate of bone turnover, and mineralization—all of which contribute to bone strength. TBS indirectly assesses skeletal texture using DXA images and can be used to predict the risk of spine and hip fractures in women and men above the age of 40. It has been validated in multiple cohorts with large numbers of subjects and shown to improve frac-ture risk prediction beyond that obtained by DXA. TBS is available for clinical use in the United States [33].
The TBS is a textural index based on evaluating the pixel gray-level variations in the lumbar DXA image [34]. Well-structured bone produces 2-D DXA images
that are homogenous with small gray-value amplitude variations. On the other hand, bone that is of poor qual-ity produces higher gray-value amplitudes. TBS is a unit-less calculation of the sum of the squared gray-level differences between pixels at a specific distance. The steeper slope represents well-structured bone while the lower slope is suggestive of poorer architecture. Based on values provided by the manufacturer, TBS > 1.350 is normal, 1.200-1.350 is consistent with partially degraded bone and < 1.200 indicates degraded bone.
TBS is typically measured at the L1-L4 lumbar spine (LS), the same sites used for DXA. The results are pro-vided for each vertebral body as well as the composite for L1-L4. Unlike DXA, osteoarthritic changes have little impact on data generated by TBS.
Several studies have shown that TBS predicts clinical, hip and vertebral fractures in postmenopausal women [35, 36]. Some longitudinal studies have reported that TBS predicts fracture risk in men over the age of 40 but data on premenopausal women are lacking [37, 38]. In addition, a meta-analysis of 14 prospective population-based cohorts reported that TBS provided additional information on the 10-year fracture probability as esti-mated by the standard FRAX tool [39].
A new feature is available on the online FRAX risk assessment tool with an option to “adjust with TBS”. A
low TBS would increase the FRAX risk of major osteo-porotic fracture by 1.5-1.6 fold [40]. Changes in TBS are much smaller than LS BMD with osteoporosis treatment and therefore the role of using TBS to monitor patients on therapy is uncertain. There is no data on the impact of a change in TBS on fracture risk.
Quantitative US (QUS)
QUS can provide information on bone structure and fra-gility. Due to its use of low-frequency ultrasound it is safe and a relatively inexpensive method to assess for osteoporosis. The two main parameters measured are the velocity of sound (VOS) and broadband US attenu-ation (BUA). Data provided by QUS of the heel have been shown to correlate with the risk of fracture [41] but it is not used routinely for diagnosis of osteoporosis.
Quantitative CT (QCT)
QCT provides volumetric 3D measurements by utilizing a low dose scan protocol and offers adequate details of the cortical and trabecular bone to generate reasonable estimates of strength through engineering-based analyses such as finite element analysis (FEA) and probabilistic modeling. QCT is most commonly studied at the lumbar spine and hip. A variation of QCT, high-resolution per-ipheral quantitative computed tomography (HR-pQCT), is mostly used to assess tibia and radius bone architec-ture and density. The associations between HR-pQCT-based vertebral bone measurements and prevalent verte-bral fractures depend on the spinal locations of both bone measurement and fracture [42, 43]. An unclear correlation between QCT and other non-vertebral osteo-porotic fractures along with higher exposure to ionizing radiation and cost have resulted in an infrequent use of these scans. In addition, large precision errors with re-peat measurements and unclear methods to adjust for variation in marrow fat and soft tissue density remain challenges for wider clinical use of QCT.
Fracture risk assessment calculators
Until recently, treatment decisions were made primarily using T-scores but the over-reliance on this score has re-sulted in over-treatment, especially in younger patients who may in fact have a lower fracture risk. Clinical risk factors, such as age, previous fragility fracture, parental history of hip fracture at age < 80, smoking, excessive al-cohol intake, and prolonged glucocorticoid use, all have been shown to confer risk independent of BMD meas-urement. Using these risk factors and BMD data, frac-ture prediction algorithms have been developed.
The FRAX scoring system (https://www.sheffield.ac. uk/FRAX/) is one such fracture prediction algorithm [44]. It is the most widely used fracture prediction algo-rithm. The score provides a 10-year probability of having
a hip or major osteoporotic fracture with or without data on femoral neck BMD. The algorithm has been well vali-dated in independent cohorts [45]. The Garvan calculator is another tool used to predict fracture risk (https://www. garvan.org.au/promotions/bone-fracture-risk/calculator/). The calculator was developed using data obtained from the Dubbo Osteoporosis Epidemiology Study at Sydney’s Garvan Institute. In addition to demographic variables and BMD or T-scores, the Garvan calculator takes into ac-count the number of falls. The tool has been validated and is found to be clinically useful in predicting fractures in those at high risk [46]. Other calculators such as Osteo-porosis Canada and FORE FRC v 2.0 predict the 10-year fracture risk but are not commonly used. The Male Osteo-porosis Risk Estimation Score (MORES) was reported to be a better tool to predict hip osteoporosis in men compared to FRAX [47]. While acknowledging that these calculators do not include all risk factors and can underesti-mate the fracture risk, they serve as a valuable tool to assist physicians in assessing risk with one long-term goal of avoidance of treatment in patients at low fracture risk [48].
Bone turnover markers (BTMs)
BTMs are released during bone remodeling and can be measured in blood or urine. BTMs provide an assess-ment of bone remodeling rate and are surrogate end-points for fracture, bone quality and effectiveness of the therapy. They are grouped into two broad categories: bone resorption and bone formation markers. Collagen degradation products, namely C-terminal cross-linked telopeptide of type 1 collagen (βCTX), are released during bone resorption and reflect osteoclast activity. Bone formation markers such as procollagen type I N-terminal propeptide (PINP) and procollagen type I C-terminal propeptide (PICP) are peptides derived from posttranslational cleavage of type I procollagen mole-cules by proteases at the N- and C-terminus, respect-ively. These markers reflect osteoblast function and activity.
Commercially available βCTX assays have been devel-oped with low method-specific difference and inter-assay variability. βCTX itself demonstrates significant variation due to circadian rhythm and food intake. It is best measured in the fasted state and in the morning. The International Osteoporosis Foundation recommends using PINP and βCTX to assess bone formation and bone resorption, respectively [24].
formation marker) were associated with a higher risk of fractures [50]. BTMs can also be used for monitoring osteoporosis treatment. In the IMPACT study, greater than 30% decline in the level of urine NTX was associ-ated with a 50% reduction in non-vertebral fractures [51]. In postmenopausal women treated with teripara-tide, an increase in P1NP at three months correlated with an increase in LS BMD at 18 months [52].
While there has been widespread use of these markers for monitoring therapy in osteoporosis, treat-ment goals based on fracture reduction have not been defined. In addition, there is insufficient data on the use of bone turnover markers for diagnosis of osteo-porosis, identifying candidates for treatment, and de-termination of the length of bisphosphonate “drug holidays”.
Treatment-related changes in bone density and architecture
Antiresorptive and anabolic therapies increase spine and hip BMD, with the highest increases in the spine (Table 1). As newer agents are studied, a trend in more efficacious BMD improvement with each new agent is apparent. Although many osteoporosis treatments have not been directly compared in head-to-head trials, the
mechanisms of actions of these newer treatments often predict a superior efficacy in increasing BMD.
All approved osteoporosis medications produce sig-nificant increases in spine and hip BMD as measured by DXA. The degree of BMD increase in the spine is likely a consequence of the greater surface area of trabecular-rich vertebral bodies on which the agents act. Twelve months of treatment with bisphospho-nates increased BMD by approximately 4% in the spine and 2% in the hip as reported in the landmark FIT, VERT, BONE, and Horizon trials [53–56]. The efficacy of daily, weekly and monthly oral and yearly IV bisphosphonate medications are similar [57–61]. Compliance with oral bisphosphonates is a common factor in those patients who fail to respond to treat-ment [62–64]. Denosumab has even greater effects likely owing to its enhanced ability to suppress bone resorption [65]. Teriparatide, an anabolic agent, in-creases spine and hip BMD [66]. Abaloparatide, an-other recently available anabolic agent, also markedly increases spine and hip BMD [67].
Romosozumab, not yet approved for treatment, is a humanized monoclonal antibody that targets sclerostin, and has been reported to increase spine BMD approxi-mately 13.5% and hip BMD approxiapproxi-mately 6.5% after 12 months of treatment [68,69].
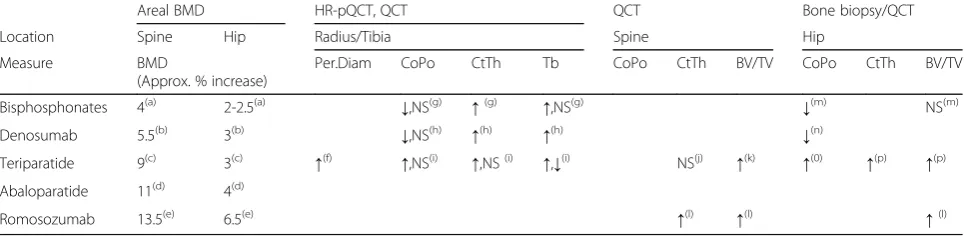
Table 1Summary of treatment-related changes in human skeletal architecture. Only published studies that reported defined skeletal architectural indices were included in the Table
Areal BMD HR-pQCT, QCT QCT Bone biopsy/QCT
Location Spine Hip Radius/Tibia Spine Hip
Measure BMD
(Approx. % increase)
Per.Diam CoPo CtTh Tb CoPo CtTh BV/TV CoPo CtTh BV/TV
Bisphosphonates 4(a) 2-2.5(a) ↓,NS(g) ↑(g) ↑,NS(g) ↓(m) NS(m)
Denosumab 5.5(b) 3(b) ↓,NS(h) ↑(h) ↑(h) ↓(n)
Teriparatide 9(c) 3(c) ↑(f) ↑,NS(i) ↑,NS(i) ↑,↓(i) NS(j) ↑(k) ↑(0) ↑(p) ↑(p)
Abaloparatide 11(d) 4(d)
Romosozumab 13.5(e) 6.5(e) ↑(l) ↑(l) ↑(l)
BMDbone mineral density,Per.Diamperiosteal diameter,CoPocortical porosity,CtThcortical thickness;Tbtrabecular indices;BV/TVbone volume/tissue volume,
NSnot significant,HR-pQCThigh-resolution peripheral quantitative computed tomography,QCTquantitative computed tomography Notes:
a. 12 months of treatment [53,54,56,81,82] b. 12 months of treatment [65]
c. 18 months of treatment [66] d. 18 months of treatment [67] e. 12 months of treatment [68,69] f. [71]
g. Cortical volumetric BMD (Ct vBMD) as a surrogate for CtPo, Tb = Tb vBMD [83]; CtTh significant only for tibia, Tb vBMD increased at tibia [84]; Ct vBMD as a surrogate for CtPo with difference only in tibia [85,86]
h. CoPo as a surrogate for Ct vBMD, Tb as a marker of trabecular volumetric BMD (Tb vBMD) [83]; [70,87]
i. 24 months of treatment [70]; 18 months of treatment, increase in plate Tb number and thickness [88]; 18 months of treatment, increase in trabecular number [89]; 18 months of treatment, increase in CtTh in tibia only, reduction in trabecular thickness [90]
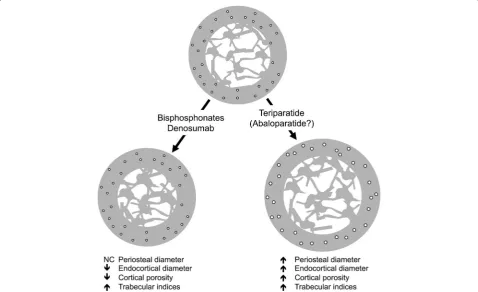
Numerous published studies have reported the archi-tectural changes in the skeleton with such agents using a variety of techniques that include HR-pQCT and QCT of in situ hip and spine as well as similar techniques of iliac crest bone biopsy samples. What has become clear is that they do not uniformly produce similar results (Table1, Fig.5). Bisphosphonates increase cortical thick-ness primarily by decreasing the endosteal perimeter, partially through the filling in of previously excavated re-sorption pits at the endosteal surfaces. In addition, bisphosphonates also reduce cortical porosity and in-crease the amount of trabecular bone. Denosumab has similar effects and presumably to a higher degree owing to its improved fracture reduction compared to bisphosphonates.
Teriparatide has unusual effects on cortical bone. While spine and hip BMD increased with this agent, forearm BMD declined prompting a closer inspection of architectural changes in cortical-rich areas [66]. Teri-paratide increases cortical porosity through two not mu-tually exclusive mechanisms: 1) increased osteocyte-directed bone resorption and 2) enhanced cortical
periosteal bone expansion that leaves a larger proportion of under-mineralized bone [70–72]. Furthermore, since the denominator in the BMD calculation is bone area and teriparatide certainly causes an increase in periosteal diameter compared to BMC, BMD expectedly decreases. Presumably abaloparatide has similar effects but such detailed human architectural analyses have not been published. Romosozumab is reported to increase cortical thickness and trabecular bone volume, but how this agent affects cortical porosity and bone size has not been published.
The future of goal-directed therapy
Goal-directed treatment for osteoporosis has been advo-cated as a superior strategy rather than treatment deci-sions made solely on DXA T-scores [73]. Rather than arbitrary recommendations to treat osteoporosis for 5 or 10 years with oral bisphosphonates or 3 to 6 years with IV bisphosphonates, depending on T-scores or whether a patient is deemed either low or high risk for fracture, treatment length should ideally be based on achieving a particular fracture risk threshold [74]. The FRAX risk
stratification system has raised awareness among clini-cians that other strong risk factors for fracture exist other than DXA T-scores—age, previous fragility frac-ture, high fall risk, long-term glucocorticoid use and other diseases associated with high fracture risk that in-clude diabetes mellitus. However, neither bone size nor architectural makeup is routinely measured but clearly have large impacts on bone strength. For example, the femoral neck of two individuals could have the same BMD but the structure of these could be vastly different owing to the differences in size with a smaller femoral neck possessing lower strength. The bone area is already routinely reported in DXA scans but is not routinely uti-lized to assess risk. However, recent data support that bone size is dynamic and that postmenopausal women with smaller femoral neck size may in fact be at lower risk for fracture as they age compared to women with larger femoral neck size due to adapted changes with aging [32]. How these inter-individual differences in the age-changes of structure and mass affect bone strength and fracture has yet to be fully determined.
New imaging techniques that not only measure BMD but also measure critical indices directly related to frac-ture risk such as bone size, porosity, cortical thickness, trabecular volume and the mineral to matrix ratio are needed. Even better, having such a device that is afford-able and appropriately sized allowing clinicians to assess fracture risk in the clinic is the future of osteoporosis care. Until the radiation dose of QCT is lower, such im-aging modalities are not practical for routine screening and treatment monitoring. Methods to directly measure bone quality such as reference point indentation are in-vestigative. This method is limited by pain, differing out-come measures amongst cohorts [75–77] and are inconsistently related to traditional tissue-level mechan-ical properties [78,79]. Compact ultrasound imaging de-vices that measure forearm cortical bone size and trabecular bone density is an exciting new area [80].
With advancing imaging methods, we can envision a treatment strategy whereby osteoporosis medications are selected based on individual skeletal characteristics. For example, patients with larger bones, and thinner and porous cortices may benefit from bisphosphonates and denosumab, to reduce endocortical resorption that would ultimately increase cortical thickness. Conversely in patients with smaller bones whose cortex is not espe-cially porous, teriparatide or abaloparatide may provide maximal bone strength. Clearly, this is an area of further research.
Conclusions
The challenges to wider clinical utilization of biomech-anical traits in treatment decisions involve 1) better un-derstanding of biomechanical principles, 2) developing
an appreciation of how bone strength depends on mul-tiple traits, 3) incorporating the concept that people fracture for different biomechanical reasons, and 4) co-alescing this information into a digestible outcome par-ameter that can be used clinically are areas where more work is needed. Using these sophisticated technologies, clinicians will be able to select therapy that targets skel-etal characteristics. While much work remains in re-defining and identifying individuals at risk of fractures, updating the current system of diagnosis and generating new technologies, we inch closer to the future of osteo-porosis care and personalized medicine.
Abbreviations
BMC:Bone mineral content; BMD: Bone mineral density; BTM: Bone turnover marker; DXA: Dual-energy X-ray absorptiometry; HR-pQCT: High-resolution peripheral quantitative computed tomography; LS: Lumbar spine; P1CP: Procollagen type I C-terminal propeptide; P1NP: Procollagen type I N-terminal propeptide; QCT: Quantitative computed tomography; QUS: Quantitative ultrasound; ROI: Region of interest; SD: Standard deviation; TBS: Trabecular bone score; WHO: World Health Organization;βCTX: C-terminal cross-linked telopeptide of type 1 collagen;
μSv: Microsieverts
Funding
This work was supported in part by grants from the NIH (AR065424, AR069620 to KJJ).
Availability of data and materials
Data sharing not applicable to this article as no datasets were generated or analyzed during the current study.
Authors’contributions
PC, KJJ, and GAC were involved in the drafting, revising and final approval of the manuscript.
Ethics approval and consent to participate
Not applicable.
Competing interests
The authors declare that they have no competing interests.
Publisher’s Note
Springer Nature remains neutral with regard to jurisdictional claims in published maps and institutional affiliations.
Author details
1Division of Metabolism, Endocrinology & Diabetes, Department of Internal
Medicine, University of Michigan, Ann Arbor, MI, USA.2Departments of Orthopaedic Surgery and Biomedical Engineering, University of Michigan, Ann Arbor, MI, USA.3Endocrinology Section, Ann Arbor VA Medical Center, 2215 Fuller Road, Research 151, Ann Arbor, MI 48105-2399, USA.
Received: 21 November 2017 Accepted: 27 April 2018
References
1. What is Osteoporosis and What Causes It? Arlington: National Osteoporosis Foundation.https://www.nof.org/patients/what-is-osteoporosis/. 2. Wahner HW, Dunn WL, Brown ML, Morin RL, Riggs BL. Comparison of
dual-energy x-ray absorptiometry and dual photon absorptiometry for bone mineral measurements of the lumbar spine. Mayo Clin Proc. 1988;63:1075–84. 3. Kanis JA. Assessment of fracture risk and its application to screening for
postmenopausal osteoporosis: synopsis of a WHO report. WHO study group. Osteoporos Int. 1994;4:368–81.
women without osteoporosis. When is fracture prevention cost-effective? Bone. 2006;38:694–700.
5. Kanis JA, McCloskey EV, Johansson H, Oden A, Melton LJ 3rd, Khaltaev N. A reference standard for the description of osteoporosis. Bone. 2008;42:467–75. 6. Donaldson LJ, Cook A, Thomson RG. Incidence of fractures in a geographically
defined population. J Epidemiol Community Health. 1990;44:241–5. 7. Center JR, Nguyen TV, Schneider D, Sambrook PN, Eisman JA. Mortality after
all major types of osteoporotic fracture in men and women: an observational study. Lancet. 1999;353:878–82.
8. Trombetti A, Herrmann F, Hoffmeyer P, Schurch MA, Bonjour JP, Rizzoli R. Survival and potential years of life lost after hip fracture in men and age-matched women. Osteoporos Int. 2002;13:731–7.
9. Sornay-Rendu E, Munoz F, Garnero P, Duboeuf F, Delmas PD. Identification of osteopenic women at high risk of fracture: the OFELY study. J Bone Miner Res. 2005;20:1813–9.
10. Schuit SC, van der Klift M, Weel AE, de Laet CE, Burger H, Seeman E, Hofman A, Uitterlinden AG, van Leeuwen JP, Pols HA. Fracture incidence and association with bone mineral density in elderly men and women: the Rotterdam study. Bone. 2004;34:195–202.
11. Ralston SH, Uitterlinden AG. Genetics of osteoporosis. Endocr Rev. 2010;31: 629–62.
12. Almeida M, Laurent MR, Dubois V, Claessens F, O'Brien CA, Bouillon R, Vanderschueren D, Manolagas SC. Estrogens and androgens in skeletal physiology and pathophysiology. Physiol Rev. 2017;97:135–87.
13. Keyak JH, Skinner HB, Fleming JA. Effect of force direction on femoral fracture load for two types of loading conditions. J Orthop Res. 2001;19:539–44. 14. Singh M, Nagrath AR, Maini PS. Changes in trabecular pattern of the upper
end of the femur as an index of osteoporosis. J Bone Joint Surg Am. 1970; 52:457–67.
15. Zebaze RM, Jones A, Knackstedt M, Maalouf G, Seeman E. Construction of the femoral neck during growth determines its strength in old age. J Bone Miner Res. 2007;22:1055–61.
16. Chen H, Zhou X, Shoumura S, Emura S, Bunai Y. Age- and gender-dependent changes in three-dimensional microstructure of cortical and trabecular bone at the human femoral neck. Osteoporos Int. 2010;21:627–36. 17. Bjornerem A, Bui QM, Ghasem-Zadeh A, Hopper JL, Zebaze R, Seeman E.
Fracture risk and height: an association partly accounted for by cortical porosity of relatively thinner cortices. J Bone Miner Res. 2013;28:2017–26. 18. Shigdel R, Osima M, Ahmed LA, Joakimsen RM, Eriksen EF, Zebaze R,
Bjornerem A. Bone turnover markers are associated with higher cortical porosity, thinner cortices, and larger size of the proximal femur and non-vertebral fractures. Bone. 2015;81:1–6.
19. Bjornerem A. The clinical contribution of cortical porosity to fragility fractures. Bonekey Rep. 2016;5:846.
20. Bala Y, Zebaze R, Ghasem-Zadeh A, Atkinson EJ, Iuliano S, Peterson JM, Amin S, Bjornerem A, Melton LJ 3rd, Johansson H, et al. Cortical porosity identifies women with osteopenia at increased risk for forearm fractures. J Bone Miner Res. 2014;29:1356–62.
21. Jepsen KJ, Silva MJ, Vashishth D, Guo XE, van der Meulen MC. Establishing biomechanical mechanisms in mouse models: practical guidelines for systematically evaluating phenotypic changes in the diaphyses of long bones. J Bone Miner Res. 2015;30:951–66.
22. Garnero P, Sornay-Rendu E, Duboeuf F, Delmas PD. Markers of bone turnover predict postmenopausal forearm bone loss over 4 years: the OFELY study. J Bone Miner Res. 1999;14:1614–21.
23. Johnell O, Oden A, De Laet C, Garnero P, Delmas PD, Kanis JA. Biochemical indices of bone turnover and the assessment of fracture probability. Osteoporos Int. 2002;13:523–6.
24. Vasikaran S, Eastell R, Bruyere O, Foldes AJ, Garnero P, Griesmacher A, McClung M, Morris HA, Silverman S, Trenti T, et al. Markers of bone turnover for the prediction of fracture risk and monitoring of osteoporosis treatment: a need for international reference standards. Osteoporos Int. 2011;22:391–420. 25. Seeman E. Age- and menopause-related bone loss compromise cortical and
trabecular microstructure. J Gerontol A Biol Sci Med Sci. 2013;68:1218–25. 26. Fogelman I, Blake GM. Different approaches to bone densitometry. J Nucl
Med. 2000;41:2015–25.
27. Cauley JA. Defining ethnic and racial differences in osteoporosis and fragility fractures. Clin Orthop Relat Res. 2011;469:1891–9.
28. Nam HS, Kweon SS, Choi JS, Zmuda JM, Leung PC, Lui LY, Hill DD, Patrick AL, Cauley JA. Racial/ethnic differences in bone mineral density among older women. J Bone Miner Metab. 2013;31:190–8.
29. Third National Health and Nutrition Examination Survery (NHANES III), Bone Densitometry Manual. Arlington: National Osteoporosis Foundation.https:// wwwn.cdc.gov/nchs/data/nhanes3/manuals/bone.pdf.
30. Carey JJ, Delaney MF. T-scores and Z-scores. Clinical Review of Bone and Mineral Metabolism. 2010;8:113–21.
31. Zemel BS, Leonard MB, Kelly A, Lappe JM, Gilsanz V, Oberfield S, Mahboubi S, Shepherd JA, Hangartner TN, Frederick MM, et al. Height adjustment in assessing dual energy x-ray absorptiometry measurements of bone mass and density in children. J Clin Endocrinol Metab. 2010;95:1265–73. 32. Jepsen KJ, Kozminski A, Bigelow EM, Schlecht SH, Goulet RW, Harlow SD,
Cauley JA, Karvonen-Gutierrez C. Femoral neck external size but not aBMD predicts structural and mass changes for women transitioning through menopause. J Bone Miner Res. 2017;32:1218–28.
33. Martineau P, Silva BC, Leslie WD. Utility of trabecular bone score in the evaluation of osteoporosis. Curr Opin Endocrinol Diabetes Obes. 2017;24:402–10. 34. Pothuaud L, Carceller P, Hans D. Correlations between grey-level variations
in 2D projection images (TBS) and 3D microarchitecture: applications in the study of human trabecular bone microarchitecture. Bone. 2008;42:775–87. 35. Hans D, Goertzen AL, Krieg MA, Leslie WD. Bone microarchitecture assessed
by TBS predicts osteoporotic fractures independent of bone density: the Manitoba study. J Bone Miner Res. 2011;26:2762–9.
36. Leslie WD, Johansson H, Kanis JA, Lamy O, Oden A, McCloskey EV, Hans D. Lumbar spine texture enhances 10-year fracture probability assessment. Osteoporos Int. 2014;25:2271–7.
37. Leslie WD, Aubry-Rozier B, Lix LM, Morin SN, Majumdar SR, Hans D. Spine bone texture assessed by trabecular bone score (TBS) predicts osteoporotic fractures in men: the Manitoba bone density program. Bone. 2014;67:10–4. 38. Schousboe JT, Vo T, Taylor BC, Cawthon PM, Schwartz AV, Bauer DC, Orwoll
ES, Lane NE, Barrett-Connor E, Ensrud KE. Osteoporotic fractures in men Mr OSSRG: prediction of incident major osteoporotic and hip fractures by trabecular bone score (TBS) and prevalent radiographic vertebral fracture in older men. J Bone Miner Res. 2016;31:690–7.
39. McCloskey EV, Oden A, Harvey NC, Leslie WD, Hans D, Johansson H, Barkmann R, Boutroy S, Brown J, Chapurlat R, et al. A meta-analysis of trabecular bone score in fracture risk prediction and its relationship to FRAX. J Bone Miner Res. 2016;31:940–8.
40. McCloskey EV, Oden A, Harvey NC, Leslie WD, Hans D, Johansson H, Kanis JA. Adjusting fracture probability by trabecular bone score. Calcif Tissue Int. 2015;96:500–9.
41. Moayyeri A, Adams JE, Adler RA, Krieg MA, Hans D, Compston J, Lewiecki EM. Quantitative ultrasound of the heel and fracture risk assessment: an updated meta-analysis. Osteoporos Int. 2012;23:143–53.
42. Anderson DE, Demissie S, Allaire BT, Bruno AG, Kopperdahl DL, Keaveny TM, Kiel DP, Bouxsein ML. The associations between QCT-based vertebral bone measurements and prevalent vertebral fractures depend on the spinal locations of both bone measurement and fracture. Osteoporos Int. 2014;25: 559–66.
43. Wang X, Sanyal A, Cawthon PM, Palermo L, Jekir M, Christensen J, Ensrud KE, Cummings SR, Orwoll E, Black DM, et al. Prediction of new clinical vertebral fractures in elderly men using finite element analysis of CT scans. J Bone Miner Res. 2012;27:808–16.
44. Kanis JA, Johnell O, Oden A, Johansson H, McCloskey E. FRAX and the assessment of fracture probability in men and women from the UK. Osteoporos Int. 2008;19:385–97.
45. Kanis JA, Oden A, Johnell O, Johansson H, De Laet C, Brown J, Burckhardt P, Cooper C, Christiansen C, Cummings S, et al. The use of clinical risk factors enhances the performance of BMD in the prediction of hip and osteoporotic fractures in men and women. Osteoporos Int. 2007;18:1033–46.
46. Bolland MJ, Siu AT, Mason BH, Horne AM, Ames RW, Grey AB, Gamble GD, Reid IR. Evaluation of the FRAX and Garvan fracture risk calculators in older women. J Bone Miner Res. 2011;26:420–7.
47. Cass AR, Shepherd AJ, Asirot R, Mahajan M, Nizami M. Comparison of the male osteoporosis risk estimation score (MORES) with FRAX in identifying men at risk for osteoporosis. Ann Fam Med. 2016;14:365–9.
48. van Geel TA, Eisman JA, Geusens PP, van den Bergh JP, Center JR, Dinant GJ. The utility of absolute risk prediction using FRAX(R) and Garvan fracture risk calculator in daily practice. Maturitas. 2014;77:174–9.
50. Vergnaud P, Garnero P, Meunier PJ, Breart G, Kamihagi K, Delmas PD. Undercarboxylated osteocalcin measured with a specific immunoassay predicts hip fracture in elderly women: the EPIDOS study. J Clin Endocrinol Metab. 1997;82:719–24.
51. Eastell R, Vrijens B, Cahall DL, Ringe JD, Garnero P, Watts NB. Bone turnover markers and bone mineral density response with risedronate therapy: relationship with fracture risk and patient adherence. J Bone Miner Res. 2011;26:1662–9.
52. Chen P, Satterwhite JH, Licata AA, Lewiecki EM, Sipos AA, Misurski DM, Wagman RB. Early changes in biochemical markers of bone formation predict BMD response to teriparatide in postmenopausal women with osteoporosis. J Bone Miner Res. 2005;20:962–70.
53. Black DM, Cummings SR, Karpf DB, Cauley JA, Thompson DE, Nevitt MC, Bauer DC, Genant HK, Haskell WL, Marcus R, et al. Randomised trial of effect of alendronate on risk of fracture in women with existing vertebral fractures. Fracture intervention trial research group. Lancet. 1996;348:1535–41. 54. Harris ST, Watts NB, Genant HK, McKeever CD, Hangartner T, Keller M,
Chesnut CH 3rd, Brown J, Eriksen EF, Hoseyni MS, et al. Effects of risedronate treatment on vertebral and nonvertebral fractures in women with
postmenopausal osteoporosis: a randomized controlled trial. Vertebral efficacy with Risedronate therapy (VERT) study group. JAMA. 1999;282:1344–52. 55. Chesnut CH 3rd, Skag A, Christiansen C, Recker R, Stakkestad JA, Hoiseth A,
Felsenberg D, Huss H, Gilbride J, Schimmer RC, et al. Effects of oral ibandronate administered daily or intermittently on fracture risk in postmenopausal osteoporosis. J Bone Miner Res. 2004;19:1241–9. 56. Black DM, Delmas PD, Eastell R, Reid IR, Boonen S, Cauley JA, Cosman F,
Lakatos P, Leung PC, Man Z, et al. Once-yearly zoledronic acid for treatment of postmenopausal osteoporosis. N Engl J Med. 2007;356:1809–22. 57. Rizzoli R, Greenspan SL, Bone G 3rd, Schnitzer TJ, Watts NB, Adami S, Foldes
AJ, Roux C, Levine MA, Uebelhart B, et al. Two-year results of once-weekly administration of alendronate 70 mg for the treatment of postmenopausal osteoporosis. J Bone Miner Res. 2002;17:1988–96.
58. Brown JP, Kendler DL, McClung MR, Emkey RD, Adachi JD, Bolognese MA, Li Z, Balske A, Lindsay R. The efficacy and tolerability of risedronate once a week for the treatment of postmenopausal osteoporosis. Calcif Tissue Int. 2002;71:103–11.
59. Delmas PD, McClung MR, Zanchetta JR, Racewicz A, Roux C, Benhamou CL, Man Z, Eusebio RA, Beary JF, Burgio DE, et al. Efficacy and safety of risedronate 150 mg once a month in the treatment of postmenopausal osteoporosis. Bone. 2008;42:36–42.
60. Reginster JY, Adami S, Lakatos P, Greenwald M, Stepan JJ, Silverman SL, Christiansen C, Rowell L, Mairon N, Bonvoisin B, et al. Efficacy and tolerability of once-monthly oral ibandronate in postmenopausal osteoporosis: 2 year results from the MOBILE study. Ann Rheum Dis. 2006; 65:654–61.
61. Craig SJ, Youssef PP, Vaile JH, Sullivan L, Bleasel JF. Intravenous zoledronic acid and oral alendronate in patients with a low trauma fracture: experience from an osteoporosis clinic. Intern Med J. 2011;41:186–90.
62. Siris ES, Harris ST, Rosen CJ, Barr CE, Arvesen JN, Abbott TA, Silverman S. Adherence to bisphosphonate therapy and fracture rates in osteoporotic women: relationship to vertebral and nonvertebral fractures from 2 US claims databases. Mayo Clin Proc. 2006;81:1013–22.
63. Brookhart MA, Avorn J, Katz JN, Finkelstein JS, Arnold M, Polinski JM, Patrick AR, Mogun H, Solmon DH. Gaps in treatment among users of osteoporosis medications: the dynamics of noncompliance. Am J Med. 2007;120:251–6. 64. Patrick AR, Brookhart MA, Losina E, Schousboe JT, Cadarette SM, Mogun H,
Solomon DH. The complex relation between bisphosphonate adherence and fracture reduction. J Clin Endocrinol Metab. 2010;95:3251–9. 65. Cummings SR, San Martin J, McClung MR, Siris ES, Eastell R, Reid IR, Delmas
P, Zoog HB, Austin M, Wang A, et al. Denosumab for prevention of fractures in postmenopausal women with osteoporosis. N Engl J Med. 2009;361:756–65. 66. Neer RM, Arnaud CD, Zanchetta JR, Prince R, Gaich GA, Reginster JY,
Hodsman AB, Eriksen EF, Ish-Shalom S, Genant HK, et al. Effect of parathyroid hormone (1-34) on fractures and bone mineral density in postmenopausal women with osteoporosis. N Engl J Med. 2001;344:1434–41. 67. Miller PD, Hattersley G, Riis BJ, Williams GC, Lau E, Russo LA, Alexandersen P,
Zerbini CA, Hu MY, Harris AG, et al. Effect of Abaloparatide vs placebo on new vertebral fractures in postmenopausal women with osteoporosis: a randomized clinical trial. JAMA. 2016;316:722–33.
68. Cosman F, Crittenden DB, Adachi JD, Binkley N, Czerwinski E, Ferrari S, Hofbauer LC, Lau E, Lewiecki EM, Miyauchi A, et al. Romosozumab
treatment in postmenopausal women with osteoporosis. N Engl J Med. 2016;375:1532–43.
69. Saag KG, Petersen J, Brandi ML, Karaplis AC, Lorentzon M, Thomas T, Maddox J, Fan M, Meisner PD, Grauer A. Romosozumab or alendronate for fracture prevention in women with osteoporosis. N Engl J Med. 2017;377: 1417–27.
70. Tsai JN, Nishiyama KK, Lin D, Yuan A, Lee H, Bouxsein ML, Leder BZ. Effects of Denosumab and Teriparatide transitions on bone microarchitecture and estimated strength: the DATA-switch HR-pQCT study. J Bone Miner Res. 2017;32:2001–9.
71. Zanchetta JR, Bogado CE, Ferretti JL, Wang O, Wilson MG, Sato M, Gaich GA, Dalsky GP, Myers SL. Effects of teriparatide [recombinant human parathyroid hormone (1-34)] on cortical bone in postmenopausal women with osteoporosis. J Bone Miner Res. 2003;18:539–43.
72. Zebaze R, Seeman E. Cortical bone: a challenging geography. J Bone Miner Res. 2015;30:24–9.
73. Cummings SR, Cosman F, Lewiecki EM, Schousboe JT, Bauer DC, Black DM, Brown TD, Cheung AM, Cody K, Cooper C, et al. Goal-directed treatment for osteoporosis: a progress report from the ASBMR-NOF working group on goal-directed treatment for osteoporosis. J Bone Miner Res. 2017;32:3–10. 74. Adler RA, El-Hajj Fuleihan G, Bauer DC, Camacho PM, Clarke BL, Clines GA,
Compston JE, Drake MT, Edwards BJ, Favus MJ, et al. Managing osteoporosis in patients on long-term bisphosphonate treatment: report of a task force of the American Society for Bone and Mineral Research. J Bone Miner Res. 2016;31:16–35.
75. Zysset PK, Guo XE, Hoffler CE, Moore KE, Goldstein SA. Mechanical properties of human trabecular bone lamellae quantified by nanoindentation. Technol Health Care. 1998;6:429–32.
76. Farr JN, Drake MT, Amin S, Melton LJ 3rd, McCready LK, Khosla S. In vivo assessment of bone quality in postmenopausal women with type 2 diabetes. J Bone Miner Res. 2014;29:787–95.
77. Malgo F, Hamdy NAT, Papapoulos SE, Appelman-Dijkstra NM. Bone material strength index as measured by impact microindentation is low in patients with fractures irrespective of fracture site. Osteoporos Int. 2017;28:2433–7. 78. Allen MR, McNerny EM, Organ JM, Wallace JM. True gold or pyrite: a review
of reference point indentation for assessing bone mechanical properties in vivo. J Bone Miner Res. 2015;30:1539–50.
79. Krege JB, Aref MW, McNerny E, Wallace JM, Organ JM, Allen MR. Reference point indentation is insufficient for detecting alterations in traditional mechanical properties of bone under common experimental conditions. Bone. 2016;87:97–101.
80. Stein EM, Rosete F, Young P, Kamanda-Kosseh M, McMahon DJ, Luo G, Kaufman JJ, Shane E, Siffert RS. Clinical assessment of the 1/3 radius using a new desktop ultrasonic bone densitometer. Ultrasound Med Biol. 2013;39: 388–95.
81. Cummings SR, Black DM, Thompson DE, Applegate WB, Barrett-Connor E, Musliner TA, Palermo L, Prineas R, Rubin SM, Scott JC, et al. Effect of alendronate on risk of fracture in women with low bone density but without vertebral fractures: results from the fracture intervention trial. JAMA. 1998;280:2077–82.
82. Chesnut CH, Ettinger MP, Miller PD, Baylink DJ, Emkey R, Harris ST, Wasnich RD, Watts NB, Schimmer RC, Recker RR. Ibandronate produces significant, similar antifracture efficacy in north American and European women: new clinical findings from BONE. Curr Med Res Opin. 2005;21:391–401. 83. Seeman E, Delmas PD, Hanley DA, Sellmeyer D, Cheung AM, Shane E,
Kearns A, Thomas T, Boyd SK, Boutroy S, et al. Microarchitectural
deterioration of cortical and trabecular bone: differing effects of denosumab and alendronate. J Bone Miner Res. 2010;25:1886–94.
84. Burghardt AJ, Kazakia GJ, Sode M, de Papp AE, Link TM, Majumdar S. A longitudinal HR-pQCT study of alendronate treatment in postmenopausal women with low bone density: relations among density, cortical and trabecular microarchitecture, biomechanics, and bone turnover. J Bone Miner Res. 2010;25:2558–71.
85. Chapurlat RD, Laroche M, Thomas T, Rouanet S, Delmas PD, de Vernejoul MC. Effect of oral monthly ibandronate on bone microarchitecture in women with osteopenia-a randomized placebo-controlled trial. Osteoporos Int. 2013;24:311–20.
87. Genant HK, Engelke K, Hanley DA, Brown JP, Omizo M, Bone HG, Kivitz AJ, Fuerst T, Wang H, Austin M, Libanati C. Denosumab improves density and strength parameters as measured by QCT of the radius in postmenopausal women with low bone mineral density. Bone. 2010;47:131–9.
88. Nishiyama KK, Cohen A, Young P, Wang J, Lappe JM, Guo XE, Dempster DW, Recker RR, Shane E. Teriparatide increases strength of the peripheral skeleton in premenopausal women with idiopathic osteoporosis: a pilot HR-pQCT study. J Clin Endocrinol Metab. 2014;99:2418–25.
89. Hansen S, Hauge EM, Beck Jensen JE, Brixen K. Differing effects of PTH 1-34, PTH 1-84, and zoledronic acid on bone microarchitecture and estimated strength in postmenopausal women with osteoporosis: an 18-month open-labeled observational study using HR-pQCT. J Bone Miner Res. 2013;28:736–45. 90. Macdonald HM, Nishiyama KK, Hanley DA, Boyd SK. Changes in trabecular
and cortical bone microarchitecture at peripheral sites associated with 18 months of teriparatide therapy in postmenopausal women with osteoporosis. Osteoporos Int. 2011;22:357–62.
91. Genant HK, Engelke K, Bolognese MA, Mautalen C, Brown JP, Recknor C, Goemaere S, Fuerst T, Yang YC, Grauer A, Libanati C. Effects of Romosozumab compared with Teriparatide on bone density and mass at the spine and hip in postmenopausal women with low bone mass. J Bone Miner Res. 2017;32:181–7.
92. Graeff C, Chevalier Y, Charlebois M, Varga P, Pahr D, Nickelsen TN, Morlock MM, Gluer CC, Zysset PK. Improvements in vertebral body strength under teriparatide treatment assessed in vivo by finite element analysis: results from the EUROFORS study. J Bone Miner Res. 2009;24:1672–80. 93. Graeff C, Campbell GM, Pena J, Borggrefe J, Padhi D, Kaufman A, Chang S,
Libanati C, Gluer CC. Administration of romosozumab improves vertebral trabecular and cortical bone as assessed with quantitative computed tomography and finite element analysis. Bone. 2015;81:364–9.
94. Chavassieux P, Meunier PJ, Roux JP, Portero-Muzy N, Pierre M, Chapurlat R. Bone histomorphometry of transiliac paired bone biopsies after 6 or 12 months of treatment with oral strontium ranelate in 387 osteoporotic women: randomized comparison to alendronate. J Bone Miner Res. 2014;29: 618–28.
95. Zebaze R, Libanati C, McClung MR, Zanchetta JR, Kendler DL, Hoiseth A, Wang A, Ghasem-Zadeh A, Seeman E. Denosumab reduces cortical porosity of the proximal femoral shaft in postmenopausal women with osteoporosis. J Bone Miner Res. 2016;31:1827–34.
96. Keaveny TM, Hoffmann PF, Singh M, Palermo L, Bilezikian JP, Greenspan SL, Black DM. Femoral bone strength and its relation to cortical and trabecular changes after treatment with PTH, alendronate, and their combination as assessed by finite element analysis of quantitative CT scans. J Bone Miner Res. 2008;23:1974–82.