Open Access
Research article
How should risk be communicated to children: a cross-sectional
study comparing different formats of probability information
Fiona Ulph*
1, Ellen Townsend
2and Cris Glazebrook
3Address: 1School of Psychological Sciences, University of Manchester, Oxford Road, Manchester, M13 9PL, UK, 2School of Psychology, University
of Nottingham, Nottingham, UK and 3Division of Psychiatry, University of Nottingham, Nottingham UK
Email: Fiona Ulph* - [email protected]; Ellen Townsend - [email protected]; Cris Glazebrook - [email protected]
* Corresponding author
Abstract
Background: Newborn screening, which identifies inherited disorders and sometimes carrier status, will increasingly involve health professionals in the provision of appropriate information and support to children and their families. The ability to understand carrier results relies on an understanding of probabilistic terms. However, little is known about how best to convey probabilistic medical information to children. Research with adult populations suggests information format significantly affects comprehension. This study aimed to explore which presentation format is most effective in conveying probabilistic information to children.
Methods: A probabilistic task based on the cup game was used to measure which of five different formats was associated with greatest understanding in children aged 7–11 years old (n = 106). Formats used were verbal labels (e.g. rarely, sometimes), percentages, proportion-word (e.g. 1 in X), proportion-notation (e.g. 1:X) and pie charts. There was also an additional mixed format condition. In each trial a picture was presented of three cups, each with a different probability depicted beneath it, and the child was asked to select which cup was most likely to contain the ball. Three trials were presented per format. Children also rated how certain they were that they had answered correctly.
Results: There was a significant relationship between format and comprehension scores. Post hoc tests showed children performed significantly better when probability was presented as a pie chart, in comparison to percentages, proportion – notation, proportion-word and mixed format trials. Furthermore, most children (84%) got all trials correct for this format and children were significantly more certain that their response was correct in the pie chart trials compared to all the other formats (p < 0.001). Significant positive correlations were found between self-ratings of certainty and comprehension of verbal labels, percentages and pie charts. Older age was also associated with better performance on all formats except percentages. Overall comprehension was calculated by summing the scores for the individual trials and this was independently associated with older age and higher IQ.
Conclusion: The results suggest that 7–11 year olds can understand probability information, but that the format used will significantly affect the accuracy and confidence with which children in this age group make judgements about the likelihood of an event. Of the formats studied, pie charts appear to be the optimal method of presenting probabilistic information to children in this age group. Health professionals and designers of health messages should be cognisant of this when communicating medical information to children aged 7–11 years old.
Published: 5 June 2009
BMC Medical Informatics and Decision Making 2009, 9:26 doi:10.1186/1472-6947-9-26
Received: 5 November 2008 Accepted: 5 June 2009
This article is available from: http://www.biomedcentral.com/1472-6947/9/26 © 2009 Ulph et al; licensee BioMed Central Ltd.
Background
Historically, children (people below the age of 16) have been regarded as passive recipients of health care, with information, decisions and consultations directed towards their parents [1]. The Gillick Case in the UK [2], in which the right for a child below the age of 16 to be pre-scribed contraception without parental knowledge was recognised, challenged this. In doing so it set the prece-dent that children who could demonstrate Gillick compe-tence should be involved in health care decisions. Subsequently, a number of policies were issued both within the UK and internationally which stipulated that children should, as far as developmentally possible, be encouraged and supported to take an active role in their health care [3,4]. More recently, the General Medical Council has advocated the inclusion of competent children in their own health care decisions [5].
Gillick competence has been adopted into law within the UK, Australia and Canada and is based on proving that the child is rational and able to communicate a decision which evidences that they have considered the conse-quences of such a choice and any alternative options [6,7]. Thus, a child's competence is determined by their ability to understand the implications of their decision. How effectively the information regarding the risks and likely outcomes of different decisions has been communicated to children will arguably significantly influence their abil-ity to make informed decisions regarding their health care [8]. Such a belief underpins the research interest in how best to communicate health information to children. An omission within this field is an examination of how best to present probability-based information to children.
Risk comprehension is central to many decisions about health [9] and is key to informed consent to treatment [10,11]. Research regarding adults' understanding of risk messages suggests the way risk information is conveyed impacts on an individual's ability to appraise different treatment regimens [12-14], change behaviours [15,16], and choose treatment outcomes [17]. This has lead to a proliferation of research examining how best to convey health risk information to adults [18-23]. Verbal labels [24,25], proportions [26,27], percentages [28], graphical representations [16,29,30] and a mixture of formats [31,32] have all been proposed as optimal formats. What is not clear from the existing research is the most effective way in which to convey probabilistic messages to children and whether they will similarly be affected by the format used.
Studies based on Piaget's theory of cognitive development suggests that children cannot understand probability until approximately 11 years of age [33] and the UK mathemat-ics curriculum largely reflects this Piagetian staging
[34,35]. Although Piagetian theory provides a framework to explore the development of probability comprehen-sion [36] an analysis of the evidence and subsequent research indicates this theory may be too simplistic [37]. Indeed, neo-Piagetian research indicated that, with appro-priate guidance, children as young as 7 years old can understand probability [36,38,39]. Research into proba-bility judgements is now characterised by a focus on the idea that intuitive processes are often used to solve prob-abilistic tasks and variance in performance is to be attrib-uted to the individuals' ability to select the relevant information from competing stimuli [36]. This work indi-cates that the ability to solve probabilistic tasks is present early in development and that children also appear to be vulnerable to task biases that affect adults. Thus, it is likely that the ability of children to understand medically related probabilistic information will be influenced by a number of factors, including the presentation of the task.
More recently, a study which compared the ability of chil-dren with adults when making expected value judgements concluded that children as young as five or six can under-stand probability [40]. Children were found to employ similar strategies to adults and also understood that prob-ability was an abstract concept. A cross-sectional survey study of 10–15 year olds and adults found large variation in the percentages attributed to verbal expressions, espe-cially in the 10–15 year olds' responses [28]. Participants had most difficultly when distinguishing between the ver-bal labels "possibly" and "probably".
The adult literature indicates that visual representations are beneficial for conveying probability to those with low literacy and numeracy skills [29,41] and for retaining attention [41]. The latter finding has been explained in terms of the information being presented in concrete terms. This may be particularly crucial when communicat-ing with children, particularly if formats which are famil-iar from school lessons are used (e.g. pie charts).
Although it has been acknowledged that risk communica-tion is central to conveying medical informacommunica-tion and patient decisions, the context for the present study was the introduction of newborn screening utilising genetic test-ing. Effective communication of probability is seen as cen-tral in genetics [42-44]. The implementation of newborn genetic screening programmes, which identify inherited disorders and sometimes carrier status in newborns, will result in a generation of children about whom genetic information is known prior to an age at which the individ-ual concerned could understand the implications of being a carrier.
reli-ant on probabilistic understanding. For example, a carrier of a gene for an autosomal recessive disease such as cystic fibrosis or sickle cell, (diseases screened for currently in the UK newborn screening programme), has a one in four chance in each pregnancy that their child will be affected with the disease if their partner is also a carrier. Addition-ally, there are the relative likelihoods of their partner being a carrier as a result of the prevalence in the commu-nity, or of their wider family members being carriers as the gene has been identified within the family. Thus, it is likely that any communication of carrier status to these children will necessitate an explanation of probability [45].
Although some parents will feel confident in conveying information about carrier status to their child, evidence suggests the communication of genetic information within families is limited [44,46] and problematic [47]. Many parents report that they find it difficult to inform children of their results and to be frank with them about the effects of the illness [47,48]. Thus, it is likely that health professionals will be called on to support parents with information giving [49]. Recent research suggests
that children aged 7–11 years old are in the process of constructing knowledge about genetics and it is at these ages that children could benefit from guidance (Ulph, Glazebrook & Townsend, Children's understanding of genetic concepts, submitted). What is uncertain is whether or how children could understand the probabil-istic nature of genetic information and the most effective way to convey this information. The aim of this study was, therefore, to determine whether children aged 7–11 are able to make probabilistic judgements and whether the format of the presentation of probabilistic information affects this ability.
Methods
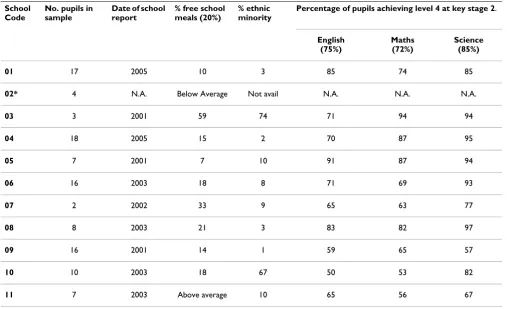
ParticipantsOne hundred and six children aged 7 to 11 years were recruited from 11 schools in the East Midlands area of the UK. Schools were sampled to represent a range of aca-demic achievements, proportions of children receiving free school meals, and percentages of ethnic minority chil-dren enrolled (table 1). The percentage of chilchil-dren receiv-ing free schools meals is routinely used by researchers as a measure of socio-demographic status [50]. Academic
Table 1: Information about the schools included in sample.
School Code
No. pupils in sample
Date of school report
% free school meals (20%)
% ethnic minority
Percentage of pupils achieving level 4 at key stage 2.
English (75%)
Maths (72%)
Science (85%)
01 17 2005 10 3 85 74 85
02* 4 N.A. Below Average Not avail N.A. N.A. N.A.
03 3 2001 59 74 71 94 94
04 18 2005 15 2 70 87 95
05 7 2001 7 10 91 87 94
06 16 2003 18 8 71 69 93
07 2 2002 33 9 65 63 77
08 8 2003 21 3 83 82 97
09 16 2001 14 1 59 65 57
10 10 2003 18 67 50 53 82
11 7 2003 Above average 10 65 56 67
standards are indicated by the percentage of children achieving level four at key stage two. Within the UK chil-dren are tested at key stages throughout their education. Performance within these key stages is often used as a measure of whether pupils within schools are reaching designated levels and, therefore, reflects the academic achievement of pupils within the school. Children aged 7–11 years old are within key stage two. Level four at key stage two represents a level that is expected of each eleven year old.
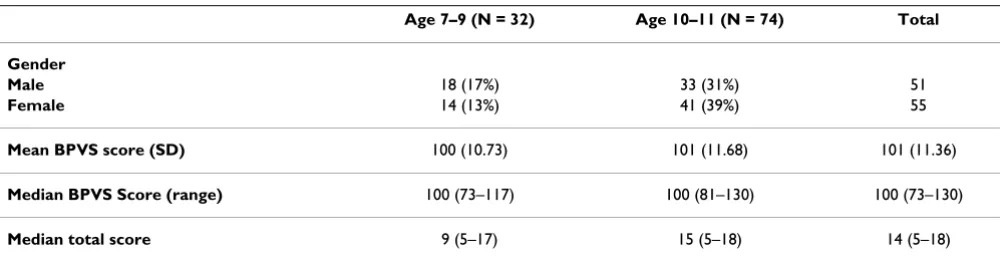
Parents of children who were in the appropriate age-range and attending one of the study schools were sent study information at least one week prior to the researcher (FU) attending the school. Children whose parents agreed to their participation were seen individually in a setting cho-sen by the school. Research suggests that children need clear explanations about why they are being asked to par-ticipate in research and what role they should take [51]. Therefore children were given verbal and written informa-tion about the study, and shown the measures with sim-ple explanations of each, before being asked to assent to participation. After assenting, the child completed the tasks in the order they chose. The age, gender and BPVS scores for the participants are reported below (see table 2).
The median scores and ranges indicate this sample is rep-resentative of the population and includes sufficient vari-ation to capture different abilities.
Participants were divided into two groups 7–9 and 10–11 years old based on the Piagetian theoretical assumption that within the ages 7–11 understanding would be most different between these two age groupings [33]. Although all ages of children were important to the study outcomes, more children were recruited into the older age group as probability understanding was hypothesised to be most developed in this group.
Measures
Probability Task
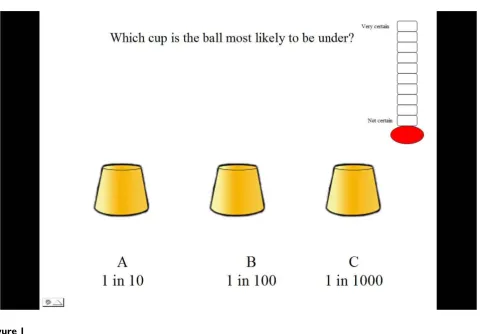
A probability task was constructed which consisted of 18 trials. The task was designed to emulate a game many chil-dren may have witnessed called the cup game. The child was presented with a work book with pictures of three cups on each page [See Figure 1 and Figure 2].
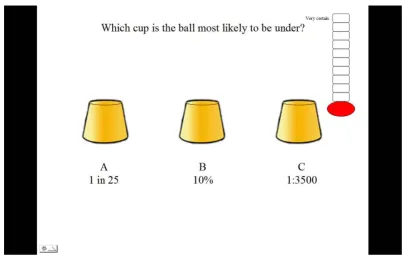
Five different probability formats were selected based on a review of relevant literature which suggested these were regularly used in health information messages. These were verbal labels (e.g. rare, highly likely); percentages: pie charts and proportions depicted either as words (e.g. 1 in 10) or notation (e.g. 1:100). The verbal labels were not aligned with specific numerical information as, due to the large differences found in the numerical likelihoods attributed to verbal labels [51-55], it was believed that this could not be done in a meaningful way. Each trial within the five formats contained three different probabilities for children to compare. These were selected by a panel of experts in risk communication, developmental psychol-ogy and genetic communication. Probabilities were selected to test children's ability to understand probability terms presented in different formats. Thus some trials con-tained large differences (e.g. 33%, 57%, 18%) whilst in others the differences were small (e.g. 83%, 79%, 84%). Other trials were designed to examine whether children were fallible to common misperceptions such as 1 in 1000 being more likely than 1 in 10 (e.g. 1in10, 1in100, 1in1000) [56]. There were three trials for each format and three additional trials which contained a mixture of for-mats as illustrated below [See Figure 3].
The slides also contained a ten point certainty scale depicted as a thermometer. The inclusion of this scale is in keeping with previous probability research [37] and pro-vided an indication of how comfortable the child was working with each format.
The British picture vocabulary scale (BPVS) (second edition)[57]
Previous research has illustrated the importance of meas-uring a child's ability to comprehend verbal task
instruc-Table 2: Demographic information of participants.
Age 7–9 (N = 32) Age 10–11 (N = 74) Total
Gender
Male 18 (17%) 33 (31%) 51
Female 14 (13%) 41 (39%) 55
Mean BPVS score (SD) 100 (10.73) 101 (11.68) 101 (11.36)
Median BPVS Score (range) 100 (73–117) 100 (81–130) 100 (73–130)
tions and produce responses when examining children's knowledge [58]. The BPVS is a valid and reliable measure of receptive vocabulary in children and scores equate closely to verbal IQ. Total scores are age standardized to give IQ scores with an expected population mean of 100 (SD 15).
Data collection
The tasks took approximately 20 minutes to complete. In each trial the child was asked to select the cup which was most likely to have a ball underneath it based on the prob-ability provided under each cup. The children were asked if they recognised each format and whether they required an explanation. A uniform explanation was given if requested and this was recorded on their score sheet. For example, if children indicated they wanted an explanation of percentages they were told that it meant 'how often something would happen out of one hundred'. If the child selected the cup with the highest probability depicted below it the child was given one point. The order in which formats were presented was counterbalanced to minimise the effect of previous formats on performance. The total score a child could achieve for each format was
3 with a maximum total task score of 18. Next the child was asked to indicate how certain they were that their answer was correct by choosing a level on the certainty scale with higher levels reflecting more certainty.
To administer the BPVS, participants are read a series of words. After each word the participant is asked to select the picture which represents the word from a page con-taining four line drawings. Participants are not required to read or write and responses can be verbal or by gesture.
Children were encouraged throughout the task, but no feedback regarding the accuracy of their answers was pro-vided. Following completion of the tasks, children were asked whether they had any questions about the research or the tasks that they had just completed. After answering their questions they were thanked for their participation.
Analysis
Data were analysed using SPSS version 11.6. Histograms and significant Kolmogorov-Smirnov test results indi-cated that the data were not normally distributed. Thus, non-parametric tests were used to analyse the data. Fried-Illustration of one cup game trial
Figure 1
man's tests were performed to analyse differences in per-formance and certainty across formats. Significant differences between formats were identified using post-hoc Wilcoxon signed rank tests applying a p value of 0.003 (Bonferroni correction). The Mann-Whitney U test was used to establish whether performance was affected by verbal ability, age group or the provision of an expla-nation. Effect sizes for both Mann-Whitney U tests and Wilcoxon signed rank tests were calculated by converting z scores into effect size estimates [59]. A hierarchical mul-tiple regression enabled the assessment of the influences of age, verbal ability and gender.
Ethics
This study was approved by the University of Notting-ham's School of Psychology Ethics Committee.
Results
There were no differences in BPVS scores or gender between the two age groups. Results of a Kruskal-Wallis test showed that the presentation order of formats did not affect performance so order of presentation was not included in analyses. A Mann Whitney U, performed to
analyse the effect of high (≥ 100) or low (≤ 99) BPVS scores [60], found no significant effects of verbal ability on performance scores for any of the formats.
Explanation of Formats
Uniform verbal explanations of formats were provided when requested. Table 3 reports the number of times explanations were given for each format.
Percentage and pie chart formats required explanations least frequently, whilst label and proportions required the most. Two tailed Mann-Whitney analyses found no differ-ence in scores for trials where an explanation had been given compared to those without explanation (see table 3 above).
Format Effects
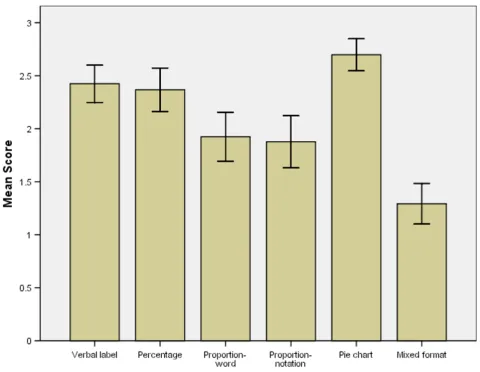
For each trial children could score 1 point for selecting the correct cup, creating a maximum score of 3 per format. The mean correct scores per format are presented in Figure 4 with error bars representing 95% confidence intervals. The graph illustrates that children achieved the highest Illustration of a pie chart format trial in which the light section indicates the likelihood of the ball being under that cup
Figure 2
scores with pie charts, followed by verbal labels and per-centages.
The Friedman test showed a highly significant effect of for-mat on comprehension (χ2 = 126.61, df = 5, p < .001).
Scores on the pie chart format were significantly higher than the following formats: percentage (z = 3.49, p < 0.001), proportion-word (z = 5.44, p < 0.001), propor-tion-notation (z = -5.11, p < 0.001), and mixed formats (z = -7.46, p < 0.001). Comparison between pie chart format and verbal labels failed to reach significance (z = -.63, p = .53). Children scored significantly worse when presented with mixed formats compared to verbal labels (z = -6.48,
p < 0.001), percentages (z = -6.09, p < 0.001), proportion-word (z = -4.93, p < 0.001), and proportion-notation (z = -4.21, p < 0.001). Children found it significantly easier to choose the highest probability when data were presented as verbal labels compared to proportionnotation (z = -3.59, p < 0.001) and proportion-word (z = -3.48, p < 0.001). Performance was also better on percentages com-pared to proportion-notation (z = -3.10, p = .002). The direction of difference, significance values and effect sizes can be seen in table 4.
Although children's performance in the mixed formats tri-als was significantly worse than other tritri-als, this was not Illustration of mixed format trial
Figure 3
Illustration of mixed format trial.
Table 3: Frequency of explanation required per format for entire sample (n = 106)*.
Frequency of explanation (%) Relationship to performance
Verbal label 48 U = 1346.00, p = .67, r = -0.04
Percentage 6 U = 234.50, p = .28, r = -0.10
Proportion-word 27 U = 1017.50, p = .46, r = -0.07
Proportion-notation 36 U = 1133.00, p = .26, r = -0.11
Pie chart 16 U = 735.50, p = .78, r = -0.03
solely responsible for the finding that format affected comprehension. When these trials were omitted from the analysis the Friedman's test result was still significant (χ2
= 53.55, df = 4, p < .001). The number of children who achieved maximum scores on each format these can be seen in table 5
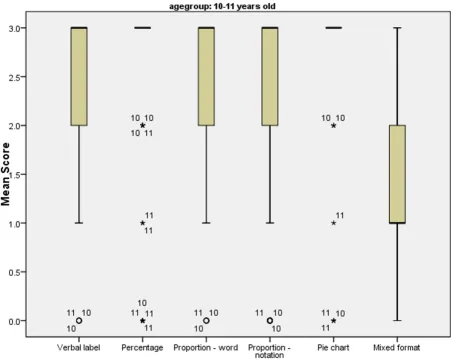
Age and Gender Effects on Format
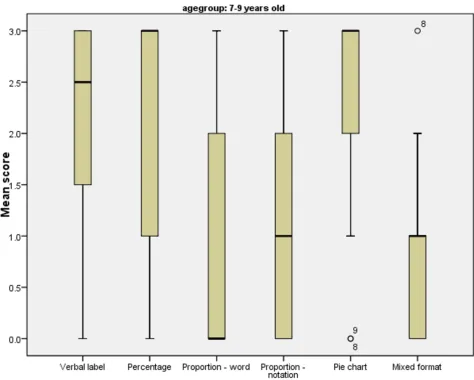
The older age group performed significantly better on all formats except percentages (U = 9 82.000, two tailed p = .086, r = -0.17) (Figure 5). An examination of the median and interquartile ranges in the graphs below highlights the variation in performance amongst the 7–9 year olds (see Figure 6).
The graphs also show that children in both age groups performed best on the percentage and pie chart formats,
with least variation in performance in the pie chart condi-tion. There were no effects of gender.
Self-ratings of Certainty
For each trial presented, children rated how certain they were that their answer was correct on a scale 1–10. Chil-dren could score a maximum of 30 per format. These anal-yses were conducted on 101 children. Scores for five children were omitted from the analyses as they consist-ently selected maximum scores on all trials, showing no evidence of utilizing the measure to reflect their feelings of certainty.
A Friedman's test indicated a significant effect of format on certainty score (χ2 = 125.81, df = 5, p =< .001). Table 6
displays the median certainty scores and interquartile ranges per format by age group. These data illustrate that Mean cup game score and 95% confidence intervals per format for entire sample
Figure 4
children of both ages felt most confident that their answer was correct when viewing pie charts.
The significance of these differences was explored through Wilcoxon signed rank tests using a p value of 0.003 (Bon-ferroni correction). Children reported feeling significantly more certain of their answers when probability informa-tion was presented as pie charts compared to verbal labels (z = -5.72, p < .001, r = -0.57), percentages (z = -3.31, p < .001, r = -0.33), proportion-word (z = -7.04, p < .001, r = - 0.70), proportion-notation (z = -7.17, p < .001, r = -0.71), and mixed formats (z = - 7.47, p < .001, r = -0.74). Children also felt more certain when making comparisons across percentages compared to verbal labels (z = -4.11, p
< .001, r = -0.41), proportion-word (z = -4.84, p < .001, r = 0.48), proportionnotation (z = 5.22, p < .001, r = -0.52), and mixed formats (z = -6.03, p < .001, r = -0.60).
Certainty and Comprehension
Significant positive correlations were found between self-ratings of certainty and comprehension of labels (rs = .414, df = 100, p =< .001), percentages (rs = .299, df = 100, p = .001) and pie charts (rs = .218, df = 100, p = .014). There were no significant relationships between certainty ratings and proportion-word (p = .137), proportion-nota-tion (p = .286) and mixed formats (p = .302). The three formats that were easiest to comprehend showed a posi-tive correlation between self-ratings of certainty and per-formance, whereas the formats that were less well understood showed no such relationship.
Factors Affecting Probability Comprehension
A hierarchical, multiple regression was conducted to fur-ther examine the influences of age, verbal ability and gen-der on performance. This was conducted on total scores for the probability task ( = 12.63, SD. 3.79). Age was entered as the first determinant based on the results reported above. Age explained 26% of the variance in total score (F1,103 = 36.72, p =< .001) with BPVS scores explaining a further 7% of the variance (F2,102 = 25.46, p = .015). Thus, once age is controlled for higher verbal abil-ity is associated with better understanding of probabilabil-ity. There was no effect of gender on total probability score.
x
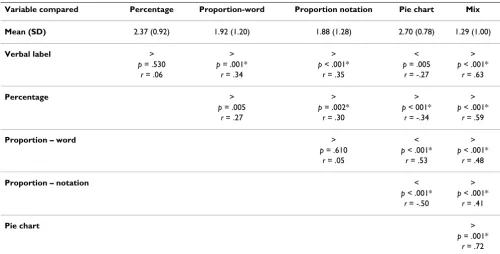
Table 4: Comparison of mean scores per format for entire sample on scale of 0–3 (difference, significance value, effect size).
Variable compared Percentage Proportion-word Proportion notation Pie chart Mix
Mean (SD) 2.37 (0.92) 1.92 (1.20) 1.88 (1.28) 2.70 (0.78) 1.29 (1.00)
Verbal label > > > < >
p = .530 p = .001* p < .001* p = .005 p < .001*
r = .06 r = .34 r = .35 r = -.27 r = .63
Percentage > > > >
p = .005 p = .002* p < 001* p < .001*
r = .27 r = .30 r = -.34 r = .59
Proportion – word > < >
p = .610 p < .001* p < .001*
r = .05 r = .53 r = .48
Proportion – notation < >
p < .001* p < .001* r = -.50 r = .41
Pie chart >
p = .001* r = .72
* Significant at p =< .003 level (Bonferroni correction)
Table 5: Number and percentage of children achieving maximum scores on each format with 95% confidence intervals.
N % 95% CI
Verbal label 69 65 55.92–74.08
Percentage 74 70 61.28–78.72
Proportion-word 48 45 35.53–54.47
Proportion-notation 53 50 40.48–59.52
Pie chart 89 84 77.02–90.98
Discussion
The results of this study highlight two important messages for health professionals and researchers. Firstly, the results indicate that when information is provided in an appro-priate format young children show evidence of under-standing probability and are more confident about their judgements. This concords with previous research which has illustrated that in experimental conditions children can make probability judgements [61,38,40]. It therefore strengthens the argument for children to be included in communications of probabilistic health messages using developmentally appropriate materials.
Secondly, it was found that format significantly affects younger children's ability to understand probabilities. Health professionals should be aware that proportions are poorly understood and misunderstandings may trigger unwarranted concerns in children. For example, if
chil-dren believe that 1 in 1000 is more likely than 1 in 10 uti-lising 1:1000 in an attempt to allay concerns is actually likely to make a child more anxious. This concords with previous work conducted with children which warns that they find this format problematic [40] and with research conducted with adults which demonstrates that misun-derstandings arise from their use [61-63]. Despite this, research suggests that proportions are one of the most fre-quently used formats [26], specifically when conveying disease risk in genetic counselling sessions [64].
Research also shows that both genetic counsellors and parents use verbal labels, especially when conveying small probabilities [64,65]. Although children in both age groups performed well when using this format, the find-ings from this study warrant caution when using verbal labels as almost half of the participants requested an explanation. Concerns have also been raised regarding the Mean, range and interquartile range of cup game scores for children aged 10–11 years old per format
Figure 5
Mean, range and interquartile range of cup game scores for children aged 7–9 years old per format
Figure 6
Mean, range and interquartile range of cup game scores for children aged 7–9 years old per format.
Table 6: Median and interquartile ranges of certainty scores per format by age group.
7–9 years old (N = 29) 10–11 years old (N = 72)
Median Interquartile range Median Interquartile range
Verbal label 21 15.5–24 21 17–24
Percentage 22 17.5–26 23.5 18.25–27
Proportion-word 22 17.5–27 19 14.25–24
Proportion-notation 20 15–27 18.5 15–23
Pie chart 26 24.5–30 24.5 18–28
use of verbal labels with adults [66] and adolescents [28]. Thus, health professionals should ensure that children understand the implications of such words when they are used within medical discussions. In addition, it has been shown that there can be ambiguity in how verbal labels are interpreted [11,51-55,67,68]. This suggests that designers of probabilistic health-related information should extensively research lay understanding of the mag-nitudes inferred by different verbal labels to ensure the correct message is being conveyed.
These results indicate that, of the formats studied, chil-dren are most likely to comprehend probabilistic infor-mation presented as either percentages or pie charts with 70% and 84% of children scoring maximally on these for-mats, respectively. The data suggest pie charts would be preferable as children performed best on this format and were also most confident about their responses, suggest-ing that this may be a good communication strategy with children. This finding is supported by evidence that graphical formats are optimal for conveying probability information to people with low literacy or numerical skills [29,30] and for retaining attention [30]. It is likely that these formats were easiest to understand as children can revert to using magnitude judgements to estimate probability. Magnitude judgements are simply the ability to judge which of two objects is largest. It has been argued that this skill precedes the understanding of probability [69] although even children with the capacity to reason using probabilities have been found to prefer to use mag-nitude judgements to solve probability tasks [70]. Although the use of percentages has been advocated with adolescents [28] it should be noted that this when per-formance was compared to verbal label comprehension. Additionally, research with adults suggests that whilst per-centages are often used when discussing treatment options [66], they can be poorly understood [27,71].
The child's age was also found to affect performance on all formats with the exception of percentages. Although this is in line with previous research [37], the present study illustrates that these results should not be taken to indi-cate that younger children cannot understand probability. Rather it should be acknowledged that they may need more guidance to understand certain probability formats. No differences were found in performance between chil-dren who requested an explanation and those who did not require one, suggesting that with minimal guidance children can understand most new formats of probability. There is an important distinction to be made between explanations in relation to verbal labels and explanations for numerical representations of probabilities. Explana-tions for verbal labels are specific to a particular descriptor and cannot be easily generalized. Thus, explanations were commonly requested for each term in the verbal label
for-mat. The provision of explanations in numerical formats (e.g. percentages are how often something happens out of one hundred) could be generalized and therefore children were less likely to require an explanation in subsequent trials of that format. Thus, following the provision of guidance children may be able to make probability deci-sions using formats such as percentage and pie charts in the future, whilst children may consistently need support to understand the meaning conveyed by verbal labels.
An analysis of factors which contribute to overall proba-bility understanding suggests that verbal IQ also contrib-utes to performance once age has been accounted for, a finding supported by previous research [37]. Self-ratings of certainty showed a positive correlation with percentage, verbal labels, and pie charts. Comprehension, therefore, was linked with defendable estimates of certainty.
The verbal labels in the trials were selected as they are typ-ically used to describe probability in health messages. Despite careful planning, consultation and piloting some children did not know a number of the words. This serves to emphasize that verbal labels may need extensive research to ensure the intended message is conveyed.
We acknowledge that we were not able to calculate response rates. This was not feasible within the ethical and school-based constrictions and it is relatively common that response rates are not reported in this field [37,72]. There is also a methodological reason why response rates can be potentially misleading in the reporting of school-based samples. Response rates are routinely used to gauge how representative a sample is, as a measure of how closely the sample recruited appropriates the population it was drawn from. As it is school teachers who select the children seen by researchers, a percentage figure may not be an adequate measure of how representative a given sample is. It is possible that teachers tend to select the most intelligent pupils (to present a good image of the school, or because these children have finished their work) or the children who are disruptive to the class. This bias may lead to an over-or underestimation of the abili-ties of children in general. A strength of this study was that the sample was drawn from a range of schools and was representative of the general population in terms of IQ.
normal range [8]. The aim of the study, however, was to verify whether children aged 7–11 could make probability judgements and whether the format used would affect their ability to do so.
Further research utilising a modified version of this meas-ure would be beneficial. It would be advantageous to include a wider range of graphical representations to establish whether the effects seen in this study were attrib-utable to pie charts per se or graphical representations more generally. This recognises the mixed findings regard-ing the utility of pie charts [22,73-76]. Also, extendregard-ing the number of trials of each format would enable one to explore more fully the range and extent of children's abil-ity to make judgements utilising these formats and a clearer distinctions between which formats represent opti-mal communication strategies.
Finally, the results of this work needs to be verified in applied settings. While it can be concluded that children can understand certain probability formats when pre-sented as classroom exercises, it cannot be assumed that children will readily adapt this knowledge to a clinical set-ting where the probabilistic message has personal impli-cations.
Conclusion
In conclusion these results demonstrate highly significant effects of format on comprehension. A more in-depth exploration indicated that performance across formats was more variable in the younger age group. Asking chil-dren of all ages to make judgements across different for-mats significantly reduced their ability to select the highest probability correctly. Although children per-formed well when presented with verbal labels, percent-age and pie chart formats, we conclude that pie charts were the optimal format to enable children to make deci-sions about probabilities within this study. We have con-cluded that pie charts are optimal because, although children performed well on other formats such as percent-ages and verbal labels, pie charts consistently showed the best levels of performance. This was true regardless of whether one examined mean scores, percentage of chil-dren gaining maximum points or median and interquar-tile ranges. Additionally, children reported that they were most certain of their answers using this format.
These finding have clear implications for health profes-sionals' communication and the involvement of children in health care. Health professionals should be encouraged that our results suggest that children may be able to understand simple risk information and that the use of an appropriate format can enhance their understanding. Although the focus of this study was to establish the best format in which to convey probabilistic information
regarding health to children with a specific focus on genet-ics, the results of this study could clearly also be used in other health and non-health related areas.
Competing interests
The authors declare that they have no competing interests.
Authors' contributions
FU conceived of the study, designed the study, co-ordi-nated and carried out the data collection and analysis, and drafted the manuscript. CG & ET participated in the design of the study, data analysis and redrafting of the manuscript. All authors read and approved the final ver-sion of the manuscript.
Acknowledgements
We would like to acknowledge the assistance of Prof. Scott Campbell who offered advice on the probability task. We would like to thank the Eco-nomic and Social Research Council who provided funding for this study via a PhD studentship for the project "Children's understanding of testing for a genetic illness". The ESRC provided funding but played no active role in the research or publication.
References
1. Alderson P: Competent children? Minors' consent to health care treatments and research. Social Science & Medicine 2007,
65:2272-2283.
2. Gillick v West Norfolk & Wisbech AHA. All ER 402 1985, 3:. 3. Department of Health: The Children Act 1989. London: Her
Maj-esty's Stationary Office; 1989.
4. UNCRC – United Nations: Convention on the rights of the child. New York: Unicef; 1989.
5. General Medical Council: 0–18 years: guidance for all doctors.
[http://www.gmc-uk.org/guidance/ethical_guidance/ children_guidance/index.asp].
6. Knoppers BM, Avard D, Cardinal G, Glass KC: Children and incompetent adults in genetic research: consent and safe-guards. Nature Reviews Genetics 2002, 3(3):221-225.
7. Schmerler S: Ethical and legal issues. In A guide to genetic counsel-ling Edited by: Baker DL, Schuette JL, Uhlmann WR. Chichester: Wiley-Liss; 1998:249-254.
8. Anker JS, Kaufman D: Rethinking health numeracy: A multidis-ciplinary literature review. Journal of the American Medical Infor-matics Association 2007, 14(6):713-721.
9. Edwards A, Elwyn G, Matthews E, Pill R: Presenting risk informa-tion – a review of the effects of "framing" and other manipu-lations on patient outcomes. Journal of Health Communication
2001, 6:61-82.
10. Fuller R, Dudley N, Blacktop J: How informed is consent? Under-standing of pictorial and verbal probability information by medical inpatients. Postgraduate Medicine 2002, 78:543-544. 11. Mazur DJ, Merz JF: Patients' interpretations of verbal
expres-sions of probability: implications for securing informed con-sent to medical interventions. Behaviour Science Law 1994,
12(4):417-426.
12. Say RE, Thomson R: The importance of patient preferences in treatment decisions – challenges for doctors. British Medical Journal 2003, 327:542-545.
13. Man-Son-Hing M, O'Connor AM, Drake E, Biggs J, Hum V, Laupacis A: The effect of qualitative vs. quantitative presentation of probability estimates on patient decision-making: a rand-omized trial. Health Expect 2002, 5(3):246-255.
14. Timmermans D, Molewijk B, Stiggelbout A, Kievit J: Different for-mats of communicating surgical risks to patients and the effect on choice of treatment. Patient Education and Counselling
2004, 54:255-263.
15. Brewer NT, Chapman GB, Gibbons FX, Gerrard M, McCaul KD:
and health behaviour: the example of vaccination. Health Psy-chology 2007, 26(2):136-145.
16. Marteau T, Lerman C: Genetic risk and behavioural change. Brit-ish Medical Journal 2001, 322:1056-1059.
17. Lobb EA, Butow PN, Meiser B, et al.: Women's preferences and consultants' risk communication in familial breast cancer consultations: impact on patient outcomes. Journal of Medical Genetics 2003, 40(5):56.
18. Alaszewski A, Horlick-Jones T: How can doctors communicate information about risks more effectively. British Medical Journal
2003, 327:728-731.
19. Bottorff JL, Ratner PA, Johnson JL, Lovato CY, Joab AA: Communi-cating cancer risk information: the challenges of uncertainty. Patient Education and Counselling 1998, 33:27-34.
20. Croyle RT, Sun YC, Hart M, Gettig J, Loftus EF, Barger SD: How well do people recall risk factor test results? Accuracy and bias among cholesterol screening participants. Health Psychology
2006, 25(3):425-432.
21. Kong A, Barnett GO, Mosteller F: How medical professionals evaluate expressions of probability. New England Journal of Med-icine 1986, 315:740-744.
22. Paling J: Strategies to help patients understand risks. British Medical Journal 2003, 327:745-748.
23. Rothman A, Kiviniemi MT: Treating people with health informa-tion: an analysis and review of approaches to communicating health risk information. Monographs of National Cancer Institute
1999, 25:44-51.
24. Julian-Reynier C, Welkenhuysen M, Hagoel L, Decruyenaere M, Hop-wood P: Risk communication strategies: state of the art and effectiveness in the context of cancer genetic services. Euro-pean Journal of Human Genetics 2003, 11:725-736.
25. Calman KC: Cancer: science and society and the communica-tion of risk. British Medical Journal 1996, 313:799-802.
26. Lee DH, Mehta MD: Evaluation of a visual risk communication tool: effects on knowledge and perception of blood transfu-sion risk. Transfusion 2003, 43:779-787.
27. Gigerenzer G: Reckoning with Risk. London: Penguin; 2002. 28. Biehl M, Halpern-Felsher BL: Adolescents' and adults'
under-standing of probability expressions. Journal of Adolescent Health
2001, 28:30-35.
29. Gigerenzer G, Edwards A: Simple tools for understanding risks: from innumeracy to insight. British Medical Journal 2003,
327:741-744.
30. Lipkus IM, Hollands JG: The visual communication of risks. Jour-nal Natl Cancer Inst Monogr 1999, 25:149-163.
31. Woloshin S, Schwartz LM: How can we help people make sense of medical data? Effective Clinical Practice 1999, 2(4):176-183. 32. Wallsten TS, Budescu DV, Zwick R, Kemp SM: Preferences and
reasons for communicating probabilistic information in ver-bal or numerical terms. Bulletin of the Psychonomic Society 1993,
31:135-138.
33. Piaget J, Inhelder B: The origin of the idea of chance in children.
London: Routledge & Kegan Paul; 1975.
34. Department for Children Schools and Families: Primary Frame-work for literacy and mathematics – learning objectives.
2007 [http://www.standards.dfes.gov.uk/primaryframework/help/ tutorials/webversion/Mathematics/learningobjectives].
35. Department for Children Schools and families: Primary Frame-work for literacy and mathematics – Year four. 2007 [http:// nationalstrategies.standards.dcsf.gov.uk/node/110240].
36. Reyna VF, Brainerd CJ: The origins of probability judgement: A review of data & theories. In Subjective Probability Edited by: Wright G, Ayton P. New York: Wiley; 1994:239-272.
37. Kreitler S, Kreitler H: Development of probability thinking in children 5 to 12 years old. Cognitive Development 1986, 1:365-390. 38. Davies CM: Development of the Probability Concept in
Chil-dren. Child Development 1965, 36(3):779-788.
39. Yost PA, Siegel AE, Andrews JM: Nonverbal Probability Judg-ments by Young-Children. Child Development 1962,
33(4):769-780.
40. Schlottmann A: Children's probability intuitions: Understand-ing the expected value of complex gambles. Child Development
2001, 72(1):103-122.
41. Lipkus IM, Crawford Y, Fenn K, Biradavolu M, Binder RA, Marcus A, Mason M: Testing different formats for communicating color-ectal cancer risk. Journal of Health Communication 1999, 4:311-324.
42. Hallowell N, Statham H, Murton F, Green J, Richards M: 'Talking about chance': the presentation of risk information during genetic counselling for breast and ovarian cancer. Journal of Genetic Counselling 1997, 6(3):269-286.
43. Sivell S, Elwyn G, Gaff CL, Clarke A, Iredale R, Shaw C, Dundon J, Thornton H, Edwards A: How risk is perceived, constructed & interpreted by clients in clinical genetics & the effects on decision making: a systematic review. Journal of Genetic Coun-seling 2008, 17:30-63.
44. Denayer L, EversKiebooms G, Deboeck K, VandenBerghe H: Repro-ductive Decision-Making of Aunts and Uncles of A Child with Cystic-Fibrosis – Genetic Risk Perception and Attitudes Toward Carrier Identification and Prenatal-Diagnosis. Amer-ican Journal of Medical Genetics 1992, 44(1):104-111.
45. Fang CY, Dunkel-Schetter C, Tatsugawa ZH, Fox MA, Bass HN, Crandall BF, Grody WW: Attitudes toward genetic carrier screening for cystic fibrosis among pregnant women: The role of health beliefs and avoidant coping style. Women's Health: Research on gender, Behaviour and Policy 1997, 3:31-51. 46. Lafayette D, Abuelo D, Passero MA, Tantravahi U: Attitudes
toward cystic fibrosis carrier and prenatal testing and utiliza-tion of carrier testing among relatives of individuals with cystic fibrosis. Journal of Genetic Counselling 1999, 8(1):17-36. 47. Fanos JH: Developmental tasks of childhood and adolescence:
Implications for genetic testing. American Journal of Medical Genetics 1997, 71(1):22-28.
48. DeMatteo D, Harrison C, Arneson C, et al.: Disclosing HIV/AIDS to children: The paths families take to truthtelling. Psycholog-ical Health & Medicine 2002, 7:339-356.
49. Nieuwenhoff HWP van den, Mesters I, Gielen C, de Vries NK: Fam-ily communication regarding inherited high cholesterol: Why and how do patients disclose genetic risk? Social Science and Medicine 2007, 65:1025-1037.
50. Goldstein H, Naden P: Modelling Social Segregation. Oxford Review of Education 2003, 29(2):225-237.
51. Timmermans D: The roles of experience and domain of exper-tise in using numerical and verbal probability terms in med-ical decisions. Medical Decision Making 1994, 14:146-156. 52. Budescu DV, Weinberg S, Wallsten TS: Decisions based on
numerically and verbally expressed uncertainties. Journal of Exp Psychol Gen 1988, 14:281-294.
53. Wallsten TS, Budescu DV, Rapaport R, Zwick R, Forsyth B: Measur-ing the vague meanMeasur-ing of probability terms. J Exp Psychol Gen
1986, 115:348-364.
54. Brun W, Teigen KH: Verbal probabilities: Ambiguous, context-dependent, or both? Organisational Behaviour and Human Decision Processes 1988, 41:390-404.
55. Teigen KH, Brun W: Yes, but is it uncertain: Direction and communicative intention of verbal probabilistic terms. Acta Psychologica 1995, 88:233-258.
56. Walker AP, Rimoin DL, Connor JM, Pyeritz RE: Genetic counsel-ling. In Emery and Rimoin's principles of medical genetics 3rd edition. New York: Churchill Livingstone; 1997:595-618.
57. Dunn LM, Dunn LM, Whetton CW, Burley J: The British Picture Vocabulary Scale. Windsor, UK: NFER-Nelson; 1997.
58. Crisp J, Ungerer JA, Goodnow JJ: The impact of experience on children's understanding of illness. Journal of Pediatric Psychology
1996, 21(1):57-72.
59. Field A: Discovering statistics using SPSS. London: Sage; 2005. 60. McPherson A, Glazebrook C, Forster D, James C, Smyth A: A ran-domised, controlled trial of an interactive educational com-puter package for children with asthma. Pediatrics 2006,
117:1046-1054.
61. Lippman-Hand A, Fraser C: Genetic counselling: Parents' responses to uncertainty. Birth Defects Original Article Series 1979,
15(5c):325-339.
62. Grimes DA, Snively GR: Patient's understanding of medical risks: implications for genetic counseling. Obstet Gynecol 1999,
93(6):910-914.
63. Woloshin S, Schwartz LM, Byram S, Fischhoff B, Welch HG: A new scale for assessing perceptions of chance: a validation study. Medical Decision Making 2000, 20:298-307.
Publish with BioMed Central and every scientist can read your work free of charge
"BioMed Central will be the most significant development for disseminating the results of biomedical researc h in our lifetime."
Sir Paul Nurse, Cancer Research UK
Your research papers will be:
available free of charge to the entire biomedical community
peer reviewed and published immediately upon acceptance
cited in PubMed and archived on PubMed Central
yours — you keep the copyright
Submit your manuscript here:
http://www.biomedcentral.com/info/publishing_adv.asp
BioMedcentral
65. Michie S, Lester K, Pinto J, Marteau TM: Communicating risk information in genetic counselling: An observational study. Health Education & Behaviour 2005, 32(5):589-598.
66. Pander Maat H, Klassan R: Side effects of side effect information in drug information leaflets. Journal of Technical Writing and Com-munication 1994, 24:389-404.
67. Bergenstrom A, Sherr L: The effect of order of presentation of verbal probability expression on numerical estimates in a medical context. Psychology, Health & Medicine 2003, 8(4):391-398. 68. Sutherland HJ, Lockwood GA, Tritchler DL, Sem R, Brooks L, Till JE:
Communicating probabilistic information to cancer patients: is there "noise" on the line? Social Science and Medicine
1991, 32:725-731.
69. Hoemann HW, Ross BM: Childrens Understanding of Probabil-ity Concepts. Child Development 1971, 42(1):221.
70. Offenbach SI: Studies of Children's Probability Learning Behaviour 8. Effect of Punishment at 2 Grade Levels. Psycho-nomic Science 1971, 23(6):407-408.
71. Hoffrage U, Gigerenzer G: Using natural frequencies to improve diagnostic inferences. Academic Medicine 1998, 73:538-540. 72. Kalish CW: Young children's predictions of illness: Failure to
recognize probabilistic causation. Developmental Psychology
1998, 34(5):1046-1058.
73. Hampson SE, Andrews JA, Lee ME, Foster LS, Glasgow RE, Lichten-stein E: Lay understanding of synergistic risk: the case of radon and cigarette smoking. Risk Analysis 1998, 18:343-350. 74. Hollands JG, Spence I: Judging proportions from graphs: the
summation model. Appl Cogn Psychol 1998, 12:173-190. 75. Spence I, Lewandowsky S: Displaying proportions and
percent-ages. Appl Cogn Psychol 1991, 5:61-77.
76. Fortin J, Hirota L, Bond B, O'Connor AM, Col N: Identifying patient preferences for communicating risk estimates: a descriptive pilot study. BMC Medical Inform Decis Mak 2001, 1(2):.
Pre-publication history
The pre-publication history for this paper can be accessed here: