Volume 9, Number 4, December 2014
A Study of the Design and Functioning of a
Program Performance Monitoring Platform
for Science Technology Programs
Fang-Yu Yeh
Science & Technology Policy Research and Information Center National Applied Research Laboratories, Taiwan
Jin-Li Hu & Yun-Chih Tsai
Institute of Business and Management National Chiao Tung University, Taiwan
ABSTRACT
Establishing a complete and innovative decision-making system may help budget-strapped governments control the overall operation of their science and technology (S&T) programs and integrate and maximize available resources to achieve optimal configurations for each program. This study, which is based on the theoretical framework of a national innovation system, establishes a fully optimized performance monitoring and evaluation (M&E) platform and provides recommendations for interim monitoring and M&E mechanisms. Based on meetings and interviews with experts, the results of the study show that an ideal process for performance M&E should include the establishment of a review committee, performance indexes for examination, interim monitoring and an M&E mechanism, and the effective tracking of program results. The results also indicate that a complete performance M&E platform for S&T programs should be based on the dimensions of functioning, data build, indicator input, data value-added, and user feedback and interaction. These measures not only help governments apply their performance budget systems and S&T resources, but also improve the efficiency and benefits of S&T programs, policies and systems, program review, and resource allocation.
International Journal of Business and Information
1.
INTRODUCTION
Budget reductions in recent years have prompted governments to consider how they can use their limited resources to maximize the benefits of science and technology (S&T) programs and how they can effectively integrate available resources to achieve optimal configurations for each program. Establishing a complete and innovative decision-making support system may help governments control the overall operation of their S&T programs and make them an integral part of technological development.
In order to help government authorities conduct research and development (R&D) and innovative activities and improve foresight in policy planning and executive performance, the Taiwanese government has, since 1997, enlisted the use of knowledge management as its most important policy initiative. For example, in 1997, the government established the Government Research Bulletin (GRB) as a common network platform in which administrative units of the Executive Yuan and regional governments can store their research projects and outcomes reports. In 2002, based on the foundation of GRB, the government developed a mechanism for filling out the performance index and established a monitoring and evaluation (M&E) platform to govern the performance of science and technology programs.
Volume 9, Number 4, December 2014
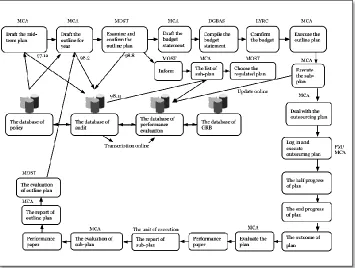
Source: 2002 M&E Platform governing the performance of S&T programs in Taiwan.
Figure 1. Association Graph of S&T Program Review, Management, and Evaluation Procedures in Taiwan
International Journal of Business and Information
mechanisms of existing platforms in order to improve the effectiveness of performance budgeting systems and the use of S&T resources.
The purposes of this study are: (1) to establish a fully optimized performance M&E platform that is based on the theoretical structure of a national innovation system; and (2) to propose strategic recommendations relating to interim monitoring and the M&E mechanism.
Section 2 of this paper provides a literature review of performance evaluation methods. Section 3 introduces foreign cases of performance evaluation platforms. Section 4 discusses optimal performance platform mechanisms and functions. Section 5 presents the summary and conclusions.
2.
LITERATURE REVIEW
Development and promotion of technology are important forces in enhancing national competence. How to maximize benefits from limited resources has become a major concern of national governments. The purposes of management and evaluation work are to understand the achievements and performance of S&T programs, to analyze their socio-economic impacts, and to verify their integrity [Lin, 1993].
There are two main purposes for which governments propose performance evaluation work: to promote accountability, and to improve their existing management systems. Accountability may allow the public to understand details of programs and policies proposed by their government; whereas, improving the government management system may help increase the transparency of government’s internal information and make it part of the public administration, through which the public can help monitor the executive performance of their government [Davis et al., 2006].
Because of limited governmental resources, performance evaluation for government S&T programs should be compatible with program purposes and should, accordingly, use different evaluation methods and tools in different stages [Gonda and Kakizaki, 1995]. Scholars have proposed a variety of quantitative evaluation methods for S&T programs, including scoring model, comparative method, mathematical optimization, multi-criteria decision analysis, cost/benefit analysis, decision tree analysis, and the analytic hierarchy process (AHP).
Volume 9, Number 4, December 2014
factors of each item reflect their importance. These items will finally be queued according to their final scores. Krawiec [1984] believes that, when data are acquirable and more sophisticated methods are not adopted, the scoring method will be efficient. Moore and Baker [1969], Souder [1972b], Baker and Freeland [1975], and other scholars have used this method to conduct evaluations. The disadvantage of this scoring method, however, is the lack of a complete and common definition, and, for this reason, it is less convincing.
The comparative method means comparing a program with other programs, using mathematical models to calculate clearly all benefits of a program, and then using these benefits to find the best option. Cetron et al. [1967] and Baker and Freeland [1975] have used this method to evaluate programs. Mathematical optimization includes a series of methods such as linear programming, non-linear programming, and 0-1 programming. These methods may help one to comprehend the structural framework of programs. The disadvantages, however, are that a large number of mathematical skills must be used and adoption of these methods might become impossible if some program results are difficult to quantify. Moore and Baker [1969], Gear et al. [1971], Souder [1972b], and other scholars have used these methods to conduct empirical analyses.
Cost/benefit analysis is commonly used to evaluate programs, to pre-calculate budgets, and, based on the costs and benefits, to determine program quality. The disadvantages of this method are that different costs and benefits must be measured in the same unit and that only the program itself will be considered in the absence of any other programs for comparison.
Decision tree analysis is used to set up the chance of uncertain variables in order to obtain results. This kind of analysis is usually used when decision-makers face a variety of options or two consecutive decisions, or when they make any subsequent decision affected by previous decisions [Martino, 1995].
International Journal of Business and Information
In sum, scholars have developed various methods to evaluate R&D performance, yet these methods provide little help to managers because they still bear some restrictions, such as being rather difficult to clearly define inputs and outputs of R&D, to measure program results, and to define the diffusion of program benefits. In addition, issues regarding the setup of evaluation criteria remain substantial in these methods. Revilla et al. [2003] suggest that most traditional methods for performance evaluation are based on quantity, yet some long-term performances are intangible and difficult to quantify.
Moreover, government-sponsored research programs and R&D projects of private companies are different in nature; thus, the produced impacts are different as well. In previous literature, scholars have given a multi-faceted assessment of R&D decision-making and performance evaluation of enterprises, but a similar assessment of the performance evaluation of governmental research projects or programs is rarely seen. Georghious [1999] has examined the evaluation of the operation of large-scale projects in Europe, their interim outputs (such as patents and models), final outputs (such as improved products), and long-term impacts (such as impacts of products on economy and society). Shapira et al. [1996] use methods such as interview of the project manager, on-site visit, and literature review to develop evaluation methods commonly used in U.S. industry modernization projects; for example, consumer evaluation, external review, audit, and industry surveys. Hong et al. [2009] use the network analysis method to evaluate the results of large technology projects subsidized by the Korean government, and to divide the evaluation indicator into three dimensions: technology, economy, and society.
Volume 9, Number 4, December 2014
3. FOREIGN CASE STUDY
This section, through case study, introduces functions and modes of performance evaluation platforms in the United States and Canada, and discusses platform features such as the design of indicator fields, information value-added and feedback, and interim monitoring.
3.1. Performance Evaluation Platforms in the United States
To ensure that government funding can produce corresponding social benefits, the advanced technology program (ATP) in the U.S. performed necessary and long-term tracking of various programs, and, in 1993, established the business reporting system (BRS). By using BRS, the Economic Assessment Office (EAO) of the National Institute of Standards and Technology (NIST) is the main executive unit to perform management, tracking, and evaluation of various programs. The design of BRS has replaced the past performance evaluation surveys conducted by other units with the gathering of information relevant to ATP performance by ATP employees so as to ensure the timely return of the contents of performance reports required by GPRA.
As shown in Table 1, BRS includes four types of routine surveys using four types of online closed questionnaires; namely, (1) the baseline report; (2) quarterly short-form report and anniversary report; (3) close-out report; and (4) post-project report. Using the information on ATP programs collected by the questionnaires, BRS can measure short-term benefits; monitor commercialization progress and long-term benefits of each project; and create a database to measure long-term economic benefits [Powell, 1996].
The BRS platform contains the following features:
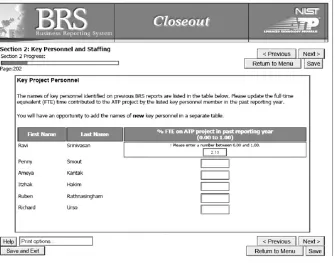
1. Online-check function, which is executed when users fill out their questionnaires online, can be divided into sum check and range check, as shown in Figure 2.
2. Back-end checking, which is executed after the completion of the questionnaire, includes frequency review and outlier evaluation. Frequency review means checking whether page jumping is in compliance with the rules, and outlier evaluation means checking and comparing the extreme values.
International Journal of Business and Information
Table 1
NIST-ATP Management Mechanism
Questionnaire Purpose
Baseline Report
To disclose for future reference information on technology development and commercialization planning for ATP- subsidized programs, including background information on companies as program implementers and their planning with regard to quantified goals such as quality improvement, cost saving, and technology advancement.
Quarterly Short- Form Report & Anniversary Report
To provide information on progress of commercialization, short-term impacts, initial sales revenues, cooperation benefits, creation of new intellectual properties and job opportunities, and timely updates on progress during program implementation.
Close-Out Report
To provide information on the commercialization plan, short-term impacts, revenue from early sales, co-benefits, production of intellectual property, creation of early job opportunities, etc., during program implementation; and to update information on implementation progress in a timely manner. Also, to provide information on any technical and commercial obstacles existing upon program termination, to propose commercial goals for the next five years, and to estimate the possible social benefits in the future.
Post-Project Report
To provide information on the status of development relating to organization, planning, technology, and economy in accordance with the progress and time schedule of the program; and to update current information on the progress of program commercialization, benefits proliferation, and long-term benefits of BRS in a timely manner.
Volume 9, Number 4, December 2014
Figure 2. Design of Range Check on BRS Platform
International Journal of Business and Information
Table 2
Literature Relevant to the Use of Electronic Performance Platform
Author Research Method Dimensions of
Performance Measurement
Powell [1996]
1. Closed questionnaire (Likert scale) 2. Open-ended questions
(journal/ patent)
Short-term benefits (program, direct) Interim benefits (technology, cooperation and commercialization of companies)
Laidlaw [1997]
1. Semi-structured interviews 2. Open-ended questions 3. Close-ended questions
(Likert scale)
Short-term benefits (program, direct) Interim benefits (technology, cooperation and commercialization of companies)
Powell [1997]
1. Closed questionnaire (Likert scale)
Short-term benefits (program, direct) Interim benefits (technology, cooperation and commercialization of companies)
Powell [1999]
1. Close-ended questions 2. Open-ended questions 3. T-test
Short-term benefits (program, direct) Interim benefits (technology, cooperation and commercialization of companies)
Long [1999]
1. Case study
2. Bibliometrics (journal/ patent)
Short-term benefits (program, direct) Interim benefits (technology and commercialization of companies) Long-term benefit (spill-over effect, industrial benefits, national benefits)
Ehlen [1999]
1. Regional economic model 2. Determine the variation of quantified data prior to and after the FCM program
Interim benefits (technology of companies)
Long-term benefit (spill-over effect, industrial benefits, national benefits)
Volume 9, Number 4, December 2014
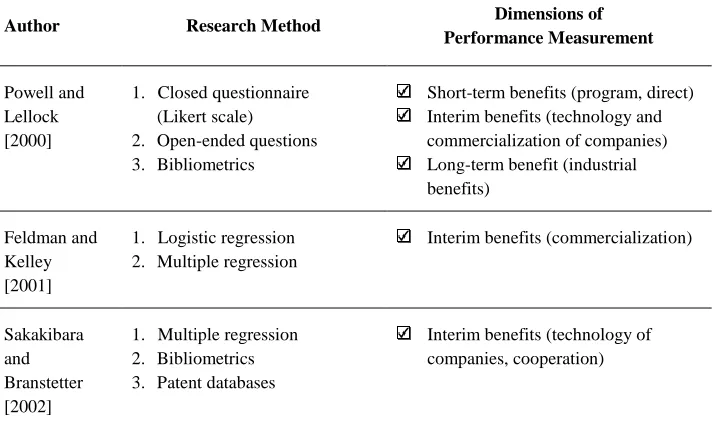
Table 2 (Cont’d)
Literature Relevant to the Use of Electronic Performance Platform
Author Research Method Dimensions of
Performance Measurement
Powell and Lellock [2000]
1. Closed questionnaire (Likert scale) 2. Open-ended questions 3. Bibliometrics
Short-term benefits (program, direct) Interim benefits (technology and commercialization of companies) Long-term benefit (industrial benefits)
Feldman and Kelley [2001]
1. Logistic regression 2. Multiple regression
Interim benefits (commercialization)
Sakakibara and Branstetter [2002]
1. Multiple regression 2. Bibliometrics 3. Patent databases
Interim benefits (technology of companies, cooperation)
3.2. Performance Evaluation Platforms in Canada
Demand for performance evaluation from the public sector originates primarily from administrative management [Davis et al., 2006]. Canadian e-government performance evaluation is a good example. Prior to its establishment, public policy and the service efficiency of the Canadian government were often questioned by the public. To address this issue, the government created an online platform to publicize its policies, annual policy address, and S&T programs or measures. This information allows the Canadian public to better understand the estimated goals and actual performance of these programs and policies, and further improve the quality of government service and its public satisfaction.
International Journal of Business and Information
results, and the performance of public services so that various departments can manage more effectively and so that managers can better understand the status and report the results to the public. IPR is used by each department to report annually to Parliament the performance outcomes of the previous year and estimated future priorities. The expenditure review process established a review committee to ensure that taxes are under strict regulation and are properly used for prioritized public services associated with the public welfare.
In cooperation with the Accenture multi-national company, the Canadian government established a results-oriented evaluation mechanism in which three evaluation methods are used as a reference for evaluation performance; namely, third-party assessments, departmental self-assessments, and citizen/client feedback.
A number of functions in Canadian e-government performance evaluation have been strengthened.
First, user security (privacy) during the program application stage has been given greater emphasis. In response to the requirements of the Information Protection Act, the Canadian government has set up privacy impact assessment guidelines. The guidelines are similar to risk management practices, which include planning, analysis, and training activities. The guidelines comprise four procedures:
(1) decide the scope of implementation and required tools through preliminary PIA;
(2) describe the status of personal data flow by using information gathering, transaction process, and transaction result, respectively;
(3) identify the risks and weaknesses of personal information protection by using questionnaires and checklists; and
(4) produce an analysis report of impacts on personal information protection, based on the three preceding procedures.
Volume 9, Number 4, December 2014
Second, the design of interim monitoring and evaluation during program implementation has been improved. Items to be evaluated include the following:
1. What is the status of program implementation and its progress?
2. Does the department itself have the ability to perform self-evaluation?
3. How long does it take to complete the program goals?
4. Are there any short-term or long-term challenges existing after policy or program implementation?
5. Can the information produced by evaluation be used as a decision-making reference?
6. Is the information helpful in improving the design of policies, programs, or measures?
Interim evaluation reports are submitted to the Center of Excellence for Evaluation (CEE) for further review and recommendations.
International Journal of Business and Information
Source: Public Works and Government Services, Canada
Figure 3. Information Collection Statement, User Feedback Page, Service Canada
Source: Public Works and Government Services, Canada
Volume 9, Number 4, December 2014
4.
DEVELOPMENT OF THE PPMP
This section describes the framework of the Program Performance Monitoring Program (PPMP), discusses the computing components, and presents the building program performance measures.
4.1. The Framework of the PPMP
The Program Performance Monitoring Platform (PPMP) is a program monitoring tool that contains a list of science and technology program performance measures. As shown in Figure 5, important program data are manually imported to the database by various program managers through a Web-based interface that provides users with the following options:
Enter new program basic information and details (Figure 6).
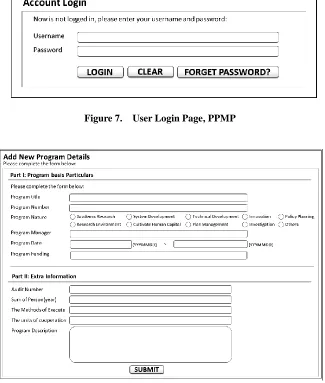
Regularly fill in program output data in standard forms (Figure 7);
Plot different forms of graphs: measures, comparison, and overall (Figure 8).
Audit the program progress online regularly.
Search program data and status of program execution.
Track and manage the data of long-term program performance.
International Journal of Business and Information
Figure 5. Framework for the PPMP
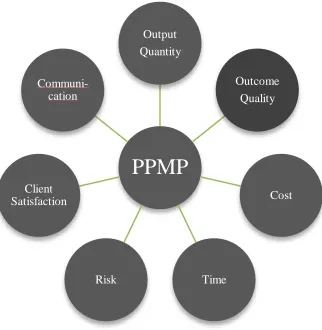
Figure 6. Performance Measure Dimensions of the PPMP
PPMP Output Quantity
Outcome Quality
Cost
Time Risk
Client Satisfaction
Volume 9, Number 4, December 2014
Figure 7. User Login Page, PPMP
Figure 8. New Program Details, PPMP
4.2. Computing Components of the PPMP
International Journal of Business and Information
4.2.1. Programming
Establishment of the PPMP requires a database support, a stable Internet connection, and a security system. The Java language has significant advantages that make it suitable for establishing the PPMP. First, Java is easy to learn and is object-oriented, which means that a programmer can create modular maintainable applications and reusable code. Second, Java considers security as part of its design, which means that both the language and the platform are designed from the ground up with security in mind. It allows users to download untrusted code from a network and run it under a secure environment. Third, Java provides a robust performance. It is an elegant language combined with a powerful and well-designed set of APIs. Using sophisticated JIT compilers, Java programs can execute at speeds comparable to the speeds of native C and C++ applications. Finally, the greatest advantage of Java is its ability to move easily from one system to another. It is integrated, or is being integrated, into practically all major operating systems (e.g., PDAs, cell phones, television set-top boxes, and virtually every Internet-connected PC in the world). Because of Java's several advantages – namely, simplicity, convenience, security features, and cross-platform capabilities – it has become the advanced programming language for the PPMP.
4.2.2. Database Backend – Oracle 10g (Enterprise Edition)
To support the use of PPMP in constructing a database, a structures data collection and retrieval system is needed. In the current study, an open-source database known as Oracle has been used. Oracle is an object-related database management system produced and marketed by Oracle Corporation. An Oracle database system identified by an alpha-numeric system identifier (SID) contains at least one instance of the application, along with data storage. For example, it identifies persistently by an instantiation number that contains a set of operating system processes and memory structures that interact with the storage. Oracle documentation can refer to an active database instance as a shared memory realm. The following list describes some of the key characteristics of the Oracle 10g database:
Volume 9, Number 4, December 2014
Partitioning: Newer versions of the database can also include a partitioning, which allows the partitioning of tables based on different sets of keys. Specific partitions can then be easily added or dropped to help manage large data sets.
Monitoring: Oracle database management tracks its computer data storage with the help of information stored in the system table space. The system table space contains a data dictionary, which consists of a special collection of tables that contains information about all user-objects in the database. The dictionary always indexes and clusters by default.
4.2.3. Operating System – Red Hat Enterprise Linux 4 (HA Framework) To ensure the effective management of computer resources, the Red Hat Enterprise Linux 4 was applied as the framework for the foregoing purposes. This system is a commercially supported derivative of Fedora, which is tailored to meet the requirements of enterprise customers. Following are some of the key characteristics of the Red Hat Enterprise Linux 4:
More stable and robust based on Linux 2.6 kernel infrastructure: Red Hat Enterprise Linux 4 provides the most stable and robust commercial product based on the Linux community's 2.6.9 kernel. Open-source projects like Fedora provided an environment for the Linux 2.6 kernel to mature significantly during 2004.
Improved storage and file system capabilities: Numerous enhancements have been incorporated into Red Hat Enterprise Linux 4, which improve the scale and performance of data storage subsystems.
New security capabilities: Provision of sophisticated security capabilities has been a specific development focus of the Red Hat Enterprise Linux 4 release.
International Journal of Business and Information
4.2.4. Information Security Measures
PPMP information security measures can be divided into the following categories:
1. Database encryption: Two-key cryptosystems (namely, non-symmetric ciphers) may protect confidential information and streamline issues regarding key distribution and management.
2. Information security reporting system: The system will notify the administrator immediately upon occurrence of anomalies during data downloading or query.
3. System log: Records on a regular basis the information on each action of data processing performed by the users after login, such as execution date, data import and export, and addition of new queries.
4. Webpage SSL encryption.
4.3. Building Program Performance Measures
Implementation of KPIs involves three major steps: (1) decision on what to measure; (2) on-line data collection; and (3) feedback evaluation results. Recommendations for these steps are discussed in the following paragraphs, based on reference to some foreign cases and collection of opinions from domestic and foreign experts.
4.3.1. Decision on What To Measure
After consultation with 12 program management specialists, the current study identified seven critical program performance measure dimensions (as shown previously in Figure 6); namely, output quantity, outcome quality, cost, time, risk, client satisfaction, and communication. These seven dimensions are the basis for design of the key performance indexes and measure ambit. For each performance index, there are sub-performance indexes. The overall program performances are displayed in the collective effect of all measure dimensions.
Volume 9, Number 4, December 2014
innovation, industrial and economic development, promotion of social welfare, environmental security and protection, and science and technology policy management.
2. Outcome Quality: Used to measure the outcome, derivative value, and contribution of medium- and long-term indirect outcomes. These are relatively difficult to quantify for the purpose of confirming the extent of completion of program goals and their derivative benefits. The evaluation is focused on the merits of program goals, the progress of key technologies, and their potential impacts and benefits.
Performance indexes of the outcome (its long-term overall social and economic benefits, in particular) usually require more time in order to examine the substantial results and are rather difficult to obtain using statistical data from existing industries. Thus, we suggest that, to ensure an objective evaluation of the impacts and benefits of S&T policies to the industries, society, and the economy, a complete tracking and analysis report should be made periodically through the execution of programs and the application of PPMP. Collection of relevant data can be divided into three levels: (1) statistical items that can be carried out upon the completion of short-term program goals of the same year; (2) statistical items (in each year and over the years) that require periodic inquiries or interviews of partners; and (3) statistical items that are reasonably filtered and selected by professionals based on the overall statistical data from government and research institutes, such as data concerning import and export, and overall business survey.
International Journal of Business and Information
4. Time: It is crucial for program managers to set up an appropriate monitoring frequency in order to observe the variation of programs during a specific period. According to the experts, time for monitoring activity can be divided into four categories: (1) program start time; (2) estimated time for achieving milestones; (3) time for evaluation of interim program outputs, and (4) time for evaluation of impacts and benefits after program completion.
5. Risk: Risk monitoring comprises four crucial elements: (1) consistency between program goals and policies; (2) inspection and consideration of funding lists; (3) implementation rate and adjustment of program; and (4) replacement of the principal investigator (PI).
6. Client satisfaction: The client satisfaction dimension is used to ascertain the stakeholders’ degree of satisfaction with program performance. Performance indexes can be divided into program output, program manager, and program implementer.
7. Communication: The communication dimension is designed to show the frequency and effectiveness of communication among program participants. Relevant performance indexes include number of meetings held, the number of requests for information, amount of cooperation with partners, and number of international exchanges.
4.3.2. On-Line Data Collection
With regard to this activity, the user should first enter his or her account name and password (as shown previously in Figure 7). On the default screen, different functions and interfaces are provided, according to different user IDs. The PPMP groups users into four identity types: program applicant, program examiner, platform manager, and expert adviser.
Volume 9, Number 4, December 2014
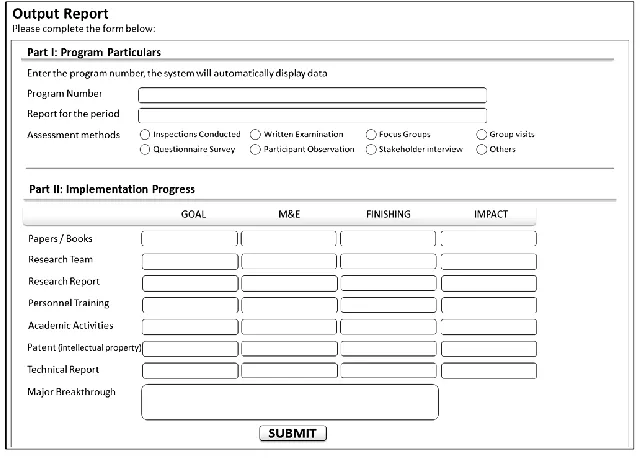
After successfully completing the program details, appraisees are required to complete online mid-term evaluation reports. As shown in Figure 9, report fields include: estimated goals, performance indexes, checklist, and methods of data collection. Any decision-making must consider how to acquire necessary data through every channel and how long it will take to do this. Methods of data collection include on-site visits, questionnaires, focus group interviews, and participation and observation. As to which method should be applied for data collection, there is still no common answer to the question, nor is there consensus regarding which evaluation units should be contemplated based on several perspectives, such as organizational resources, program scale, and time limit. Key elements of performance indexes are quality, quantity, cost, time, risk, communication, and customer satisfaction.
Figure 9. Input Screen for Quality Performance Indicators
4.3.3. Feedback Evaluation Result
Most platform users in the current study said that the existing S&T program information system does not provide enough information and that it lacks diversified means of query. For example, the GRB information platform
International Journal of Business and Information
Thus, to effectively provide feedback for performance-related information, the PPMP not only strengthened data value-added analysis, but also provided real-time graphical presentation. Based on foreign design and on expert advice, the current study identified the following features pertaining to PPMP performance information feedback and value-added:
1. Overall Summary Report. This report allows program sponsors and consultants to review the performance quality of the overall program, including the basic material, purpose and estimated goals, status of goals completion, quantified research outcomes, and future promotion of these outcomes. For example, for a specific period, a person may view the number of evaluation reports received or significant achievements or breakthroughs from the overall S&T program.
2. Program Comparison. The PPMP allows users to compare data within and/or between programs. Programs can be compared across different years, months, performance indexes, and program categories using a comparison chart to depict the relative performance of different programs at different time points.
3. Cross-Goal Queries and Statistics. A single project often has multiple goals in order to allow policy-makers to understand the status of completion of these goals. The establishment of a cross-goal query system may allow the user to examine performance indexes and outcomes of cross-goal programs. Meanwhile, features selected by the users are filtered to make charts that compare multiple goals wherein program goals, organizational goals, program evaluation outcomes, and organizational evaluation outcomes can be adequately linked for comparative analysis.
4. Platform Trends Survey. Platform trends may provide information about which contents are frequently browsed, which types of activities are frequently performed, which types of program outcomes are frequently viewed and downloaded, and which types of Web pages are most often clicked. Users may refer to the trend survey to browse Web sites more rapidly and collect the information they need.
Volume 9, Number 4, December 2014
establishment of indicators to evaluate and quantify user satisfaction allows for the collection of meaningful and valuable feedback or assessment of the PPMP system and for a more thorough understanding of the degrees of user satisfaction regarding the platform.
5.
CONCLUSION AND DISCUSSION
The Program Performance Monitoring Platform (PPMP) focuses on data collection and performance evaluation of research programs in order to facilitate regular tracking of execution progress and to make such information available to platform managers or PIs. The main characteristic of the PPMP is its ability to offer different platform interfaces and functions to different types of users. These functions include data transmission, schedule reminders, data upload, record query and link, online assessment, and information security, among others. It also allows users to submit online opinions and feedback as the reference for future improvement of the platform. User-friendly interfaces not only strengthen the connection between different platforms (such as review or GRB) that belong to different government units, but also promote data search, exchange, and diversified presentation of program results simultaneously, while avoiding the repeated filing of performance information by appraisees (PIs). In addition to common performance indexes quantifying outputs, qualitative performance indexes covering the dimensions of risk, customer satisfaction, and communication are also added to outline the overall performance and impact of programs. The PPMP makes the operating procedures of performance evaluation more efficient and effective.
There are, however, a number of disadvantages and restrictions associated with the PPMP.
International Journal of Business and Information
Third, the PPMP still lacks an evaluation method for interdisciplinary programs. This lack may result in conflicts of interest and cause some to question or challenge the objectivity of evaluation results.
The current study makes the following recommendations pertaining to future development of the PPMP:
1. The system and related information should be dynamically adjusted at any time to make new mechanisms available for use in combination with the original evaluation framework, and to gradually increase the scope and content of the PPMP.
2. Principal investigators in the same fields or industries should jointly fill out and submit information to the Working Group Web page in order to optimize program results queries and to help users locate contents and details of all relevant reports simply by clicking options of specific industries.
3. System settings should prevent any premature disclosure of data so as to protect the achievements of researchers.
4. After program termination, principal investigators for each program should periodically report their program results and impacts to the PPMP and should establish an incentive mechanism to help track follow-up results of their programs.
5. Qualitative performance indexes adequate to evaluate the need to perform follow-up tracking should be established and implemented.
6. For interdisciplinary programs, opinions provided by experts from different fields should be used to establish evaluation methods that help evaluate the reliability and validity of program results.
The question of whether small programs – regardless of the obstacle of limited funding – would need an interim monitoring mechanism like those designed by the PPMP is pending further assessment.
REFERENCES
Volume 9, Number 4, December 2014
Cetron, M.J.; J. Martino; and L. Roepche. 1967. The selection of R&D program content-survey of quantitative methods, IEEE Transactions on Engineering Management EM-14(1), 4-13.
Ehlen, M.A. 1999. Economic impacts of flow-control machining technologies: Early applications in the automobile industry, National Institute of Standards and Technology (NISTIR 6373), Gaithersburg, MD.
Feldman, M., and M. Kelley. 2001. Winning an award from the Advanced Technology Program: Pursuing R&D strategies in the public interest and benefiting from a halo effect (NISTIR 6577). Gaithersburg, MD: National Institute of Standards and Technology.
Gear, A.E.; A.G. Lockett; and A.W. Pearson. 1971. Analysis of some portfolio selection models for R&D, IEEE Transactions on Engineering Management EM-18(2), 66-76.
Georghiou, L. 1999. Socio-economic effects of collaborative R&D – European experiences, Journal of Technology Transfer 24, 69-79.
Hong, D.; E. Suh; S. Kim; J. Kim; and S. Lee. 2009. Development of a new model for evaluating a large-scale R&D project using ANP, APIEM: 1321-1332.
Hsu, Y.G.; G.H. Tzeng; and J.Z. Shyu. 2003. Fuzzy multiple criteria selection in government-sponsored frontier technology R&D projects, R&D Management 33: 539-551.
Huang, C.C.; P.Y. chu; and Y.H. Chiang. 2008. A fuzzy AHP application in government-sponsored R&D project selection, OMEGA 36: 1038-1052.
Krawiec, F. 1984. Evaluating and selecting research projects by scoring, Research Management 27: 21-25.
Laidlaw, F.J. 1997. Acceleration of technology development by the Advanced Technology Program: The experience of 28 projects funded in 1991, National Institute of Standards and Technology (NISTIR 6047), Gaithersburg, MD.
Lockeet, G.; B. Hetherington; and P. Yallup. 1986. Modeling a research portfolio using AHP: A group decision process, R&D Management 16: 151-160.
Martino, J.P. 1995. R&D Project Selection, New York: John Wiley & Sons Inc. Moore, J.R., and N.R. Banker. 1969. Computational analysis of scoring models for
R&D project selection, Management Science 16: 212-232.
Powell, J.W. 1996. The ATP's business reporting system: A tool for economic evaluation, Conference on Comparative Analysis of Enterprise Data, Helsinki Finland.
International Journal of Business and Information
Powell, J.W., and K. Lellock. 2000. Development, commercialization, and diffusion of enabling technologies: Progress report, National Institute of Standards and Technology (NISTIR 6491), Gaithersburg, MD.
Revilla, E.; J. Sarkis; and A. Modrego. 2003. Evaluating performance of public-private research collaborations: A DEA analysis, Journal of the Operational Research Society 54: 165-174.
Saaty, T.L. 1980. The Analytic Hierarchy Process: Planning, Priority, Setting Resource Allocation, New York: McGraw-Hill.
Sakakibara, M., and L.B. Branstetter. 2002. Measuring the impact of ATP-funded research consortia on research productivity of participating firms: A framework using both U.S. and Japanese data (NIST GCR 02-830). Gaithersburg, MD: National Institute of Standards and Technology.
Souder, W.E. 1972. A scoring methodology for assessing the suitability of management science models, Management Science 18: 526-543.
Wei, C.C.; C.F. Chien; and M.J. Qang. 2005. An AHP-bases approach to ERP systems selection, International Journal of Production Economics 96: 47-62.
ABOUT THE AUTHORS
Fang-Yu Yeh is associate researcher fellow at the Science and Technology Policy Research and Information Center at the National Applied Research Laboratories in Taiwan. She received a Ph.D. in business and management from National Chiao Tung University, Taiwan. Her research interests focus on energy efficiency and performance monitoring and evaluation for science and technology programs and offshore wind energy development of bench-marking countries.
Jin-Li Hu is professor at the Institute of Business and Management at National Chiao Tung University. He received a B.S. degree in industrial engineering/economics from National Tsing Hua University and a Ph.D. in economics from the State University of New York at Stony Brook in USA. His research interests include Chinese economies, decision science, and sustainable development. He was honored as the 2012 Asia's Best Professor in Economics and the 2013 Elsevier Excellence in Reviewing.
Yun-Chih Tsai is employed at the CPC Corporation in Taiwan. She received a B.S.