Atmos. Meas. Tech., 7, 1943–1955, 2014 www.atmos-meas-tech.net/7/1943/2014/ doi:10.5194/amt-7-1943-2014
© Author(s) 2014. CC Attribution 3.0 License.
Evaluation of a two-step thermal method for separating organic and
elemental carbon for radiocarbon analysis
U. Dusek1,3, M. Monaco1, M. Prokopiou1, F. Gongriep1, R. Hitzenberger2, H. A. J. Meijer3, and T. Röckmann1
1Institute for Marine and Atmospheric research Utrecht (IMAU), Utrecht University, Utrecht, the Netherlands 2University of Vienna, Faculty of Physics, Boltzmanngasse 5, 1090 Vienna, Austria
3Centre for Isotope Research (CIO), Energy and Sustainability Research Institute Groningen (ESRIG),
University of Groningen, the Netherlands
Correspondence to: U. Dusek ([email protected])
Received: 29 October 2013 – Published in Atmos. Meas. Tech. Discuss.: 14 January 2014 Revised: 7 May 2014 – Accepted: 9 May 2014 – Published: 3 July 2014
Abstract. We thoroughly characterized a system for ther-mal separation of organic carbon (OC) and elemental car-bon (EC) for subsequent radiocarcar-bon analysis. Different or-ganic compounds as well as ambient aerosol filter samples were introduced into an oven system and combusted to CO2
in pure O2. The main objective was to test which
combus-tion times and temperatures are best suited to separate OC and EC. The final separation step for OC was combustion at 360◦C for 15 min. Combustion at this temperature proved
enough to remove several organic test substances from the fil-ter (including high molecular weight humic acid) but did not remove substantial amounts of EC. For isolation of EC, OC first needs to be completely removed from the filter. This was achieved by water extraction of the filter, followed by com-bustion of the water insoluble OC at 360◦C and combustion at an intermediate temperature step of 2 min at 450◦C. This last step removed the most refractory OC together with some EC. Finally, the remaining EC was combusted to CO2 at
650◦C. The recovery of black carbon after the intermediate 450◦C step was approximately 80 %. Several tests provided strong evidence that OC was removed efficiently during the intermediate temperature step: (i) brown carbon, indicative of refractory OC, was removed; (ii) the fraction modern of EC did not decrease significantly if the temperature of the intermediate step was further increased. Based on tests with various organic compounds, we estimated that charred or-ganic carbon could contribute 4–8 % to an elemental carbon sample that was isolated according to our method.
1 Introduction
Radiocarbon (14C) measurements allow to distinguish fos-sil from contemporary carbon sources of carbonaceous aerosol and have therefore become an important method of source apportionment (e.g., Currie, 2000; Szidat et al., 2006, 2007, 2009; Gelencser et al., 2007; Schichtel et al., 2008; Minguillon et al., 2011; El Haddad et al., 2011; Genberg et al., 2011; Gilardoni et al., 2011; Glasius et al., 2011; Dusek et al., 2013). This method exploits the fact that the radioac-tive carbon isotope14C is not present in fossil fuels, whereas it is present at a typical contemporary level in carbonaceous material that derives from living biomass. The contemporary
14C level is maintained by the production of14C from the
ab-sorption of thermal neutrons, generated by cosmic ray show-ers, by N2, mainly in the upper troposphere and stratosphere.
The produced 14C is quickly oxidized via CO to 14CO2,
which is taken up by the biosphere. Therefore a character-istic14C /12C ratio is established for the biosphere, which is closely linked to the atmospheric14C /12C ratio (Levin et al., 2010). In organic material that does not exchange CO2with
the atmosphere (e.g., fossil fuel), the14C isotope decays with the characteristic half-life of 5730 years (Godwin, 1962).
The 14C /12C ratio of a sample is always reported
F14C= 14C
12C(sample) 14C 12C(1950)
. (1)
The 14C /12C ratio of the sample and the standard are both corrected for machine background and normalized for frac-tionation toδ13C =−25 ‰. The standard is not corrected for decay since the year 1950.
The main sources of carbonaceous aerosol, fossil fuel burning, formation of biogenic secondary organic aerosol (SOA), and biomass burning, have distinct F14C values. In fossil fuels, which have been buried for much longer peri-ods than the14C half-life, all14C has decayed andF14C is therefore 0. F14C of the current atmospheric or living bio-spheric carbon would ideally be around 1. However, atmo-spheric 14C levels have been altered by anthropogenic pro-cesses, in particular by the nuclear bomb tests in the 1960s and emission of fossil CO2, which does not contain14C.
Nu-clear bomb testing almost doubled the 14C levels in the at-mosphere, but since the stop of the bomb testsF14C of at-mospheric CO2has decreased steadily and is currently
esti-mated atF14C∼1.04 (Levin et al., 2010). As a consequence, primary and secondary particles from biogenic origin have
F14C∼1.04. Aerosols from wood combustion have a vari-able F14C > 1.04, depending on the age and origin of the wood. Most of the wood burned today was grown over the last 20–60 years, when 14C levels were elevated in the at-mosphere, following the nuclear bomb tests. Estimates based on tree growth models (e.g., Lewis et al., 2004; Mohn et al., 2008) give a range from 1.08 to 1.30 for biomass burning aerosols (Szidat et al., 2006, 2007, 2009; Minguillón et al., 2011; El Haddad et al., 2011; Genberg et al., 2011; Gilardoni et al., 2011).
The carbonaceous aerosol is often operationally subdi-vided in carbon fractions that comprise classes of carbona-ceous material with similar properties. One of the most com-mon sub-divisions aims to separate organic carbon from more refractory carbon components that are usually com-bustion derived and often referred to as soot, elemental, or black carbon. Organic carbon is assumed to consist pri-marily of individual organic molecules that are not or only weakly light absorbing and cover a great range of volatil-ities. On the other hand, a universal definition of elemen-tal carbon, black carbon or soot is not agreed on in the lit-erature and what is meant by these terms is often depen-dent on the analytical method or the context of the research (e.g., Petzold et al., 2013). This ambiguity is mostly caused by the fact that a clear distinction between organic and ele-mental carbon does not exist, but rather a continuous tran-sition through more and more complex aromatic structures (e.g., Pöschl, 2005; Hammes et al., 2007). These include tars, chars, amorphous-like carbon consisting of randomly oriented poly-aromatic layers (e.g., Gustafsson et al., 2001) and finally carbon nanospheres, which are quite thermally
refractory and strongly light absorbing (e.g., Ishiguro et al., 1997). These carbon fractions show gradually lower H / C and O / C ratios (e.g., Hammes et al., 2007), higher thermal refractivity and generally increasing light absorption. Petzold et al. (2013) suggest the use of the term “EC”, with respect to the refractory component determined by thermal(-optical) methods.
Despite a lack of a clear separation between these frac-tions, the division into refractory and organic carbon is still useful for source apportionment. The thermally refractory carbon in aerosols is more likely to be combustion derived, even if some of the less refractory parts of the EC continuum, such as chars, are included. If the separation is pragmati-cally set at a point in the EC continuum that includes only refractory combustion derived carbon into EC, performing
14C analysis on EC and OC separately can help distinguish
biomass burning and fossil fuel sources of aerosol carbon. Since EC does not contain any secondary carbon, which ally has a strong contribution from modern sources, EC usu-ally has a lowerF14C than OC in most ambient samples.
The main challenge remains to isolate combustion-derived EC as completely as possible from organic material for
14C analysis. The most common solutions for isolating EC
(e.g., Szidat et al., 2004; Zhang et al., 2012; Bernardoni et al., 2013) are based on the thermal method by Cachier et al. (1989). In these methods, organic material is volatilized and oxidized to CO2during a low temperature step (S1) in
pure oxygen. Then one or more intermediate steps, possibly in different atmospheres, are used to remove the most refrac-tory OC together with the less refracrefrac-tory part of the EC con-tinuum. In this work we used one intermediate step in pure oxygen (S2) and finally, a high temperature step (S3) in pure oxygen is used to oxidize the most refractory carbon to CO2.
The CO2isolated in step S1 is assumed to be representative
of organic carbon (OC). The remaining material burnt in step S3 will be called “refractory elemental carbon” (ECr)in this
work.
In practice there are several artifacts that can lead to in-complete separation of OC and EC: (1) refractory organic material remaining after S1 and S2, for example biological particles; (2) charring and pyrolysis of organic compounds during S1 and S2, which produce material that is insepa-rable from the elemental carbon that was contained in the particles originally; (3) premature loss of refractory carbon during steps S1 and S2 through catalytic reactions. The first two mechanisms transfer organic material into the extracted refractory carbon, and therefore usually biasF14C(ECr)
U. Dusek et al.: Evaluation of a two-step thermal method 1945
method that was first proposed by Szidat et al. (2004). Our method was developed roughly in parallel with two other re-cently published methods (Zhang et al., 2012; Bernardoni et al., 2013) and used to analyze a large set of aerosol filter samples collected in the Netherlands. The evaluation of the current method will be also be compared to these two other methodological studies.
2 Materials and methods 2.1 System description
The system used for thermal separation of OC and EC at IMAU is shown in Fig. 1. It can be divided into two sub-systems: (1) the extraction line, where the combustion of the aerosol samples and the CO2 formation occurs and (2)
the CO2purification line, where the carbon dioxide is
col-lected, purified and stored. These two parts are separated by a needle valve (D) that regulates the flow through the reaction tube (usually 30–50 mL min−1). The needle valve keeps the pressure in the extraction line high, at roughly 1150 mbar, whereas the pressure in the second part is kept below 20 mbar, in order to prevent condensation of O2in the
cryogenic traps.
The first part of the system, the reaction tube, is made from quartz glass and surrounded by three ovens (C). The tube can be opened and a movable sample holder can be inserted. This filter holder can be moved either into the first or the second oven. The first oven is kept at a temperature below 400◦C and used for OC combustion. The second oven is for EC combustion. In the third oven, remaining incomplete com-bustion products are oxidized to CO2over a platinum catalyst
at 650◦C.
The reaction tube is connected to two gas lines that provide pure helium (He) or oxygen (O2). The first is an inactive gas
used to clean the system before sample extraction, whereas O2 is introduced for the combustion reaction and CO2
for-mation. Before reaching the reaction tube, these gases are purified. For flushing of the extraction tube these gases can be directed by valve E directly to the vacuum pump. In this setting of valve E the CO2purification line is disconnected
from the extraction line.
For collection of a CO2 sample, valve E is switched and
the gases are directed via valve F to the first cryogenic trap (1) and further via valve G to the glass line and vacuum pump. The cryogenic trap is cooled with liquid nitrogen and CO2 and other gases with sufficiently low vapor pressure
are collected, whereas O2and gases with higher vapor
pres-sures are pumped away. At the end of the collection process, valve E is switched to disconnect the purification line from the extraction line and trap 1 is warmed to release the col-lected CO2. By switching valve F the released CO2is flushed
with He through the Cu reduction oven to remove traces of NOx. The water trap after the reduction oven is cooled to
30
Figures
Figure 1. The EC-‐OC separation system consists of two sub-‐systems: (1) the extraction tube
(green box), where organic and elemental carbon are oxidized to CO2 and (2) the purification line
(blue box), where CO2 is collected and separated from interfering gases. By switching three-way
valve E to the low vacuum pump the purification line can be separated from the extraction tube.
Figure 1. The EC-OC separation system consists of two
sub-systems: (1) the extraction tube (green box), where organic and el-emental carbon are oxidized to CO2and (2) the purification line (blue box), where CO2is collected and separated from interfering gases. By switching three-way valve E to the low vacuum pump the purification line can be separated from the extraction tube.
−70◦C using a dry ice-ethanol mixture. The CO
2is collected
in cryogenic trap 2. After closing of valve F and evacuation of the purification line, the CO2can be released from this trap
into the glass line. The glass line consists of different com-ponents: a flask containing phosphorous pentoxide (P2O5)
to remove any remaining traces of H2O vapor, a calibrated
volume with pressure sensor for a manometric determination of the amount of CO2, and sample tubes, where the CO2is
stored until the14C analysis.
2.2 Measurement protocol
Before an experiment is started, a sample is inserted into a movable filter holder and placed in the reaction tube. After flushing with He and O2the sample is introduced into one of
the ovens. For total carbon (TC) combustion the filter piece is directly inserted into oven 2 and heated to 650◦C for 15 min. The organic carbon (OC) combustion is done in oven 1, usu-ally at 340◦C or 360◦C for 15 min, but a range of possible parameters is evaluated in this work. After this step, EC is isolated. The protocol for the EC isolation is the main focus of this work and will be discussed in detail in Sect. 3.
2.3 Preparation of test filters
separation. We used organic compounds and mixtures that represent typical components of the ambient organic aerosol: Glucose (alpha–D-Glucose, anhydrous, 96 %, Aldrich), Hu-mic acid (Aldrich), a hydrocarbon standard mix (AccuStan-dard DRH-002S-R1), a fatty acid methyl ester (FAME) mix (Suppelco47885-U), and a non-volatile organic acid standard mix (Suppelco 46985-U). These organic compounds were applied to pre-heated quartz fiber filters of the same type that is used for collection of ambient aerosol samples. Small amounts (50–500 µL) of the three liquid organic mixes were directly pipetted onto the filter. The filters were analyzed af-ter a short drying to evaporate the solvent (chloroform). Glu-cose was applied as an aqueous solution (50–100 µL) and the filter was dried before analysis over silica gel for sev-eral hours. In some experiments a commercial carbon black (Elftex 125, Cabot Corporation) was used as a surrogate for EC. The carbon black was pre-heated to 650◦C in air (not
O2)for 2 h to remove adsorbed organic material and a sus-pension of 0.2 g of carbon black in 100 mL of a 20 : 80 % ethanol – deionized water mixture was prepared. 200 mL of this suspension was applied to the filters, which were then dried over silica gel for 24 h.
2.4 14C measurements
The CO2collected from the combustion of various aerosol
fractions was sent to the Centre for Isotope Research (CIO) at the University of Groningen for graphitization and Accelera-tor Mass Spectrometer (AMS) measurement. There CO2was
reduced to graphite on a porous iron pellet (de Rooij et al., 2010) at a temperature of 600◦C in the presence of hydrogen
gas at a molecular ratio of H2/ CO2of 2.5. The water vapor
formed during the reaction was cryogenically removed using Peltier cooling elements. The graphitization yield is usually virtually 100 % for samples larger than 30 µg. The iron pellet was pressed into a 1.5 mm target holder, which was intro-duced into the AMS system for subsequent measurement.
The high-throughput AMS system (van der Plicht et al., 2000) is dedicated to 14C analysis, and measures simulta-neously 13C /12C and 14C /12C ratios. Sample batches are usually analyzed together with varying amounts of refer-ence materials ranging from 50–500 µg C. Two referrefer-ence ma-terials with known 14C content are used: the HOxII stan-dard (F14C = 1.3406) and graphite derived from a14C free CO2 gas (F14C = 0). Contamination during the
graphitiza-tion and AMS measurement causes deviagraphitiza-tions of the mea-sured F14Cvalues from the nominal values. The magnitude of these deviations can be used to quantify the contamination with modern (F14C = 1) and fossil carbon (F14C = 0), which in turn are used for correcting the sample values (de Rooi et al., 2010). The modern carbon contamination is between 0.15 and 0.35 µg C, and the fossil carbon contamination is typically around 1 µg C (Prokopiou, 2010).
2.5 Filter handling
Ambient aerosol samples were also used as test filters. Three filter samples (CA2, CA12, and CA18) were used as test fil-ters for EC recovery. They ware collected at the Cabauw ob-servatory, a regional field site in the Netherlands in the fol-lowing time periods: Filter CA2 – 11 to 14 February 2011; Filter CA12 – 27 February to 1 March 2011; Filter CA18 – 6 to 12 April 2011. Other samples were used to evaluate the final combustion procedure and are more closely described in Table 1. All ambient samples are collected on Whatman quartz fiber filters (QMA 1851-150) using a high volume sampler (Digitel, DHA-80). Before loading, the filters were pre-heated at 800◦C for several hours, then wrapped in pre-heated (500◦C) aluminum foil and stored in sealed polyethy-lene bags at−18◦C until use. Then the filters were placed
into the high volume sampler in a filter holder that was pre-cleaned with ethanol. After sampling the filter was removed from the sampler immediately, wrapped again in clean alu-minum foil and stored at−18◦C in a sealed plastic bag un-til analysis. During the transport to and from the field site (approximately 1 h) the filters were kept at ambient tempera-ture. Blank filters used to determine the contamination intro-duced during handling and storage were treated exactly like the sample filters, except that they were kept in the high vol-ume sampler for one minute only without switching on the sampler.
For analysis circular pieces with a diameter of 3 cm were cut from the filter. The tweezers and cutter were cleaned in acetone followed by ethanol and let dry for at least 10 min before handling the filters. For the separation of refractory carbon the water-soluble carbon was removed from the fil-ter pieces by soaking the pieces in MilliQ wafil-ter overnight (14 mL of water per filter piece) and drying them for 24 h over silica gel. A small fraction of insoluble aerosol material can be lost during the water extraction but this should have little influence on the14C content of the refractory carbon. However, it is recommended that the loss of insoluble ma-terial is monitored e.g., by measuring the absorption before and after water extraction, so that losses can be corrected if necessary.
3 Tests of the OC–EC separation method
3.1 Contamination from filter handling and thermal separation
3.1.1 Test procedure
U. Dusek et al.: Evaluation of a two-step thermal method 1947
the contamination despite pre-cleaning. Therefore, the con-tamination that cannot be eliminated by our filter handling protocol has to be quantified as accurately as possible and subtracted from the carbon concentration of our samples.
We assessed the contamination introduced by the thermal separation system in two ways. The first way is to directly introduce a pre-cleaned filter piece (7.07 cm2)into the ana-lytical system and measure the amount of CO2after all the
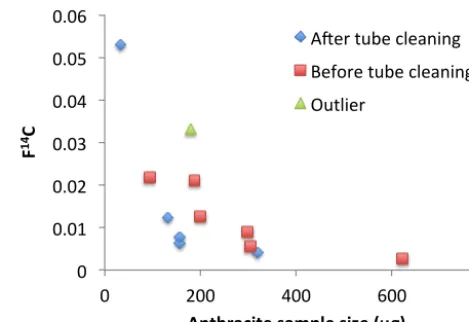
extraction steps detailed in Sects. 2.1 and 2.2. A second, indirect way of inferring the contamination is by combust-ing standard materials with known14C content and measur-ing the deviation from the expected values. Two standard materials (see Sect. 2.4) a HOxII standard and a 14C free graphite powder were put directly onto the sample holder and combusted at 650◦C for 15 min. Figure 2 shows thatF14C measured on anthracite samples deviates from the nominal value of 0 because of contamination during the extraction. Since the contamination adds a roughly constant amount of C to each extraction, the experimentally determinedF14C of small amounts of standard material deviates more strongly from the nominal value than for larger amounts. The actual contamination can be parameterized as a sum of two com-ponents: a modern contamination (Mmc) withF14C(mc)=1 and a fossil contamination (Mfc) withF14C(fc)=0. Then the experimentally determined mass (Mm) after subjecting the
standard material to combustion and purification can be writ-ten as follows:
Mm=Mst+Mmc+Mfc, (2)
where Mst is the carbon mass of the standard that was in-troduced into the ovens. This parameterization has a physi-cal foundation, since contamination with aged, partially de-cayed 14C sources is rare in a laboratory environment and most sources of contamination are either modern carbon or fossil fuel derived. From theF14C values measured in small standard samples we can calculate the mass of modern con-tamination by a simple mass balance equation:
Mm·F14C(m)=Mst·F14C(st)+Mmc·F14C(mc)
+Mfc·F14C(fc), (3)
where Mm is the experimentally determined carbon mass, F14C(m)the experimentally determined fraction modern, and F14C(st)the nominal fraction modern of the standard mate-rial.
Substituting F14C(st)=0 for the anthracite standard and considering thatF14C(fc)=0 andF14C(mc)=1, this equa-tion allows to estimate the mass of modern contamina-tionMmc=F14C(m)·Mm. Once the modern contamination is known,Mfccan be derived from measurements of the HOxII standard by substitutingF14C(st)=1.3406,F14C(fc)=0 in Eq. (3) and combining with Eq. (2):
Mfc=((1.3406−F14C(m))·Mm
−(1.3406−1)·Mmc)/1.3406. (4)
31
Figure 2. The experimentally determined F14C of the anthracite standard (nominal F14C = 0) as a
function of sample size. The blue diamonds correspond to samples measured after a new protocol
for cleaning the reaction tube was introduced, the red squares before the new protocol. An outlier is
shown in green. 0" 0.01" 0.02" 0.03" 0.04" 0.05" 0.06"
0" 200" 400" 600" 800"
F
14C%
Anthracite%sample%size%(µg)% A,er"tube"cleaning" Before"tube"cleaning" Outlier"
Figure 2. The experimentally determinedF14C of the anthracite standard (nominalF14C = 0) as a function of sample size. The blue diamonds correspond to samples measured after a new protocol for cleaning the reaction tube was introduced, the red squares before the new protocol. An outlier is shown in green.
3.1.2 Results
The direct determination of the contamination from blank fil-ter analysis yields usually around 1–2 µg of carbon/sample for organic carbon (OC) and extracted refractory carbon (ECr), which includes all the contamination introduced by filter cutting and handling. This contamination is not in-creased by subjecting a clean filter to the water extraction procedure, described in Sect. 2.2. Field blank filters yield on average the same amount of OC and a slightly higher amount of ECr of 2 µg C/sample. The latter does not
de-pend strongly on the filter area used. For a typical filter piece of 3 cm in diameter this amounts to approximately (0.35±0.15) µg C cm−2 for OC. For ECr extraction, two–
three filter pieces are usually analyzed to collect enough ma-terial for14C analysis and therefore the contamination of ECr
is approximately 0.1 and 0.2 µg C cm−2for three and two fil-ter pieces, respectively.
The organic fraction of one field blank filter was ana-lyzed for14C by pooling several extracts of the same filter. This fraction hadF14C(OC,blank)= (0.797±0.015), which is close to typical ambientF14C(OC)values. The14C content of ECrwas analyzed by pooling CO2extracted from 5 different
blanks that for test purposes were kept in the filter stacks of the sampler not for one minute but for varying amounts of time up to several days without being exposed to the air stream. The time in the sampler had no effect on ECr
concen-trations, which indicates that ECron the blank filter is only
introduced by filter handling and thermal extraction. The
F14C(ECr,blank)for these 5 samples is (0.543±0.014), which
is significantly higher than typical values ofF14C(ECr,blank)
from ambient aerosol samples (e.g., Szidat et al., 2006). The blank correction will therefore shiftF14C(ECr)to lower
Twelve independent measurements of the anthracite stan-dard throughout the time period 2010–2013 yielded a modern contaminationMmc with an average and standard deviation of (1.92±0.83) µg C per extraction, excluding one outlier of 6 µg. However, an improved cleaning method for the reac-tion tube used from 2011 onwards resulted in a lower Mmc
to (1.36±0.20) µg C per extraction for the 5 standards mea-sured in this time period from 2011–2013. The fossil con-tamination is on average (1.37±0.93) µg C per extraction for 12 samples between 2011–2013 and is not influenced by the change in cleaning procedure of the reaction tube. The propa-gated measurement uncertainties (arising from the uncertain-ties in14C measurements and carbon amount) for the average
Mmc are smaller than 5 %. For the average Mfc the propa-gated measurement uncertainties are around 30 %.
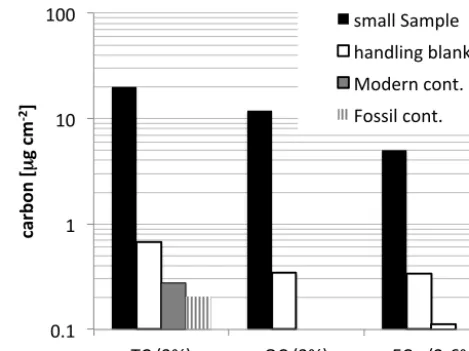
Figure 3 shows the handling blank in µg C cm−2 for TC,
OC and EC as white bars. For EC the two white bars rep-resent the lower limit of∼0.1 µg cm−2, if 3 filter pieces are
used for EC extraction and∼0.3 µg cm−2, if one filter piece is used. This is compared to the concentration of carbon on a typical small sample, which is shown in black bars. Using materials with known14C content, the contamination of TC could be assessed by an alternative method and divided into modern contamination (Mmc)and fossil contamination (Mfc)
as detailed in Eqs. (2)–(4). These are shown as additional grey bars for TC only. The sum of MfcandMmcis slightly lower than the total carbon handling blank. The blanks are also compared to a filter sample with a carbon mass concen-tration in the lower range of typical filter samples used for radiocarbon analysis in our group. For samples with a total carbon concentration∼> 20 µg cm−2, the amount of carbon
on a blank filter is less than 5 % of the carbon amount on a typical ambient filter. Therefore, the blank correction does not introduce large uncertainties to the data.
3.1.3 Discussion
The contamination introduced by the filter handling and anal-ysis is reasonable compared to expected sample size. The contamination is on the order of 1 µg/extraction for OC and EC and probably difficult to reduce even further without spe-cial clean room facilities. The sum ofMfcandMmc, which is
more indicative of the contamination introduced by the ther-mal extraction system, is lower than the total carbon handling blank. Figure 2 indicates that contamination from filter han-dling contributes roughly 1/3 to the total blank.
3.2 Loss of elemental carbon at OC combustion temperatures
3.2.1 Test procedure
Several studies show that when heating different kinds of soot in He-O2 mixtures or air, a small mass loss can start
already at fairly low temperatures of around 300◦C (e.g.,
32
Figure 3. The carbon concentration found on a typical lightly loaded filter sample compared with
the directly measured handling blank (white bars), and the average modern and fossil
contamination derived from analysis of anthracite and HoxII standards. The modern and fossil
contamination could only be determined for total carbon. The two white bars for RC give an upper
and lower limit of the handling blank, depending on the number of filter pieces used in the
extraction. 0.1$
1$ 10$ 100$
TC$(3%)$ OC$(3%)$ EC $(2.6%)$
ca
rb
on
'[
µ
g'cm
+2]'
small$Sample$ handling$blank$ Modern$cont.$ Fossil$cont.$
Figure 3. The carbon concentration found on a typical lightly
loaded filter sample compared with the directly measured handling blank (white bars), and the average modern and fossil contamina-tion derived from analysis of anthracite and HOxII standards. The modern and fossil contamination could only be determined for total carbon. The two white bars for EC give an upper and lower limit of the handling blank, depending on the number of filter pieces used in the extraction.
Sharma et al., 2012; Su et al., 2004). To test for loss of EC at temperatures that are typically used to combust OC we used commercial carbon black samples (Elftex), which is of-ten regarded as an appropriate surrogate for diesel soot (e.g., Yezerets, 2005, and references therein). The carbon black was applied to quartz fiber filters as described in Sect. 2.3. Before analysis, the filters were heated at 100◦C in oxygen to remove any ethanol that might have adsorbed on the fil-ter during the application of the carbon black suspension. The filters were then exposed to 340◦C in pure O
2 for up
to two hours and the amount of CO2evolved during this time
was determined manometrically. Blank filters spiked with only deionized water and ethanol were analyzed in the same way and the carbon amount found on the blank filter (around 1 µg cm−2)was subtracted from all analyzed filters.
3.2.2 Results
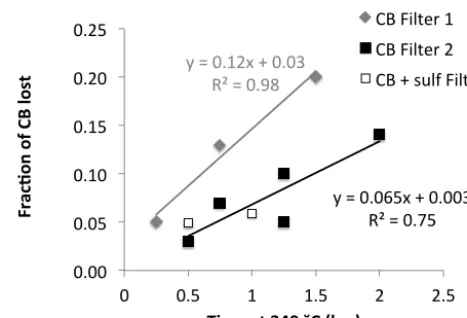
Figure 4 shows the loss of carbon black material at 340◦C in O2as a function of oxidation time for two types of quartz
U. Dusek et al.: Evaluation of a two-step thermal method 1949
necessary to oxidize 10 % of the carbon black at 340◦C.
Considering that the filter is only heated for 15 min for OC determination, the loss of carbon black in this time period is less than 3 %. In ambient aerosol the concentration of EC is usually significantly smaller than the concentration of OC. Assuming that typically 20–30 % of total carbon consists of EC the contribution of prematurely evolved EC to the ex-tracted OC should be below 1 %, if carbon black is a suitable model for atmospheric EC.
3.2.3 Discussion
Several studies (e.g., Sharma et al., 2012; Han et al., 2007) show that most carbon black samples are somewhat more thermally refractory than diesel soot, which in turn seems to be more refractory than soot from wood burning, at least with respect to the thermal-chemical oxidation method (Song et al., 2012). Therefore, the carbon black experiments can give a reasonable estimate for the loss of more refractory types of soot, but it must be kept in mind that some types of soot or char can be less refractory than carbon black. However, it is reasonable to assume that even for less refractory types of soot the contribution of prematurely evolved EC to the OC sample will not exceed a few percent.
This is supported by indirect evidence gained by combus-tion of an ambient filter sample at increasing temperatures of 300, 320, 340, 360, and 380◦C (not shown). If prema-turely oxidized EC significantly contributed to the OC that is combusted at these temperatures, this contribution should increase at higher temperatures. This would cause a decrease of F14C(OC) with oven temperature, since the F14C(EC) is usually considerably smaller than F14C(OC). Even though the amount of extracted OC increased with oven tempera-ture and was 30 % higher at 380◦C than at 300◦C,F14C
(OC)
remained at 0.809±0.013 %, independent of the oven tem-perature. A similar result was found by Szidat et al. (2004), who also concluded that the influence of prematurely evolved EC onF14C(OC)is negligible.
3.3 Charring of organic test compounds 3.3.1 Test procedure
Charring of organic compounds during thermal desorption is often monitored by optical methods, such as a laser beam, to detect an increase in the light absorption through a filter. This is especially useful when the heating of a filter occurs in an inert gas, where charring is substantial and loss of EC is negligible. When combusting a filter in pure O2, charring
is significantly reduced, especially after water extraction. A small loss of EC could partially offset the small increase in light absorption caused by charring. It can therefore be dif-ficult to conclusively quantify charring by optical methods, especially on highly loaded filters such as often used for14C analysis.
33
Figure 4. Fraction of carbon black (CB) that was lost at 340 °C in pure oxygen as a function of
oxidation time for two different filter types from the same manufacturer (Filter 1: Whatman QMA
1851-‐865and Filter 2: Whatman QMA 1851-‐150). The open squares correspond to carbon black
coated with ammonium sulfate
y"="0.12x"+"0.03" R²"="0.98"
y"="0.065x"+"0.003" R²"="0.75"
0.00" 0.05" 0.10" 0.15" 0.20" 0.25"
0" 0.5" 1" 1.5" 2" 2.5"
Fr
ac
%o
n(
of
(C
B(
lo
st
(
Time(at(340(˘C((hrs)((
CB"Filter"1" CB"Filter"2" CB"+"sulf"Filter"2""
Figure 4. Fraction of carbon black (CB) that was lost at 340◦C in pure oxygen as a function of oxidation time for two different filter types from the same manufacturer (Filter 1: Whatman QMA 1851-865 and Filter 2: Whatman QMA 1851-150). The open squares cor-respond to carbon black coated with ammonium sulfate
We therefore used representative organic test materials de-scribed in Sect. 2.3 to investigate their charring characteris-tics directly. The test compounds were applied to pre-cleaned quartz fiber filters. The filters were introduced into oven 1 at 340◦C for 15 min and the amount of evolved CO2was
deter-mined manometrically. The combustion step at 340◦C was repeated a second time to verify that all OC was oxidized dur-ing the first combustion step. Then the filter was introduced into oven 2 at 650◦C and the evolved CO2 was measured.
Since only organic and no refractory carbon was present on the filter originally, the CO2 measured at 650◦C originates
from the char that was formed during the combustion of the organic test material.
3.3.2 Results
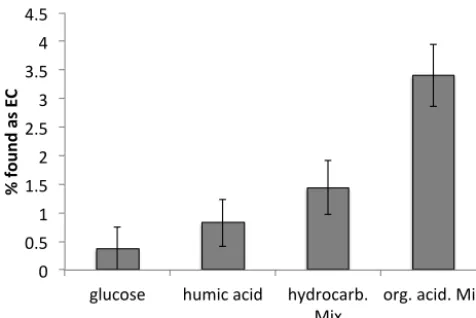
Figure 5 shows that charring is small for all investigated com-pounds during flash heating in O2. Less than 2 % of glucose,
of humic acid, of the hydrocarbon standard mix, and of the fatty acid methyl ester (FAME) mix is found as refractory carbon after the first OC combustion step. Charring is slightly higher for organic acids, of which 3.5 % are found as retory carbon. However, these are normally only a small frac-tion of the total organic carbon in ambient aerosols. More-over, they are largely removed by water extraction of the filter prior to EC analysis. In general, our results imply that 1–2 % of the water insoluble OC is found as ECr. Even this small
amount can have a measurable effect onF14C(ECr), because
ECrconstitutes usually a small fraction of TC. Assuming that
elemental carbon is around 20 % of total carbon, then around 5 % of the analyzed ECr can be charred organic carbon. In
34
Figure 5. Charring of several test compounds given as % of the substance found as RC after
heating at 340°C for 15 min in pure oxygen. See appendix A for a description of the hydrocarbon
and organic acid mixes. 0" 0.5" 1" 1.5" 2" 2.5" 3" 3.5" 4" 4.5"
glucose" humic"acid" hydrocarb."
Mix" org."acid."Mix"
%"found"as"
E
C
"
Figure 5. Charring of several test compounds given as % of the
substance found as EC after heating at 340◦C for 15 min in pure oxygen.
higher than in this extreme case, the overestimate is smaller (e.g., 0.03 forF14C(OC)∼0.8 andF14C(EC)∼0.2).
3.3.3 Discussion
Removal of organic carbon by flash heating in O2was
orig-inally developed to minimize the charring artifact (Cachier et al., 1989) and from our tests it is clear that this approach is very successful for water insoluble compounds, but less successful for water soluble carbon. WSOC usually also ac-counts for the majority of charring during heating under in-ert atmospheres (e.g., Yu et al., 2002). Zhang et al. (2012) used laser transmission measurements to monitor charring during the OC combustion steps. They combusted the wa-ter extract of an ambient aerosol sample, which showed even higher charring than the organic acids investigated in this work. However, for water extracted ambient samples they also concluded that the contribution from charred OC to the extracted EC can be reduced to below 5 % for ambient sam-ples. This indicates that the water insoluble test compounds chosen for our charring test are representative of the ambi-ent water insoluble aerosol. This makes them a useful sub-stitute for evaluating charring in OC-EC separation systems that lack optical monitoring. Cachier et al. (1989) found a higher percentage of charred humic acids remaining on the filter (∼30 %) and somewhat higher amounts of charred glu-cose (∼10 % for filter loadings comparable to our work). The reason for this difference is not clear.
3.4 Tests with ambient filters 3.4.1 Test procedure
During the charring tests we found that, except for a small charred fraction, all organic test compounds used in this study were removed after combustion at 340◦C for 15 min in pure O2, even high molecular weight humic acid. However,
the continuous transition from OC to the most refractory carbon in form of elemental carbon nanospheres in ambient aerosols is difficult to capture using simple test compounds. Therefore ambient samples are also used to test the efficiency of separating OC and EC in ambient aerosols.
The extraction methods usually utilize a practical compro-mise by excluding compounds with intermediate refractiv-ity from the analysis. A short intermediate step S2 in O2at
higher temperature should remove a mixture of the most re-fractory organic material and less rere-fractory elemental car-bon from the filter (e.g., Szidat et al., 2006; Zhang et al., 2012). However, the use of too harsh oxidation methods that allow only the most refractory part of EC to be recovered have the disadvantage that biomass burning EC is removed to a somewhat larger extent than fossil EC. Biomass burn-ing soot is less refractory than soot from liquid fuels (e.g., Song et al., 2012; Zhang et al., 2012) and has been found to evolve together with chars during thermal treatments rather than with diesel soot. Preferential removal of biomass burn-ing soot thus artificially decreasesF14C(ECr)which leads to
an underestimate of the fraction modern of EC.
We therefore investigate how different choices of parame-ters for extraction step S2 (with temperature for S1 remaining constant at 340◦C) affect (1) the recovery of EC and (2) the efficiency of OC removal. A water-extracted filter was kept in the first oven for 15 min for OC combustion (S1). Then it was introduced into the second oven at a higher temperature
T2for 1–3 min and the CO2that evolved during this
extrac-tion step was pumped away. Then the filter was taken out of the oven system, while the CO2resulting from the
combus-tion step S1 was purified and processed. For the last step, the filter was introduced into oven 2 at 650◦C and EC
rwas
measured.
The complete removal of OC is difficult to assess directly. However, two indirect estimates are used that can indicate the extent of OC removal. First, refractory OC is often as-sociated with highly polymeric, char- or tar-like substances. These substances are often subsumed under the name “brown carbon” (BrC), which is characterized by its light absorp-tion properties (e.g., Andreae and Gelencsér, 2006; Pöschl, 2005). The recovery of EC was estimated by comparing the light absorption of a water extracted filter piece to the absorp-tion of a filter piece after organic carbon was removed during S1 and S2. Absorption was measured using an integrating sphere photometer (Hitzenberger et al., 1996; Wonaschütz et al., 2009). BC and BrC concentrations were determined by measuring the light absorption of the filter pieces at 3 differ-ent wavelengths. BrC is distinguished from BC by exploiting the different wavelength dependence of light absorption fol-lowing Wonaschütz et al. (2009). If brown carbon is removed after S1 and S2, this gives a good indication that the extrac-tion protocol was effective in removing most refractory OC.
A second method is to measure the mass andF14C of the refractory carbon ECras a function of increasing temperature
U. Dusek et al.: Evaluation of a two-step thermal method 1951
35
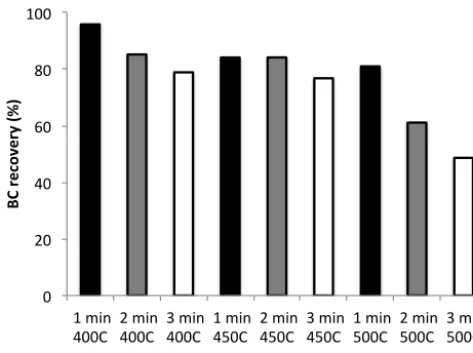
Figure 6. Black carbon recovery as a function of duration and temperature of separation
step S2
0" 20" 40" 60" 80" 100"
"1"min"
400C""2"min"400C""3"min"400C""1"min"450C""2"min"450C""3"min"450C""1"min"500C""2"min"500C""3"min"500C"
BC
#re
co
ve
ry
#(%)
#
Separa0on#step#parameters#
Figure 6. Black carbon recovery as a function of duration and
tem-perature of separation step S2.
associated with a strong decrease inF14C(ECr), this can be an
indication that fairly “modern” organic material is still being removed when the temperature of step S2 is increased. Pref-erential removal of biomass burning EC is usually associated with a much more gradual decrease inF14C(ECr).
3.4.2 Results
The effect of the duration and temperature of S2 on the re-covery of black carbon are shown in Fig. 6 for filter CA18. A duration of S2 of 1 min causes loss of black carbon that does not exceed 20 %. There is little change in black carbon content between a filter that has been exposed to 450 and 500◦C for 1 min, which suggests that 1 min of heating might not be enough for the filter temperature to fully reach 500◦C. When the duration of S2 is increased to two minutes an in-crease in temperature from 400 to 450◦C causes little extra loss of BC. The amount of BC remaining after S2 of 450◦C is very similar for exposure times of 1 and 2 min, suggesting that little additional BC is removed by increasing the oxida-tion time. However, raising the temperature further to 500◦C strongly decreases the recovered BC to around 60 %. If the duration of S2 is increased to 3 min, then the recovery at 400 and 450◦C decreases by only 8 % and remains comparable, whereas the recovery at 500◦C decreases sharply to 50 %. This indicates that a temperature 500◦C is too high, since
substantial amounts of BC are removed. A time step of 1 min is likely too short for the filter to reach the desired temper-ature, therefore a step of 2 min was tried for further experi-ments.
F14C(EC)of filter CA12 was measured as function of S2 temperature with S2 duration of 2 min. Figure 7a shows that the amount of remaining ECr (black bars) decreases only
slightly if the S2 temperature is raised from 400 to 450◦C, but only 50 % of the original EC remains after 2 min at
500◦C.F14C
(ECr) (grey bars) remains virtually unchanged
for S2 temperatures of 400 and 450◦C and then decreases
from 0.36 to 0.31 once the S2 temperature is raised to 500◦C. F14C of the material removed by each successive tempera-ture increase can be calculated according to the mass bal-ance:
F14C(2−1)=(F14C(EC1)·MEC(T1) (5) −F14C(EC2)·MEC(T2))/(MEC(T1)−MEC(T2)),
where F14C(2−1) is the fraction modern of the material that was removed by raising S2 temperature fromT1toT2;
F14C(EC1),F14C(EC2)are the fraction modern of the refrac-tory carbon recovered afterT1andT2;MEC(T1)andMEC(T2)
are the mass of the refractory carbon recovered afterT1and
T2. These are shown in Fig. 7a as patterned bars. It is obvious that the removed carbon has a similar fraction modern as the ECritself, which suggests that the largest amount of organic
carbon was removed already at S2 of 400◦C and the higher temperature steps remove mainly EC. The slight decrease inF14C with increasing S2 temperature results more likely from differential oxidation of biomass burning EC and fos-sil fuel EC, than from remaining organic carbon. If organic carbon was left in the sample a larger decrease inF14C(EC) between 400 and 450◦C would be expected than at a temper-ature that is high enough to burn significant amounts of black carbon.
Figure 7b shows similar results for a 1 min S2 time step. Filter CA2 was used for these experiments, since not enough material was left of filter CA12 for further tests. An increase in temperature of S2 from 400 to 500◦C does not cause a
strong decrease in the recovered EC. A similar trend was ob-served for the black carbon concentrations shown in Fig. 6. This supports our conclusion that the filter itself probably does not reach 500◦C within 1 min. However, even though not much extra material is removed during 1 min at 500◦C, the fraction modern of the recovered EC decreases signifi-cantly. Following mass balance Eq. (6),F14C of the carbon removed by raisingT to 500◦C is 0.67, very close to the
F14C of water insoluble organic carbon of filter CA2 (0.62). This shows that a time period of 1 min for the intermediate step S2 is probably not sufficient to remove all organic car-bon from the filter.
The final decision was to use a S2 temperature step of 2 min at 450◦C, because this combines reasonable BC
recov-ery rates with removal of most refractory OC. ForT1we de-cided to use a temperature of 360◦C, since this gives a higher
recovery rate of OC on some highly loaded samples. Vary-ing the temperature of step 1 did not changeF14C(OC) and showed only minimal loss of carbon black material, which both indicates that this slightly higher temperature should not strongly affect EC recovery and consequentlyF14C(ECr).
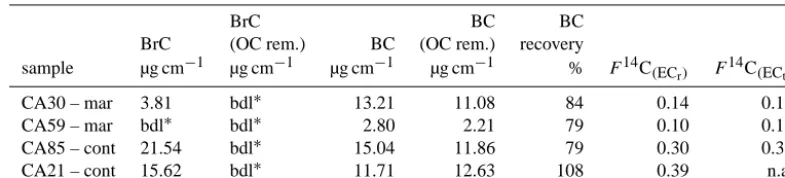
Table 1. Brown carbon (BrC) and black carbon (BC) detected in 4 ambient filter samples before OC removal and after OC removal (OC rem.)
using S1 at 360◦C for 15 min and S2 at 450◦C for 2 min in pure oxygen. mar – Filter with back trajectories starting over the ocean, cont – Filter with back trajectories starting over the land. Also shown is the BC recovery,F14C of the recovered EC (ECr)and the extrapolated
F14C for 100 % recovery (ECt). For the extrapolation we take the average slope ofF14C with optical recovery (0.31) from the supporting material in Zhang et al. (2012).
BrC BC BC
BrC (OC rem.) BC (OC rem.) recovery
sample µg cm−1 µg cm−1 µg cm−1 µg cm−1 % F14C(ECr) F
14C (ECt)
CA30 – mar 3.81 bdl∗ 13.21 11.08 84 0.14 0.19
CA59 – mar bdl∗ bdl∗ 2.80 2.21 79 0.10 0.17
CA85 – cont 21.54 bdl∗ 15.04 11.86 79 0.30 0.36
CA21 – cont 15.62 bdl∗ 11.71 12.63 108 0.39 n.a.
∗bld: below detection limit < 2 µg cm−2.
0" 0.1" 0.2" 0.3" 0.4" 0.5" 0.6" 0.7" 0.8" 0.9" 1"
S2:"400°C,"
2min" S2:"450°C,"2min" S2:"500°C,"2min" T16T2" T26T3"
ECr/TC" F14C(ECr)"
0"
0.1" 0.2" 0.3" 0.4" 0.5" 0.6" 0.7" 0.8" 0.9" 1"
S2:"400°C,""
1min" S2:"500°C,""1min" T16T3" ECr/TC"
F14C(ECr)"
Figure 7. Fraction modern and mass fraction (ECr/TC) of the ex-tracted refractory carbon (ECr) remaining after a separation step S1 (15 min at 360◦C) and S2. The duration and temperature of separa-tion S2 are given on thexaxis. The difference in ECr/TC andF14C (ECr) found after extraction step S2 at lower and higher temperature are given as shaded bars.
recovery. Two of the samples had marine air mass origin, whereas the other two had continental air mass origin. The two samples with marine air mass origin contain little wa-ter insoluble brown carbon (Table 1), whereas the continen-tal samples contain significant amounts. After OC removal the brown carbon is below detection level for all test filters, which is further indication for satisfactory removal of the or-ganic fraction. The recovery of BC is approximately 80 % for three of the filters, which is close to the target value for which the S2 step was chosen. However, for filter CA21 the recov-ery is slightly above 100 %. Filter CA21 was sampled for a week during fairly high aerosol concentrations and has there-fore a very high aerosol loading (TC = 219 µg cm−2). It is
possible that the saturation of the integrating sphere method is reached and a small loss of BC cannot be detected. How-ever, is also possible that 2 min at 450◦C are not enough to remove such large amounts of OC that is coating the BC. However, since all the brown carbon is nevertheless re-moved, this does not seem very likely. Alternatively, a fairly high amount of brown carbon that is relatively susceptible
to charring could produce measurable amounts of black car-bon during S1 and S2. TheF14C(ECr)values of filter samples
with a BC recovery of∼1 should be treated with caution, and possibly the extraction procedure should be repeated either with higher temperature or longer duration of S2.
In the last column of Table 1 we show F14C(ECt), the
fraction modern estimated for the total elemental carbon at 100 % recovery, assuming that biomass burning EC is lost to a greater degree than fossil EC during S2. The relation-ship betweenF14C(EC) and optical recovery is taken from the supplementary material in Zhang et al. (2012).
3.4.3 Discussion
The amount andF14C as well as optical properties of ECr
suggest that an S2 time removal step of 2 min around 450◦C
is a good choice for separating organic and refractory car-bon. Two other methods published in the literature (Zhang et al., 2012; Bernardoni et al., 2013) use a similar approach but different combustion temperatures and atmospheres. Each is evaluated with different methods, but some main conclu-sions are similar. The black carbon recovery by the presented method (∼80 %) is similar to the one reported for the Swiss S4 protocol (Zhang et al., 2012) and slightly higher than in the method proposed by Bernardoni et al. (2013). The contamination of ECr with charged OC is estimated to be
< 5 % in this work and Zhang et al. (2012). This similar per-formance in different test procedures gives additional confi-dence in these methods.
The method presented in this work does not use a He step, which the other methods find necessary to remove a non light absorbing carbon fraction that co-evolves with BC in O2 up to very high temperatures. At present it is not clear
U. Dusek et al.: Evaluation of a two-step thermal method 1953
A future inter-comparison of these three and also other methods (e.g., Zencak et al., 2007; Heal et al., 2011) would shed more light on the issue how strongly the differences in the extraction protocols affect F14C(ECr). Such an
inter-comparison has been done for organic and total carbon (Szidat et al., 2013), but only very limited data on EC were available at that time.
4 Conclusions
We tested a thermal method designed to separate organic and combustion derived refractory carbon for radiocarbon analy-sis of aerosol samples. For OC extraction the sample is com-busted in pure oxygen at 360◦C for 15 min. For EC extrac-tion a water-extracted filter sample is first subjected to 360◦C
for 15 min, followed by a 2 min intermediate combustion step at 450◦C to completely remove OC. After OC removal EC
is extracted at 650◦C for 15 min.
The recovery of EC after the OC removal steps was quan-tified by measuring the recovery of black carbon (BC) us-ing an optical method. The BC recovery was around 80 %, which is comparable to two similar methods (Zhang et al., 2012; Bernardoni et al., 2013). The effectiveness of the OC removal steps are strongly supported by the successful re-moval of brown carbon in 4 ambient test samples and by the removal of several organic test compounds, including high molecular weight humic acid.
Charring of water insoluble organic test materials was found to be minor. Less than 2 % of the organic test com-pounds were found as EC after the OC combustion step. From this we estimate that around 5 % of EC could originate from charred OC. This is in close agreement with Zhang et al. (2012), who estimated charring of ambient samples using optical methods.
Acknowledgements. This work was funded by the Dutch science
foundation (NWO, grant No. 820.01.001). The development of the BC analysis technique was funded by the Hochschuljubiläum-stiftung der Stadt Wien, grant H-85/92. We would like to thank Dicky van Zonneveld, Henk Been and Anita Aerts-Bijma for their 14C analysis work. We thank Robert Wagner und Elisabeth Traxler for their help with black and brown carbon analysis. We would like to thank Sönke Szidat and one anonymous reviewer for valuable comments on the manuscript.
Edited by: P. Herckes
References
Andreae, M. O. and Gelencsér, A.: Black carbon or brown car-bon? The nature of light-absorbing carbonaceous aerosols, At-mos. Chem. Phys., 6, 3131–3148, doi:10.5194/acp-6-3131-2006, 2006.
Bernardoni, V., Calzolai, G., Chiari, M., Fedi, M., Lucarelli, F., Nava, S., Piazzalunga, A., Riccobono, F., Taccetti, F., Valli, G., and Vecchi, R.: Radiocarbon analysis on organic and el-emental carbon in aerosol samples and source apportionment at an urban site in Northern Italy, J. Aerosol Sci., 56, 88–99, doi:10.1016/j.jaerosci.2012.06.001, 2013.
Cachier, H., Bremond, M.-P., and Buat-Menart, P.: Determination of atmospheric soot carbon with a simple thermal method, Tellus B, 41, 379–390, 1989.
Currie, L. A.: Evolution and multidisciplinary frontiers of C14 aerosol science, Radiocarbon, 42, 115–126, 2000.
de Rooij, M., van der Plicht, J., and Meijer, H. A. J.: Porous iron pellets for AMS C14 analysis of small samples down to ultra-microscale size (10–25 µg C), Nucl. Instrum. Meth. B, 268, 947– 951, doi:10.1016/j.nimb.2009.10.071, 2010.
Dusek, U., ten Brink, H. M., Meijer, H. A. J., Kos, G., Mrozek, D., Rockmann, T., Holzinger, R., and Weijers, E. P.: The contribution of fossil sources to the organic aerosol in the Netherlands, Atmos. Environ., 74, 169–176, doi:10.1016/j.atmosenv.2013.03.015, 2013.
El Haddad, I., Marchand, N., Wortham, H., Piot, C., Besombes, J.-L., Cozic, J., Chauvel, C., Armengaud, A., Robin, D., and Jaf-frezo, J.-L.: Primary sources of PM2.5organic aerosol in an in-dustrial Mediterranean city, Marseille, Atmos. Chem. Phys., 11, 2039–2058, doi:10.5194/acp-11-2039-2011, 2011.
Gelencser, A., May, B., Simpson, D., Sanchez-Ochoa, A., Kasper-Giebl, A., Puxbaum, H., Caseiro, A., Pio, C., and Legrand, M.: Source apportionment of PM2.5 organic aerosol over Europe: Primary/secondary, natural/anthropogenic, and fossil/biogenic origin, J. Geophys. Res., 112, D23S04, doi:10.1029/2006JD008094, 2007.
Genberg, J., Hyder, M., Stenström, K., Bergström, R., Simpson, D., Fors, E. O., Jönsson, J. Å., and Swietlicki, E.: Source apportionment of carbonaceous aerosol in southern Sweden, Atmos. Chem. Phys., 11, 11387–11400, doi:10.5194/acp-11-11387-2011, 2011.
Gilardoni, S., Vignati, E., Cavalli, F., Putaud, J. P., Larsen, B. R., Karl, M., Stenström, K., Genberg, J., Henne, S., and Den-tener, F.: Better constraints on sources of carbonaceous aerosols using a combined14C – macro tracer analysis in a European rural background site, Atmos. Chem. Phys., 11, 5685–5700, doi:10.5194/acp-11-5685-2011, 2011.
Glasius, M., la Cour, A., and Lohse, C.: Fossil and nonfossil car-bon in fine particulate matter: A study of five european cities, J. Geophys. Res., 116, D11302, doi:10.1029/2011JD015646, 2011. Godwin, H.: Half-life of radiocarbon, Nature, 195, 984–986, 1962. Gustafsson, O., Bucheli, T. D., Kukulska, Z., Andersson, M., Largeau, C., Rouzaud, J. N., Reddy, C. M., and Eglinton, T. I.: Evaluation of a protocol for the quantification of black carbon in sediments, Global Biogeochem. Cy., 15, 881–890, doi:10.1029/2000GB001380, 2001.
C. A., Song, J., Peng, P., Mitra, S., Dunn, J. C., Hatcher, P. G. Hockaday, W. C., Smith, D. M., Hartkopf-Fröder, C., Böh-mer, A., Lüer, B., Huebert, B. J., Amelung, W., Brodowski, S., Huang, L., Zhang, W., Gschwend, P. M., Flores-Cervantes, D. X., Largeau, C., Rouzaud, J.-N., Rumpel, C., Guggenberger, G., Kaiser, K., Rodionov, A., Gonzalez-Vila, F. J., Gonzalez-Perez, J. A., de la Rosa, J. M., Manning, D. A. C., Lopez-Capel, E., and Ding, L.: Comparison of black carbon quantification meth-ods to measure fire-derived (black/elemental) carbon in soils and sediments using reference materials from soil, water, sedi-ment and the atmosphere, Global Biogeochem. Cy., 21, GB3016, doi:10.1029/2006GB002914, 2007.
Han, Y., Cao, J., Chow, J. C., Watson, J. G., An, Z., Jin, Z., Fung, K., and Liu, S.: Evaluation of the thermal/optical reflectance method for discrimination between char- and soot-EC, Chemosphere, 69, 569–574, doi:10.1016/j.chemosphere.2007.03.024, 2007. Heal, M. R., Naysmith, P., Cook, G. T., Xu, S., Duran, T. R., and
Harrison, R. M.: Application of14C analyses to source appor-tionment of carbonaceous PM2.5 in the UK, Atmos. Environ., 45, 2341–2348, doi:10.1016/j.atmosenv.2011.02.029, 2011. Hitzenberger, R., Dusek, U., and Berner, A.: Black carbon
measure-ments using an integrating sphere, J. Geophys. Res., 101, 19601– 19606, doi:10.1029/95JD02412, 1996.
Ishiguro, T., Takatori, Y., and Akihama, K.: Microstructure of diesel soot particles probed by electron microscopy: First observation of inner core and outer shell, Combust. Flame, 108, 231–234, doi:10.1016/S0010-2180(96)00206-4, 1997.
Levin, I., Naegler, T., Kromer, B., Diehl, M., Francey, R. J., Gomez-Pelaez, A. J., Steele, L. P., Wagenbach, D., Weller, R., and Wor-thy, D. E.: Observations and modelling of the global distribution and long-term trend of atmospheric14CO2, Tellus B, 62, 26–46, 2010.
Lewis, C. W., Klouda, G. A., and Ellenson, W. D.: Radiocarbon measurement of the biogenic contribution to summertime PM2.5 ambient aerosol in Nashville, TN, Atmos. Environ., 38, 6053– 6061, 2004.
Minguillón, M. C., Perron, N., Querol, X., Szidat, S., Fahrni, S. M., Alastuey, A., Jimenez, J. L., Mohr, C., Ortega, A. M., Day, D. A., Lanz, V. A., Wacker, L., Reche, C., Cusack, M., Amato, F., Kiss, G., Hoffer, A., Decesari, S., Moretti, F., Hillamo, R., Teinilä, K., Seco, R., Peñuelas, J., Metzger, A., Schallhart, S., Müller, M., Hansel, A., Burkhart, J. F., Baltensperger, U., and Prévôt, A. S. H.: Fossil versus contemporary sources of fine el-emental and organic carbonaceous particulate matter during the DAURE campaign in Northeast Spain, Atmos. Chem. Phys., 11, 12067–12084, doi:10.5194/acp-11-12067-2011, 2011.
Mohn, J., Szidat, S., Fellner, J., Rechberger, H., Quartier, R., Buchmann, B., and Emmenegger, L.: Determination of biogenic and fossil CO2emitted by waste incineration based on (CO2) -C-14 and mass balances, Bioresour. Technol., 99, 6471–6479, doi:10.1016/j.biortech.2007.11.042, 2008.
Petzold, A., Ogren, J. A., Fiebig, M., Laj, P., Li, S.-M., Bal-tensperger, U., Holzer-Popp, T., Kinne, S., Pappalardo, G., Sug-imoto, N., Wehrli, C., Wiedensohler, A., and Zhang, X.-Y.: Rec-ommendations for reporting “black carbon” measurements, At-mos. Chem. Phys., 13, 8365–8379, doi:10.5194/acp-13-8365-2013, 2013.
Pöschl, U.: Atmospheric aerosols: Composition, transformation, climate and health effects, Angewandte Chemie, 44, 7520–7540, doi:10.1002/anie.200501122, 2005.
Prokopiou, M.: Characterization of a thermal method for separating organic and elemental carbon from aerosol samples using14C analysis, M.S. thesis, University of Groningen, the Netherlands, 2010.
Reimer, P., Brown, T., and Reimer, R.: Discussion: Reporting and calibration of post-bomb14C data, Radiocarbon 46, 1299–1304, 2004.
Schichtel, B. A., Malm, W. C., Bench, G., Fallon, S., McDade, C. E., Chow, J. C., and Watson, J. G.: Fossil and contem-porary fine particulate carbon fractions at 12 rural and urban sites in the United States, J. Geophys. Res., 113, D02311, doi:10.1029/2007JD008605, 2008.
Sharma, H. N., Pahalagedara, L., Joshi, A., Suib, S. L., and Mhadeshwar, A. B.: Experimental Study of Carbon Black and Diesel Engine Soot Oxidation Kinetics Using Thermogravimetric Analysis, Energy Fuels, 26, 5613–5625, doi:10.1021/ef3009025, 2012.
Song, J., Huang, W., and Peng, P.: Stability and carbon isotope changes of soot and char materials during thermal oxidation: Implication for quantification and source appointment, Chem. Geol., 330, 159–164, doi:10.1016/j.chemgeo.2012.08.003, 2012. Su, D. S., Jentoft, R. E., Müller, J., Rothe, D., Jacob, E., Simp-son, C. D., Tomovi´c, Ž., Müllen, K., Messerer, A., Pöschl, U., Niessner, R., and Schlögl, R.: Microstructure and oxidation be-haviour of Euro IV diesel engine soot: a comparative study with synthetic model soot substances, Catal. Today, 90, 127–132, doi:10.1016/j.cattod.2004.04.017, 2004.
Szidat, S., Jenk, T. M., Gaggeler, H. W., Synal, H. A., Hajdas, I., Bo-nani, G. and Saurer, M.: THEODORE, a two-step heating system for the EC/OC determination of radiocarbon (C-14) in the envi-ronment, Nucl. Instrum. Meth. B, 223, 829–836, 2004.
Szidat, S., Jenk, T. M., Synal, H. A., Kalberer, M., Wacker, L., Haj-das, I., Kasper-Giebl, A., and Baltensperger, U.: Contributions of fossil fuel, biomass-burning, and biogenic emissions to carbona-ceous aerosols in Zurich as traced by C-11, J. Geophys. Res., 111, D07206, doi:10.1029/2005JD006590, 2006.
Szidat, S., Prevot, A. S. H., Sandradewi, J., Alfarra, M. R., Synal, H. A., Wacker, L., and Baltensperger, U.: Dominant impact of residential wood burning on particulate matter in Alpine valleys during winter, Geophys. Res. Lett., 34, L05820, doi:10.1029/2006GL028325, 2007.
Szidat, S., Ruff, M., Perron, N., Wacker, L., Synal, H.-A., Hallquist, M., Shannigrahi, A. S., Yttri, K. E., Dye, C., and Simpson, D.: Fossil and non-fossil sources of organic carbon (OC) and ele-mental carbon (EC) in Göteborg, Sweden, Atmos. Chem. Phys., 9, 1521–1535, doi:10.5194/acp-9-1521-2009, 2009.
Szidat, S., Bench, G., Bernardoni, V., Calzolai, G., Czimczik, C. I., Derendorp, L., Dusek, U., Elder, K., Fedi, M., Genberg, J., Gustafsson, Ö., Kirillova, E., Kondo, M., McNichol, A. P., Per-ron, N., dos Santos, G. M., Stenström, K., Swietlicki, E., Uchida, M., Vecchi, R., Wacker, L., Zhang, Y., and Prévôt, A. S. H.: Inter-comparison of14C Analysis of Carbonaceous Aerosols: Exercise 2009, Radiocarbon, 55, 1496–1509, 2013.
facil-U. Dusek et al.: Evaluation of a two-step thermal method 1955
ity, Nucl. Instrum. Meth. B, 172, 58–65, doi:10.1016/S0168-583X(00)00284-6, 2000.
Wonaschütz, A., Hitzenberger, R., Bauer, H., Pouresmaeil, P., Klatzer, B., Caseiro, A., and Puxbaum, H.: Application of the In-tegrating Sphere Method to Separate the Contributions of Brown and Black Carbon in Atmospheric Aerosols, Environ. Sci. Tech-nol., 43, 1141–1146, doi:10.1021/es8008503, 2009.
Yezerets, A., Currier, N. W., Kim, D. H., Eadler, H. A., Epling, W. S., and Peden, C. H. F.: Differential kinetic analysis of diesel particulate matter (soot) oxidation by oxygen using a step-response technique, Appl. Catal. B-Environ., 61, 120–129, doi:10.1016/j.apcatb.2005.04.014, 2005.
Yu, J. Z., Xu, J. H., and Yang, H.: Charring characteristics of atmo-spheric organic particulate matter in thermal analysis, Environ. Sci. Technol., 36, 754–761, 2002.
Zencak, Z., Elmquist, M., and Gustafsson, O.: Quantification and radiocarbon source apportionment of black carbon in atmo-spheric aerosols using the CTO-375 method, Atmos. Environ., 41, 7895–7906, doi:10.1016/j.atmosenv.2007.06.006, 2007. Zhang, Y. L., Perron, N., Ciobanu, V. G., Zotter, P.,