www.soil-journal.net/2/163/2016/ doi:10.5194/soil-2-163-2016
© Author(s) 2016. CC Attribution 3.0 License.
SOIL
Interactions between organisms and parent materials of
a constructed Technosol shape its hydrostructural
properties
Maha Deeb1,2, Michel Grimaldi2, Thomas Z. Lerch1, Anne Pando1,2, Agnès Gigon1, and Manuel Blouin1
1UPEC, Institute of Ecology and Environmental Sciences of Paris – UMR7618,
61 avenue du Général de Gaulle, 94010 Créteil, France
2IRD, Institute of Ecology and Environmental Sciences of Paris – UMR7618, 32 avenue Henri Varagnat,
93142 Bondy CEDEX, France
Correspondence to: Maha Deeb ([email protected])
Received: 25 October 2015 – Published in SOIL Discuss.: 17 December 2015 Revised: 10 March 2016 – Accepted: 27 March 2016 – Published: 22 April 2016
Abstract. There is no information on how organisms influence hydrostructural properties of constructed Tech-nosols and how such influence will be affected by the parent-material composition factor. In a laboratory ex-periment, parent materials, which were excavated deep horizons of soils and green waste compost (GWC), were mixed at six levels of GWC (from 0 to 50 %). Each mixture was set up in the presence/absence of plants
and/or earthworms, in a full factorial design (n =96). After 21 weeks, hydrostructural properties of constructed
Technosols were characterized by soil shrinkage curves. Organisms explained the variance of hydrostructural characteristics (19 %) a little better than parent-material composition (14 %). The interaction between the effects of organisms and parent-material composition explained the variance far better (39 %) than each single factor. To summarize, compost and plants played a positive role in increasing available water in macropores and micro-pores; plants were extending the positive effect of compost up to 40 and 50 % GWC. Earthworms affected the void ratio for mixtures from 0 to 30 % GWC and available water in micropores, but not in macropores. Earth-worms also acted synergistically with plants by increasing their root biomass, resulting in positive effects on available water in macropores. Organisms and their interaction with parent materials positively affected the hy-drostructural properties of constructed Technosols, with potential positive consequences on resistance to drought or compaction. Considering organisms when creating Technosols could be a promising approach to improve their fertility.
1 Introduction
Pedogenesis results from the dynamic interaction between climate, parent rock, and organisms. The most important fac-tor(s) has been debated for a long time (Wilkinson et al., 2009) and studied independently (Jenny, 1941), but their in-teractions remain little understood (Paton, 1978; Amundson et al., 2007). Understanding of the influence of bioturbation (physical displacement by organisms) is not straightforward on soil formation (Amundson et al., 2007; Wilkinson et al., 2009). Some authors consider biotic mixing agents as a sec-ondary cause of soil formation (Carson and Kirkby, 1972),
need 10 000 years at least for reconstruction. Also, trans-portation costs and downsides could be avoided. Moreover, Technosols offer an opportunity to recycle urban waste, such as excavated deep horizons/backfills from enterprises of the building sector, sewage sludge from waste water plants, or green waste from greens pace enterprises or local authori-ties. In this regard, Technosols offer another life to these ma-terials, which accumulation is urgent to cope with, due to health and environmental problems (Nemerow, 2009; Mar-shall and Farahbakhsh, 2013), while they could be used to improve urban ecosystem services (Morel et al., 2014) and form a closed loop that reduces the impact of cities on the en-vironment. Constructed Technosols are different from other soils because they are designed assemblages of technogenic materials. Thus, the evolution of Technosols is different com-pared to the pedogenesis of natural soils (soils that gener-ally show genetic relationships between the horizons they are composed of, and in which transitions among soils’ types are visible. Humanity does not influence their formation pro-cess; Lehmann and Stahr, 2007). However, Technosols ex-hibit some formation processes similar to those observed in natural soil pedogenesis, such as decarbonization and aggre-gation (Séré et al., 2010; Jangorzo et al., 2014).
The pedogenesis of a constructed Technosol is particularly interesting. It begins with the mixing of parent materials in a proportion chosen by the experimenter, whereas the initial state of natural soils is never under the control of researchers. Parent materials strongly influence the type of soil formed (Charman and Murphy, 2000). Organo-mineral composition of constructed Technosols determines several soil chemical and physical properties (pH, cationic exchange capacity, tex-ture, etc.) and affects their quality (Molineux et al., 2009; Olszewski et al., 2010; Arocena et al., 2010; Rokia et al., 2014). The Influence of organic matter and texture on com-pactability of Technosols (Paradelo and Barral, 2013) and the formation of the organo-mineral complex in newly formed soil (Monserie et al., 2009) have also been documented. However, hydrostructural properties have not yet been in-vestigated. This is of particular importance since constructed Technosols are often influenced by compaction (Jangorzo et al., 2013). Moreover, they are expected to provide water regulation services and to supply vegetation requirements. Therefore, we were interested in determining influences of different functional groups of organisms on soil hydrostruc-tural properties. We focused on two kinds of organisms with different impacts on soil physical structure. Earthworms make an important contribution to soil function by influenc-ing chemical, biological, and physical soil processes (Lavelle and Spain, 2001; Edwards, 2004), with consequences for ecosystem services (Blouin et al., 2013). Their major physi-cal contributions are due to their high consumption rates and burrowing activity that affect soil structure, aggregation, and aeration (Blanchart et al., 1997), which influence the hydric properties of soil (Schrader and Zhang, 1997; Shipitalo and Butt, 1999). These modifications of hydrostructural
proper-ties by earthworms have tremendous consequences for plant growth (Scheu, 2003; Eisenhauer et al., 2007; Van Groeni-gen et al., 2014). Plant roots and rhizosphere inhabitants (mi-croorganismes) also have a significant influence on aggre-gates and their stability (Jastrow et al., 1998; Rillig et al., 2002), sometimes more significant than that of earthworms (Blanchart et al., 2004). Roots penetrate the soil and create macropores which guarantee the exchange of gases in the vadose zone (Beven and Germann, 1982). Roots also cre-ate weak zones that fragment the soil and form aggregcre-ates, whose formation is strengthened by wetting–drying cycles due to water uptake by the plant (Angers and Caron, 1998). In addition, plant root residues provide a food source for microorganisms and fauna, which contribute to soil struc-ture formation and stabilization (Innes et al., 2004). In re-turn, microorganism-mediated changes in soil structure af-fect plant growth, mostly by modifying the root’s physical environment (Dorioz et al., 1993).
In this study, we were interested in the effect of two soil-forming factors, i.e., parent materials and organisms, on hy-drostructural parameters via measurements of soil shrink-age curves (SSCs) which represents the concomitant de-crease in soil volume and water mass during drying (Haines, 1923). The influence of parent-material properties (espe-cially clay content and type) (Boivin et al., 2004), organic matter (Boivin et al., 2009), and organisms (Kohler-Milleret et al., 2013; Milleret et al., 2009) on shrinkage properties has already been studied in natural soils. This study addresses the question of material–organism interaction on the hydrostruc-tural properties of a constructed Technosols in a 5-month mi-crocosm experiment with four “organism” treatments
(con-trol, plants, earthworms, plants+earthworms) combined
with six percentages of green waste compost/excavated deep horizons under controlled climatic conditions.
2 Materials and methods
2.1 Parent materials
The mineral material excavated from deep horizons of soil (EDH) used in this study was provided by the ECT Com-pany (Villeneuve sous Dammartin, France). This material is typically what is found when foundations are dug in the Île-de-France. It is mainly the result of the weathering of car-bonated rock fragments of the Parisian Basin (France) from the Eocene. For our study, we collected 500 kg of EDH at eight locations from the base of ECT’s landfill site, in or-der to have a composite sample representative of what may be used to construct Technosols around Paris. EDH is classi-fied as carbonated sandy soil (Nachtergaele, 2001). Our
ma-terial was composed of 880 g kg−1sand, 100 g kg−1silt, and
20 g kg−1clay after carbonate (lime) removal, which
repre-sents 431 g kg−1(W/W) of total dry mass. Without carbonate
removal, EDH was composed of 110 g kg−1particles<2 µm
Table 1. Mean ±1 SE (n=4), main agronomic properties of technogenic materials used to make the constructed Technosols. EDH: excavated deep soil horizons; GWC: green waste compost.
Property EDH GWC
pHH2O 8.3±0.0 7.9±0.1
pHKCL 8.1±0.1 7.5±0.1
Organic carbon (g kg−1) 0.38±0.0 210.41±4.2 Total nitrogen (g kg−1) 0.03±0.0 1.47±0.0 Particle density (g cm−3) 2.75±0.2 2.06±0.1 Bulk density (g cm−3) 1.33±0.0 0.61±0.0 The residual moisture content
65.8±4.0 87.9±2.3 after air drying (g kg−1)
particles from 50 µm to 2 mm. X-ray diffraction performed with a Siemens D500 diffractometer (Cu-Ka, 40 kV, 30 mA) identified quartz, calcite, and dolomite as major minerals. The concentrations of organic carbon and nitrogen were mea-sured by elemental analysis (Elementar Vario EL III). The green waste compost (GWC) used in our experiment was composed of cuttings from urban areas. Table 1 shows the main agronomic properties of EDH and GWC.
2.2 Experimental design and conditions
EDH and GWC were mixed using a concrete mixer to pre-pare six different mixtures with specific volumetric percent-ages of GWC at 0, 10, 20, 30, 40, and 50 %. One liter of each
mixture was placed in a microcosm of 13×13×12.5 cm
with maximum capacity of 1.2 L. Water retention capacity of each mixture was measured at the beginning of the exper-iment by using a pressure plate apparatus (Richards, 1948)
with a water potential of −31 kPa. During the experiment,
microcosms were moistened two to three times a week with deionized water to maintain soil moisture at 80 % of field ca-pacity for each mixture (Table S1 in the Supplement).
Plants were sown 24 h after watering the pots; and earth-worms were introduced 24 h after sowing. Each percent-age of GWC was combined with four treatments: a con-trol without organisms (C), a treatment with two individuals
(0.5±0.1 g each) of the endogenic earthworm species
Apor-rectodea caliginosa (E), a treatment with Lolium perenne plants (50 seeds with a 80 % germination rate scattered ho-mogeneously on the microcosm surface) (P), and a treatment with both earthworms and plants (EP). In total, 96 micro-cosms were divided into 24 treatments, each with four repli-cates.
Microcosms were kept 21 weeks in a climate
cham-ber (S10H, Conviron, Canada) under the
follow-ing conditions: photoperiod of 12 h, luminosity of
500±20 µmol photons m−2s−1; temperature at 22 and
20±0.2◦C during the day and at night, respectively; and
75±2 % air humidity.
Wst
Wre Wbs+max(Wre)
0.81
0.79
0.77
0.75
0.73
0.71
0.69
0.67
0.65
Sp
e
ci
fi
c
vo
lu
m
e
V
(k
g
kg
)
-1
Water content W(kg kg ) -1
Interpedal
Primary peds Primary particles
ip
Structural Basic
Residual
0.0 0.1 0.2 0.3 0.4 0.5
Wre
Wbs
Wst
Wip
Wip+max(Wst)
Figure 1.Configurations of water partitioning in macropores and micropores related to the shrinkage phases of a standard shrink-age curve (water contentW, specific volumeV). (Adapted from Braudeau et al., 2004.)
2.3 Shrinkage analysis
Technosol samples were collected from the surface of each microcosm at the end of the experiment using a 5 cm high, 5 cm diameter cylinder and were placed on a wet porous plate for saturation with deionized water according to the man-ual instructions of Eijkelkamp (referee) for 7 days by ap-plying a water potential of 0 kPa at the base of the sample. The shrinkage curve was continuously measured according
to Braudeau et al. (1999) by using the RETRACTOMETER©
apparatus. Water-saturated Technosol samples were placed in
an oven at a constant temperature (30◦C) to provide
contin-uous and rapid evaporation. An electronic scale (0.01 g pre-cision) ensured accurate measurement of water loss during drying. Each sample’s volume (diameter, height) was deter-mined with laser beams and recorded along with its mass every 10 min.
At the end of the measurement, samples were dried in an
oven at 105◦C for 48 h to measure dry mass and bulk
den-sity. These data were converted into soil specific volume (V,
cm3soilg−dry soil1 ) and water content (W, gwaterg−soil1). We then
determined the SSC to describe hydrostructural properties, as proposed by Assi et al. (2014). The data obtained by shrinkage measures were fitted according to the pedostruc-ture model (Braudeau et al., 2004). In this model, the SSC is subdivided into a maximum of four shrinkage phases (in-terpedal/saturated (ip), structural (st), basic (bs), and
resid-ual (re) shrinkage phases) due to the four types of water (Wip,
Wst,Wbs,Wre) (Fig. 1). The pedostructure is considered an
assembly of primary peds (aggregates formed by clay parti-cles) that determines two nested levels of organization: the
macropore level (containingWma=Wip+Wst) and the
mi-cropore level (containingWmi=Wre+Wbs). These levels do
sys-tems were called plasma (micropores) and structural proper-ties (macropores) (Boivin et al., 2004; Schaffer et al., 2008). The three transition points separating the four pseudo lin-ear shrinkage phases (Fig. 1) are points L, M, and N, which are at the intersection of the tangent straight lines of the linear phases. According to this model of SSC (Braudeau et al., 1999, 2004), the value of the water content at each
point is equal to the value of max (Wst) for WL, max
(Wmi)=max (Wre)+max (Wbs) forWM, and max (Wre) for
WN. The other hydrostructural parameters are slope of the
saturated phase (Kip); slope of the structural phase (Kst);
slope of the basic shrinkage phase (Kbs), slope of the residual
phase (Kre); and three parameters (KL,KM, andKN) related
to the SSC shape at points L, M, and N, respectively. Finally, according to Braudeau et al. (2001),
Max (Wre)=WN, (1)
Max (Wbs)=WM−WN, (2)
Max (Wst)=WL−WM. (3)
Specific volumeV as a function of the water contentW
ob-tained from the Braudeau model was converted into a void ratio (e, cm3porecm−solid3 ) as a function of the moisture ratio (ν, cm3watercm−solid3 ). This step makes it easier to compare Tech-nosols that have different compositions and thus different particle densities. Consider Eqs. (4) and (5):
ν=(ρs/ρw)W, (4)
e=Vρs−1, (5)
withρw being the water density andρs the particle density
(g cm−3) calculated for all mixtures from measurements of
GWC and EDH using a pycnometer on materials sieved at 2 mm (ISO 17892-3:2004).
All hydrostructural parameters were transformed with Eqs. (4) and (5) and thus became the moisture ratio at
macro-pore saturation (νL), the moisture ratio at micropore
satura-tion (νM), the moisture ratio at the shrinkage limit (νN), the
four slopes (KL, Kst, Kbs,Kre), parameters related to the
SSC shape (KL,KM,KN), and the void ratio at the end of
the shrinkage period (e0).
Considering these hydrostructural parameters (Braudeau et al., 2004), the ratio of the maximum available water for
plants from macropores (νma, cm3watercm
−3
solid) and the ratio
of the maximum available water for plants from micropores (νmi, cm3watercm
−3
solid) can be calculated from Eqs. (2) and (3)
as follows:
νma=νL−νM, (6)
νmi=νM−νN. (7)
The sum of both is the total moisture ratio (νTotal
in cm3watercm−solid3 ). Finally, volumetric water content (2,
cm3watercm3soil) was calculated to compare available water reservoirs (holding capacities) for plants:
2=ν·(ρd/ρs)=ν·(ρd/ρs) (8)
with ρd being the bulk density (gsolidcm−soil3). Similarly,
we calculated the volumetric water content from
macrop-ores (θma) and micropores (θmi), by applying the following
equations:
θma=θL−θM, (9)
θmi=θM−θN. (10)
Eventually the sum of both is known as the total volumetric
water content for plants (θTotal).
2.4 Plant harvest and root size distribution
Plants were cut at the soil surface 21 weeks after sowing.
Fresh leaves were weighed, dried in an oven at 50◦C for 2
days, and weighed again. Root mass was estimated from one quarter of the pot, since other quarters were used for physic-ochemical and shrinkage analyses, requiring non-disturbed soil physical properties (i.e., root or earthworm sampling).
Dry root biomass distribution among diameter classes was determined according to the method of Blouin et al. (2007). It is based on the granulometry method used to assess soil tex-ture: roots are dried, cut transversely with a mixer, and placed on a column of sieves with decreasing mesh size. During the shaking of the sieve column, root fragments with a section diameter smaller than the mesh size pass through this mesh and stop on the first sieve with a mesh size below that of the root section diameter. Biomass distribution is assessed by weighing the biomass recovered in each sieve. Five diam-eter classes were chosen according to sieve mesh size: 0–100,
100–200, 200–400, 400–800, and>800 µm.
2.5 Data analysis
We calculated means and standard errors of hydrostructural parameters for all treatments by fitting the curves with the hydrostructural model (Table S2). The hydrostructural
pa-rameter representing the slope of the interpedalKip phase,
the kM parameter related to the shape of the soil
shrink-age curves, and Kre the slope of the residual phase were
not included, since they were constants for all mixtures
(Kip=1), (KM= −53), and (Kre=0). Statistical analyses
Table 2.Two-way ANOVA showing the effects of the presence/absence of earthworms (E) and the proportion of green waste compost (GWC) in the mixtures on plant dry biomasses, shoot : root ratio, and root system structure (thick root≥400 µm and fine root<400 µm) (n=48) (d.f. is degrees of freedom).
d.f. Aboveground Belowground Total biomass Shoot : root Thick root Fine root biomass (g) biomass (g) (g) ratio proportion proportion
Complete model 11 11.29∗∗∗ 5.85∗∗∗ 13.33∗∗∗ 1.27ns 0.78ns 0.95ns
GWC 5 10.27∗∗∗ 8.73∗∗∗ 16.22∗∗∗ 2.08ns 0.49ns 0.72ns
E 1 65.65∗∗∗ 15.24∗∗∗ 60.12∗∗∗ 0.14ns 0.62ns 1.59ns
GWC·E 5 1.43ns 1.08ns 0.39ns 0.68ns 0.56ns 1.05ns
The number in the table are theFvalues; significance codes:∗P≤0.05,∗∗P≤0.01,∗∗∗P≤0.001,nsP >0.05.
Compost ratio V%
0 10 20 30 40 50
Abo
v
eg
roun
d bi
omass
(
g
)
2,5 3,0 3,5 4,0 4,5
Compost ratio V%
0 10 20 30 40 50
T
otal
bi
omass
(
g
)
4 5 6 7 8 9
Compost ratio V%
0 10 20 30 40 50
Ro
ot bi
omass
(
g
)
1,5 2,0 2,5 3,0 3,5
4,0 Plant
Earthworm and plant
a a
a a a
a a
a a ab
bc
a a
a ab
b b b b
b
b b b
a a
a b
bc c c c
c c cd
d
(a) (b) (c)
ab
Tot
al
bio
mass
(g)
B
elow
gr
oun
d
b
io
m
ass
(g)
Abov
eg
roun
d
b
io
m
ass
(g)
1.5 2.0 2.5 3.0 3.5 4.0
2.5 3.0 3.5 4.0 4.5
GWC ratio V% GWC ratio V% GWC ratio V%
4.0 5.0 6.0 7.0 8.0 9.0
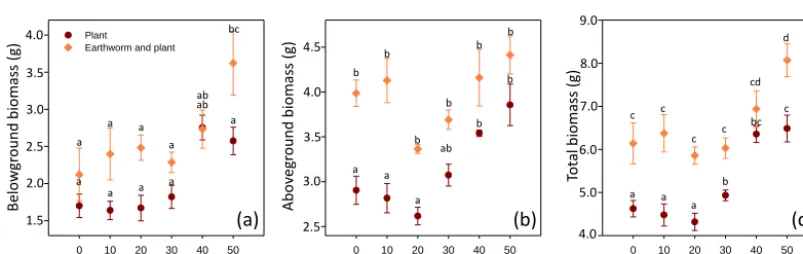
Figure 2.(a) Belowground, (b) aboveground and (c) total biomass production of Lolium perenne according to different ratios of green
waste compost in the presence/absence of the earthworm Aporrectodea caliginosa; mean±SE,n=4 per treatment. Tukey test, significant differences are indicated by different letters,P <0.05.
separation based on hydrostructural variables was tested with Wilks and Pillai tests. The influences of the presence/absence of earthworms and the percentage of GWC were assessed with two-way or three-way ANOVA with GWC, earthworms, and plants taken separately. Independent variables were con-sidered to have an influence on dependent variables when the
probability value was<0.05.
3 Results
3.1 Plant growth and development
Belowground biomass ranged from 1.7 to 3.6 g and above-ground biomass from 2.9 to 4.4 g, which amounted to a total biomass of 4.6 to 8.1 g (Fig. 2). Two-way ANOVA showed that both GWC percentage and the presence of earthworms had a positive effect on dry belowground, aboveground, and total biomasses (Table 2). GWC percentage had almost no influence from 0 to 30 % on total biomass but increases plant production at 40 and 50 % (Fig. 2a–c). Earthworm presence had a positive effect on belowground biomass only at 50 % GWC, whereas aboveground biomass was affected only in the 0–30 % GWC range. As a result total biomass was al-ways significantly higher in the presence of earthworms, ex-cept at 40 % GWC. On average, earthworms increased to-tal plant biomass of 21 % (Fig. 2c). The best treatment for
plant growth was clearly the mixture of 50 % GWC with earthworms, with a total dried plant biomass of 8.1 g, which was significantly higher than all other mixtures, except for 40 % GWC with earthworms. There was no interaction be-tween the effects of GWC percentage and earthworms on plant biomasses, which means that these two effects are addi-tive. All parameters describing biomass allocation inside the
plant, such as the root : shoot ratio and the thick (≥400 µm)
and fine (<400 µm) root percentages, were not affected by
the presence of GWC percentage, earthworms, or their in-teraction (Table 2); we thus concluded that GWC percentage and presence of earthworms had a quantitative influence but not a qualitative one, as growth was affected but not devel-opment.
3.2 Specific influence of organisms and parent materials on the hydrostructural parameters
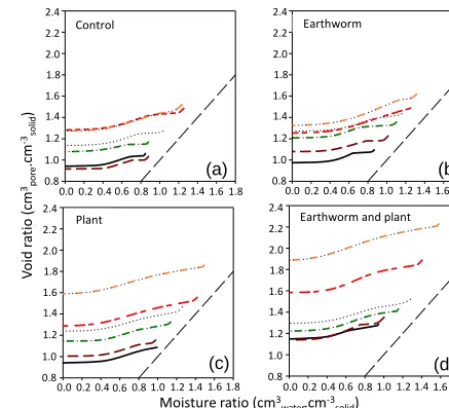
All our Technosols exhibited the classical sigmoid shape of the shrinkage curve reported for most natural soils (Laurizen, 1948; Braudeau et al., 1999; Peng and Horn, 2005) (Figs. 3 and 4); thus, shrinkage phases (residual, basic, structural, and the saturating shrinkage phase) were easy to recognize. All the parameters deduced from SSC are given in Table S2.
High GWC percentage caused moisture ratioν and void
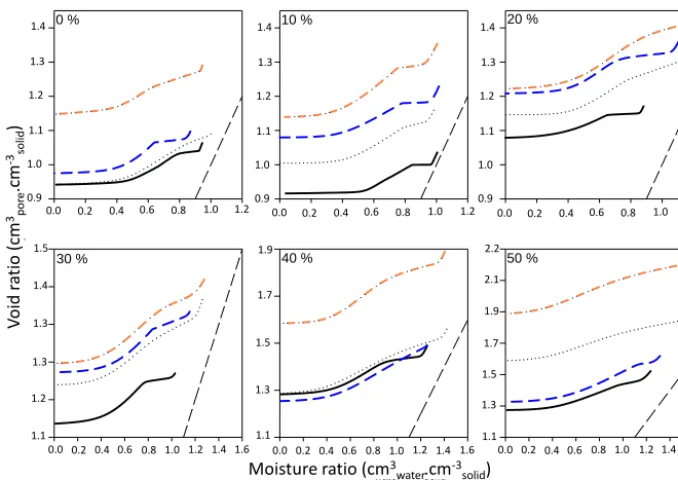
per-centage was particularly important in treatments with plants at 50 % GWC (Fig. 3c) and in treatment with earthworms and plants at 40 and 50 % (Fig. 3d). Earthworms showed a posi-tive influence on the void ratio in the 0–30 % GWC range, but this positive effect disappeared at 40 and 50 % GWC (Fig. 4). The influence of plants on void ratio was positive for 10, 20, 30, and 50 % GWC but not at 0 and 40 % GWC (Fig. 4). The simultaneous presence of plants and earthworms resulted in a positive effect on void ratio for all mixtures (Fig. 4). For
ex-amplee0varied in the range of 0.9–1.4, 1.0–1.4, 0.9–1.6, and
1.2–1.9 cm3cm−3for control, earthworms, plants, and plants
and earthworms, respectively (Fig. 4). This corresponded to an increase of 59 % in the presence of plants, 42 % in the presence of earthworms, and 77 % in the presence of both plants and earthworms as compared with the control, for the
void ratio at macropore saturation (νL) in the 50 % GWC
mixture. The moisture ratio was also positively affected by the GWC percentage; for example when we compared mois-ture ratio at macropore saturation we noticed an increase of 59 % between treatments 0 and 50 % GWC in the control without organisms (Fig. 3a). SSC revealed that the presence of organisms had a somewhat similar effect on hydrophysi-cal properties of Technosols to GWC percentage: for exam-ple, the aspect of shrinkage curves when GWC was 0 % in the presence of earthworms and plants seemed like the
con-trol treatment at 30 % GWC (Fig. 4):e0(e0=1.1) and total
moisture ratio (≈1 cm3cm−3) (Table S2). The slopes in the
structural phase (Kst) were steeper in the presence of plants.
We noticed that the structural phase in the presence of earth-worms reveals itself to be shorter for 40 and 50 % GWC than in the 0–30 % GWC range (Fig. 4).
RDA performed on eight hydrostructural parameters of the Table S2 showed that the factors “GWC percentage” and “organisms” had an influence on hydrostructural parameters. The total percentage of variance explained by these factors
was high: 72 % (P=0.005). The influence of factors taken
independently was not very high: the total percentage of vari-ance explained by the GWC percentage, regardless of the
or-ganisms, was 14 % (P =0.005), while the total percentage of
variance explained by the organisms, regardless of the GWC
percentage, was 19 % (P=0.005). Taken together, the
sin-gle factors accounted thus for 33 % of explained variance,
whereas their interaction (organisms×GWC percentage
ef-fect, estimated from the subtraction of single factors’ effects from total variance) was responsible for 39 % of the vari-ance (72–33 %). This means that predicting variations in hy-drostructural parameters of our Technosols requires taking into account variation in parent materials and organisms si-multaneously.
The LDA explained 76 % of hydrostructural
proper-ties’ observed variance (P <0.001; Wilks and Pillai tests)
(Fig. 5). Axis 1, which explained 42 % of the total variance, distinguished treatment “earthworms” from treatment “earth-worms and plants”, whereas axis 2, which explained 26 % of the total variance, separated the “control” and the “plants”
Control
0,0 0,2 0,40,6 0,8 1,0 1,2 1,4 1,61,8
V oid rat io (cm 3pore .cm -3solid ) 0,8 1,0 1,2 1,4 1,6 1,8 2,0 2,2 2,4 Earthworm
0,0 0,20,4 0,6 0,8 1,0 1,21,4 1,6 1,8 0,8 1,0 1,2 1,4 1,6 1,8 2,0 2,2 2,4 Plant
0,0 0,2 0,4 0,6 0,8 1,01,2 1,4 1,6 1,8 0,8 1,0 1,2 1,4 1,6 1,8 2,0 2,2 2,4
Erthworm and plant
Moisture ratio (cm3watercm-3solid)
0,00,2 0,4 0,6 0,8 1,01,2 1,4 1,6 1,8 0,8 1,0 1,2 1,4 1,6 1,8 2,0 2,2 2,4
0% 10% 20% 30% 50% Saturation line 0.0 0.2 0.4 0.6 0.8 1.0 1.2 1.4 1.6 1.8 0.0 0.2 0.4 0.6 0.8 1.0 1.2 1.4 1.6 1.8
0.0 0.2 0.4 0.6 0.8 1.0 1.2 1.4 1.6 1.8 0.0 0.2 0.4 0.6 0.8 1.0 1.2 1.4 1.6 1.8 0.8
1.0 1.2 1.4 1.6 1.8 2.0 2.2 2.4 0.8 1.0 1.2 1.4 1.6 1.8 2.0 2.2 2.4 0.8 1.0 1.2 1.4 1.6 1.8 2.0 2.2 2.4 0.8 1.0 1.2 1.4 1.6 1.8 2.0 2.2 2.4
Moisture ratio (cm3
water.cm-3solid)
V o id ra tio (c m 3 po re .c m -3 so lid ) Earthworm Control
Earthworm and plant Plant
0 % 10 % 20 % 50 %
(a) (b)
(c) (d)
Saturation line
30 % 40 %
Figure 3.Averaged shrinkage curves (n=4 per curve) for the six mixtures of GWC and excavated deep horizons (0, 10, 20, 30, 40, 50 % of GWC) reported as the void ratio as a function of the mois-ture ratio. Each panel represents one of the four treatments: (a) con-trol, (b) earthworms, (c) plants, and (d) earthworms and plants. The dashed line represents the saturation line.
treatments. By relating the correlation circle (Fig. 5a) to the factorial plan (Fig. 5b) we found that (i) the parameter re-lated to the shape of shrinkage curves between interpedal and
structural phases (KL) was higher for the control than for
or-ganism treatments; (ii) earthworms increased moisture ratio
at the shrinkage limit (νN); (iii) plants increased the slope
of the structural phase (Kst); and (iv) the simultaneous
pres-ence of plants and earthworms increased the moisture ratio
at saturated macropores (νL), minimum void ratio (e0), and a
parameter related to the shape of shrinkage curves (KN).
Additional PCAs were performed to characterize the effect of organisms on hydrostructural properties for each GWC percentage. The effect of plants was not significant at 0, 10,
and 20 % GWC (P >0.05, Monte Carlo test), while it was
significant at 30, 40, and 50 % GWC (P <0.05, Monte Carlo
test). In contrast, combined influences of plants and
earth-worms were always significant (P <0.05, Monte Carlo test).
3.3 Influence of organisms and parent materials on moisture ratio and available water for plants
The complete ANOVA model with GWC percentage,
earth-worms, and plants had a significant effect (P <0.001) on
micropore, macropore, and total moisture ratios and avail-able volumetric water contents (Tavail-able 3). Considering sin-gle factors, increasing the GWC had a positive influence
on micropore, macropore (GWC<40 %) and total moisture
ratios and available volumetric water contents (P <0.001).
ex-20 %
0,0 0,2 0,4 0,6 0,8 1,0 1,2 0,9
1,0 1,1 1,2 1,3 1,4
30 %
0,0 0,2 0,4 0,6 0,8 1,0 1,2 1,4 1,6 1,1
1,2 1,3 1,4 1,5 1,6
40 %
Moisture ratio (cm3watercm-3solid)
0,0 0,2 0,4 0,6 0,8 1,0 1,2 1,4 1,6 1,1
1,3 1,5 1,7 1,9
50 %
0,0 0,2 0,4 0,6 0,8 1,0 1,2 1,4 1,6 1,1
1,3 1,5 1,7 1,9 2,1 2,3 10 %
0,0 0,2 0,4 0,6 0,8 1,0 1,2 0,9
1,0 1,1 1,2 1,3 1,4 0 %
0,0 0,2 0,4 0,6 0,8 1,0 1,2
V
oid
rat
io
(c
m
3 po
re
.cm
-3 solid
)
0,9 1,0 1,1 1,2 1,3 1,4
Control Earthworm Plant Earthworm and plant Saturation line
0.9 1.0 1.1 1.2 1.3 1.4
0.9 1.0 1.1 1.2 1.3 1.4
0.9 1.0 1.1 1.2 1.3 1.4
1.1 1.2 1.3 1.3 1.4 1.5
1.1 1.3 1.5 1.7 1.9
1.1 1.3 1.5 1.7 1.9 2.1 2.2
0.0 0.2 0.4 0.6 0.8 1.0 1.2 0.0 0.2 0.4 0.6 0.8 1.0 1.2 0.0 0.2 0.4 0.6 0.8 1.0 1.2
0.0 0.2 0.4 0.6 0.8 1.0 1.2 1.4 1.6 0.0 0.2 0.4 0.6 0.8 1.0 1.2 1.4 1.6 0.0 0.2 0.4 0.6 0.8 1.0 1.2 1.4 1.6
Moisture ratio (cm3water.cm-3solid)
V
o
id
ra
tio
(c
m
3 po
re
.c
m
-3 so
lid
)
Figure 4.Averaged shrinkage curves (n=4 per curve) for the four treatments (control, earthworms, plants, earthworms and plants) reported as the void ratio as a function of the moisture ratio. Each panel represents one mixture of GWC and excavated deep horizons: (a) 0 % GWC,
(b) 10 % GWC, (c) 20 % GWC, (d) 30 % GWC, (e) 40 % GWC, (f) 50 % GWC. The dashed line represents the saturation line.
e0
nL nm nn Kbs
Kst KN
KL
C
E
EP
P
KL
Kbs
KN
Kst L
e0
M N
(a) (b)
42 %
26 %
Figure 5.Linear discriminant analysis of the influence of control, earthworm, plant, and both earthworm and plant on hydrostructural parameters. The first and the second axes explained 42 and 26 % of the variance, respectively.νL: moisture ratio at saturated macrop-ores;νM: moisture ratio at saturated micropores;νN: limit of shrink-age;e0: void ratio at the end of the shrinkage curve;Kst: the slope of structural phase;Kbs: the slope of the basic phase; andKL,KN: parameters related to shape form.
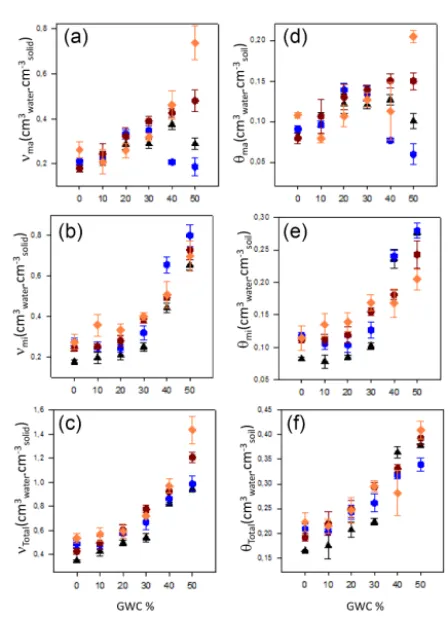
cept for micropore volumetric available water content. Earth-worms affected micropore and total moisture ratios but not the macropores moisture ratio; they affected micropore vol-umetric available water content (Table 3).
The presence of earthworms influenced the effect of GWC percentage on moisture ratio and total volumetric available water contents at macropore and micropore. For example, in the absence of earthworms, GWC percentage had a positive influence on moisture ratio at macropore for 0–40 % GWC,
while in the presence of earthworms, moisture ratio at macro-pore decreased at percentages of 30–50 %. The presence of plants modified the influence of GWC percentage on mois-ture ratios at micropore and macropore, and total volumetric available water at macropore and micropore. For example, in the absence of plants, the influence of GWC percentage on moisture ratio at macropore was positive at percentages of 0– 40 % and became negative at 50 %, whereas in the presence of plants, the influence of GWC was positive regardless of its percentage (Fig. 4a). A similar influence was observed for the interaction between plants and GWC percentage on macrop-ore volumetric available water (Fig. 6d). The interaction be-tween earthworms and plants had a significant effect only for moisture ratios in micropore and macropore but not for total moisture ratio, suggesting an opposite effect on
microp-ores and macropmicrop-ores (Table 3). Indeed,νmawas higher in the
plants and earthworms treatment as compared with the plant
treatment and the earthworm treatment, butνmi was higher
Table 3.Three-way ANOVA testing the effect of GWC, earthworms (E), and plants (P) on the maximum moisture ratio from macropores (νmacm3watercm
−3
solid), maximum moisture from micropores (νmicm3watercm
−3
solid), total moisture ratio (νTotalcm3watercm
−3
solid), macro avail-able water (θmacm3watercm−soil3), micro available water (θmacm3watercm−soil3), and finally total available water (θTotalcm3watercm
−3
soil) (n=96) (d.f. is degrees of freedom).
d.f. νma νmi νTotal θma θmi θTotal
Complete model 23 13.68∗∗∗ 18.63∗∗∗ 34.91∗∗∗ 10.73∗∗∗ 26.77∗∗∗ 23.8∗∗∗ GWC 5 34.35∗∗∗ 122.36∗∗∗ 124.30∗∗∗ 13.89∗∗∗ 103.01∗∗∗ 98.61∗∗∗
P 1 66.16∗∗∗ 23.97∗∗∗ 43.06∗∗∗ 35.47∗∗∗ 0.07ns 16.88∗∗∗
E 1 0.42ns 31.62∗∗∗ 19.59∗∗∗ 0.36ns 4.26∗ 1.51ns
P·E 1 5.63∗ 7.25∗∗ 1.88ns 2.28ns 3.09ns 0.23ns
GWC·P 5 27.64∗∗∗ 4.87∗∗∗ 1.46ns 17.97∗∗∗ 16.16∗∗∗ 2.64∗
GWC·E 5 3.55∗∗ 0.96ns 1.78ns 2.41∗ 2.02ns 2.73∗
GWC·P·E 5 11.47∗∗∗ 1.42ns 1.26ns 7.44∗∗∗ 0.45ns 1.80ns
The number in the table are theFvalues; significance codes:∗P≤0.05,∗∗P≤0.01,∗∗∗P≤0.001,nsP >0.05.
Figure 6. Moisture ratio at (a) maximum saturated macro-pores (νmacm3watercm−solid3 ) and (b) maximum saturated micropores (νmicm3watercm
−3
solid); (c) total moisture ratio (νTotalcm3watercm−solid3 ); available water of (d) macropores (θmacm3watercm
−3
soil) and (e) micropores (θmicm3watercm
−3 soil); and (f) total available water (θTotalcm3watercm
−3
soil) according to the proportion of compost for the four organism treatments (presence/absence of earthworms and/or plants). Mean±SE,n=4 per treatment.
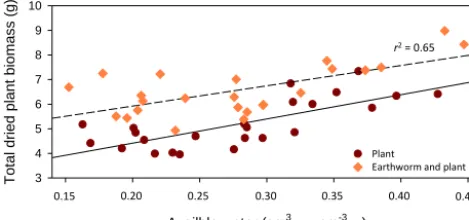
3.4 Relation between total plant biomass and available water
Linear regressions between total plant biomass (g) and
avail-able volumetric water content (cm3watercm−soil3) were
per-formed using earthworm presence or absence as a cat-egorical independent variable (Fig. 7). Significant differ-ences were found between total plant biomass with or
without earthworms (P <0.001), and plant biomass was
higher with earthworms than without. In addition, total
plant biomass increased with available water (P <0.001).
However the difference in slope of the two linear
re-gressions (Fig. 6) was not significant (P =0.569). The
best equations summarizing the relation between
to-tal dried plant biomass (X, g) and plant-available
wa-ter (θTotal, cm3watercm
−3
soil) were X=8.97·θTotal+4.07 and
X=8.97·θTotal+2.69 with and without earthworms,
re-spectively (P <0.001, adjustedr2=0.65). Table S3 showed
the results of both equations.
4 Discussion
Availble water (cm3water.cm-3soil)
0,15 0,20 0,25 0,30 0,35 0,40 0,45
T
ot
al
dri
ed
plant
biom
ass
(
g
)
3 4 5 6 7 8 9 10
Plant
Plant and erthworm Plant
Earthworm and plant
0.15 0.20 0.25 0.30 0.35 0.40 0.45
r2= 0.65
Figure 7.Linear regression between total dry plant biomass and available water (cm3watercm−soil3) with earthworm (dotted line) or without earthworm (plain line). Plant biomass was higher with earthworms than without (P <0.001). Total plant biomass in-creased with available water, but the difference in slope of the two linear regressions was not significant. The best equations fitting the relation between total dried plant biomass (X,g) and plant avail-able water (θTotalcm3watercm
−3
soil) areX=8.97·θTotal+4.07 and X=8.97·θTotal+2.69 with and without earthworms, respectively (P <0.001, adjustedr2=0.65).
sigmoid shape even at the highest GWC percentage (50 %, V/V). Because this organization is often, but not always, ob-served in natural soils, we conclude that after 5 months mix-tures of mineral and organic materials behave as many natu-ral soils from a hydrostructunatu-ral viewpoint.
4.1 Influence of green waste compost on hydrostructural properties
Shrinkage curve analysis indicated a positive correlation be-tween the amount of GWC percentage and the quantity of macropores and micropores. This is likely due to organic matter present in the GWC: an increase in total void ratio was also observed in natural soil amended with organic mat-ter (McCoy, 1998; Marinari et al., 2000; Tejada and Gon-zalez, 2003) and recently in Technosols (Paradelo and Bar-ral, 2013). The addition of GWC to EDH seems a promising strategy to obtain useful hydric properties that match plant needs for water and are similar to those observed in natural organic soils.
4.2 Influence of earthworm Aporrectodea caliginosa on hydrostructural properties
Earthworms were responsible for a significant increase in to-tal moisture ratio (Fig. 5c). This was the result of an increase in moisture ratio at saturated micropore, not macropore (Fig. 5). Through this mechanism, earthworms are likely to have a positive impact in climates with occasional droughts. Earthworms might thus help plants to face a water deficit in drying Technosols and effectively contribute to water reg-ulation. This result was surprising: earthworms are gener-ally known to affect macroporosity through their galleries.
Our results differed from those obtained with Allolobophora chlorotica, an endogenic earthworm that compacts the soil and was responsible for a decrease in porosity, measured by shrinkage curves (Milleret et al., 2009; Kohler-Milleret et al., 2013). These discrepancies between results could be due to the endogenic earthworm influences on hydrostruc-tural properties that are species-specific, or to the parent ma-terials used in the experiment. For example, when the
per-centage of GWC was>30 %, the soil was also slightly
com-pacted by earthworms. However, with GWC ratio ≤30 %,
earthworms tend to increase void ratio (Fig. 4). The absence of an increase in macroporosity caused by earthworms could also be explained by a progressive compaction of the soil throughout the experiment, with a decrease in macroporos-ity, as is observed in Technosols (Jangorzo et al., 2013). This phenomenon could be particularly common with experimen-tal Technosols made of sieved parent materials, which have never been subjected to previous shrinkage.
4.3 Influence of Lolium perenne on hydrostructural properties
The general influence of roots on soil structure was observed by Monroe and Kladivko (1987), Angers and Caron (1998), and Kautz et al. (2013). This positive effect is mainly due to plants’ abilities to create macro-aggregates and macropores. Similar results have been reported in other studies (Reid and Goss, 1982; Caron et al., 1996). Moreover, the positive in-fluence of plants on moisture ratio at macropore increased with the presence of earthworms. It was not due to the direct influence of earthworms, which improved moisture ratio at
saturated micropore (νNandνM) but had a null influence on
moisture ratio at saturated macropore. This synergistic effect between plants and earthworms was thus likely to be due to an increase of the plant influence in the presence of earth-worms (Fig. 7). Indeed, earthearth-worms were increasing plant root biomass (Fig. 2), and thus the positive effect of plant roots on hydrostructural properties was improved. This re-sult emphasizes the importance of considering ecological in-teractions among functional groups such as plants and earth-worms.
Because the influence of plants on hydrostructural proper-ties was significant at 30–50 % GWC, one had to consider the initial composition of mixtures of materials to benefit from this organismal positive feedback.
4.4 Interactions between organisms and parent materials in Technosol pedogenesis
This study allows comparing the influence of the proportion of parent materials (0–50 % GWC) and the presence of or-ganisms (presence/absence of plants and earthworms) on pe-dogenesis. These situations are far from covering all kinds of parent materials and organisms but are a first attempt to compare the relative importance of soil-forming factors un-der experimental conditions based on parent materials that never experienced the biological activity of macro-organisms such as plants and earthworms. We found that variations in Technosol hydrostructural properties were poorly explained by parent materials alone (14 % of explained variance) and by organisms alone (19 % of variance), whereas material– organism interaction explained more than the sum of their
in-dividual influences (39 %>33 %). This complexity brought
about by ecological interaction between organisms and their abiotic environment could partly explain the debate between those considering that organisms play a negligible role in pedogenesis (Jenny, 1941; Carson and Kirkby, 1972) versus those stressing their importance (Paton, 1978; Wilkinson and Humphreys, 2005). Indeed, if the influence of organisms is particularly important in interaction with parent materials, its observation may be random. Pedogenesis, particularly in the case of Technosol, appears as an internal disciplinary field of study that needs two ecological aspects. We found that bio-logical activity improved Technosol properties by increasing aggregation, porosity, and water-retention capacity, with po-tential consequences on resistance to drought and erosion. An original research perspective could be to investigate ben-efits of these changes caused by plants and earthworms for their own survival and reproduction to determine if these bi-ological activities increase the fitness of these organisms and could thus be considered as a niche construction (Odling-Smee et al., 1996).
5 Conclusions
In a nutshell, we found that compost and plants play a posi-tive role in macroporosity and microporosity in Technosols, while earthworms affect only microporosity. GWC percent-age positively affected macroporosity up to a percentpercent-age of 30 %, and plants were responsible for extending this positive influence at 40 and 50 % GWC. The simultaneous presence of earthworms and plants was responsible for a synergis-tic, positive influence on macroporosity. These observations highlighted the need to consider plants not only as an output indicating the level of fertility, but also as an actor in Tech-nosol construction, like earthworms. Organisms that
physi-cally modify their environment by creating, destroying, or maintaining ecological niches have been called “ecosystem engineers” (Jones et al., 1994). These ecosystem engineers can help restore ecosystems (Byers et al., 2006) and create new ecosystems such as constructed Technosols by assisting managers, who could “subcontract” one aspect of manage-ment. Therefore, instead of increasing the amount of com-post, which is usually expensive, managers could avoid the difficult-to-explain negative influence of high percentages of compost by favoring conservation, recolonization, or inocu-lation of ecosystem engineers such as plants and earthworms, especially in combination (Blouin et al., 2013).
The Supplement related to this article is available online at doi:10.5194/soil-2-163-2016-supplement.
Acknowledgements. This study was conducted in collaboration with the Departmental Council of the Seine-Saint-Denis depart-ment, France, and the company Enviro Conseil et Travaux. The authors wish to thank the University of Damas, Syria, for financial support via a PhD scholarship. We also thank Thierry Desjardins, Gaghik Hovhannissian, and Pascal Podwojewski for their scientific advice and Florence Dubs for her help with statistical analyses. Michael Corson was responsible for post-editing the English.
Edited by: A. Don
References
Amundson, R., Richter, D. D., Humphreys, G. S., Jobbágy, E. G., and Gaillardet, J.: Coupling between biota and earth materials in the critical zone, Elements, 3, 327–332, doi:10.2113/gselements.3.5.327, 2007.
Angers, D. A. and Caron, J.: Plant-induced changes in soil struc-ture: Processes and feedbacks, Biogeochemistry, 42, 55–72, doi:10.1023/A:1005944025343, 1998.
Arocena, J. M., van Mourik, J. M., Schilder, M. L. M., and Faz Cano, A.: Initial soil development under Pioneer plant species in metal mine waste deposits, Restor. Ecol., 18, 244–252, doi:10.1111/j.1526-100X.2009.00582.x, 2010.
Assi, A. T., Braudeau, E. F., Accola, J. J. O., Hovhannissian, G., and Mohtar, R.: Physics of the soil medium organization part 2: pe-dostructure characterization through measurement and modeling of the soil moisture characteristic curves, Soil Process., 2, 1–17, doi:10.3389/fenvs.2014.00005, 2014.
Beven, K. and Germann, P.: Macropores and water flow in soils, Water Resour., 18, 1311–1325, doi:10.1029/WR018i005p01311, 1982.
Blanchart, E., Lavelle, P., Braudeau, E., Le Bissonnais, Y., and Valentin, C.: Regulation of soil structure by geophagous earth-worm activities in humid savannas of Côte d’Ivoire, Soil Biol. Biochem., 29, 431–439, doi:10.1016/S0038-0717(96)00042-9, 1997.
physi-cal properties of Vertisol under a Digitaria decumbens pas-ture (Martinique, WI), Agr. Ecosyst. Environ., 103, 343–355, doi:10.1016/j.agee.2003.12.012, 2004.
Blouin, M., Lavelle, P., and Laffray, D.: Drought stress in rice (Oryza sativa L.) is enhanced in the presence of the compacting earthworm Millsonia anomala, Environ. Exp. Bot., 60, 352–359, doi:10.1016/j.envexpbot.2006.12.017, 2007.
Blouin, M., Hodson, M. E., Delgado, E. A., Baker, G., Brussaard, L., Butt, K. R., Dai, J., Dendooven, L., Peres, G., Tondoh, J. E., Cluzeau, D., and Brun, J.-J.: A review of earthworm impact on soil function and ecosystem services, Eur. J. Soil Sci., 64, 161– 182, doi:10.1111/ejss.12025, 2013.
Boivin, P., Garnier, P., and Tessier, D.: Relationship between Clay Content, Clay Type, and Shrinkage Properties of Soil Samples, Soil Sci. Soc. Am. J., 68, 1145–1153, 2004.
Boivin, P., Schäffer, B., and Sturny, W.: Quantifying the relationship between soil organic carbon and soil physical properties using shrinkage modelling, Eur. J. Soil Sci., 60, 265–275, 2009. Braudeau, E., Costantini, J. M., Bellier, G., and Colleuille, H.:
New device and method for soil shrinkage curve measure-ment and characterization, Soil Sci. Soc. Am. J., 63, 525–535, doi:10.2136/sssaj1999.03615995006300030015x, 1999. Braudeau, E., Mtimet, A., Loukil, A., Zidi, C., Derouiche, C.,
Decluseau, D., Jelassi, M., and Hachicha, M.: A pedological in-formation system, Soil Tunisia, 32, 0330–2059, 2001.
Braudeau, E., Frangi, J. P., and Mohtar, R. H.: Characterizing non-rigid aggregated soil-water medium using its shrinkage curve, Soil Sci. Soc. Am. J., 68, 359–370, 2004.
Byers, J. E., Cuddington, K., Jones, C. G., Talley, T. S., Hastings, A., Lambrinos, J. G., Crooks, J. A., and Wilson, W. G.: Using ecosystem engineers to restore ecological systems, Trends Ecol. Evol., 21, 493–500, doi:10.1016/j.tree.2006.06.002, 2006. Caron, J., Espindola, C. R., and Angers, D. A.: Soil
struc-tural stability during Rapid Wetting: Influence of land use on some aggregate Properties, Soil Sci. Soc. Am. J., 60, 901–908, doi:10.2136/sssaj1996.03615995006000030032x, 1996. Carson, M. A. and Kirkby, M. J.: Hillslope form and process,
Cam-bridge University Press, New York, 1972.
Charman, P. E. V. and Murphy, B. W. (Eds.): Soil conservation ser-vice of New South Wales, in: Soils: their properties and manage-ment, Oxford University Press, Melbourne, Oxford, 4–36, 2000. Deeb, M., Grimaldi, M., Lerch, T. Z., Pando, A., Podwojewski, P., and Blouin, M.: Effect of organic content on the water retention and shrinkage properties of Constructed Technosols, Pedosphere, doi:10.1016/S1002-0160(15)60, in press, 2016.
Dorioz, J. M., Robert, M., and Chenu, C.: The role of roots, fungi and bacteria on clay particle organization. An experi-mental approach, Geoderma, 56, 179–194, doi:10.1016/0016-7061(93)90109-X, 1993.
Dray, S. and Dufour, A. .B: The ade4 package: implementing the duality diagram for ecologists, J. Stat. Softw., 22, 1–20, 2007. Edwards, C. A,: Earthworm ecology, CRC Press, USA, 20 pp.,
2004.
Eisenhauer, N., Partsch, S., Parkinson, D., and Scheu, S.: Invasion of a deciduous forest by earthworms: Changes in soil chemistry, microflora, microarthropods and vegetation, Soil Biol. Biochem., 39, 1099–1110, doi:10.1016/j.soilbio.2006.12.019, 2007.
Haines, W. B.: The volume-changes associated with varia-tions of water content in soil, J. Agric. Sci., 13, 296–310, doi:10.1017/S0021859600003580, 1923.
Innes, L., Hobbs, P. J., and Bardgett, R. D.: The impacts of individual plant species on rhizosphere microbial communi-ties in soils of different fertility, Biol. Fertil. Soils, 40, 7–13, doi:10.1007/s00374-004-0748-0, 2004.
IUSS Working Group WRB: World Reference Base for Soil Re-sources 2014, update 2015 International soil classification sys-tem for naming soils and creating legends for soil maps, World Soil Resources Reports No. 106, FAO, Rome, p. 87, 2015. Jangorzo, N. S., Watteau, F., and Schwartz, C.: Evolution of the
pore structure of constructed Technosols during early pedogene-sis quantified by image analypedogene-sis, Geoderma, 207–208, 180–192, doi:10.1016/j.geoderma.2013.05.016, 2013.
Jangorzo, N. S., Watteau, F., Hajos, D., and Schwart, C.: Nonde-structive monitoring of the effect of biological activity on the pedogenesis of a Technosol, J. Soils Sediments, 15, 1705–1715, doi:10.1007/s11368-014-1008-z, 2014.
Jari Oksanen, F., Blanchet, G., Kindt, R., Legendre, P., Minchin, P. R., O’Hara, R. B., Simpson, G. L., Solymos, P., Henry, M., Stevens, H., and Wagner, H.: vegan: Community ecology pack-age, 5–20, 2013.
Jastrow, J. D., Miller, R. M., and Lussenhop, J.: Contributions of interacting biological mechanisms to soil aggregate stabi-lization in restored prairie, Soil Biol. Biochem., 30, 905–916, doi:10.1016/S0038-0717(97)00207-1, 1998.
Jenny, H.: Factors of soil formation, McGraw-Hill, New York, Lon-don, 52–261, 1941.
Jones, C. G., Lawton, J. H., and Shachak, M.: Organisms as ecosys-tem engineers, in: Ecosysecosys-tem Management, edited by: Samson, F. B. and Knopf, F. L., Springer, New York, 130–147, 1994. Kautz, T., Amelung, W., Ewert, F., Gaiser, T., Horn, R., Jahn, R.,
Javaux, M., Kemna, A., Kuzyakov, Y., Munch, J.-C., Pätzold, S., Peth, S., Scherer, H. W., Schloter, M., Schneider, H., Vander-borght, J., Vetterlein, D., Walter, A., Wiesenberg, G. L. B., and Köpke, U.: Nutrient acquisition from arable subsoils in temperate climates: A review, Soil Biol. Biochem., 57, 1003–1022, 2013. Kohler-Milleret, R., Le Bayon, R.-C., Chenu, C., Gobat, J.-M., and
Boivin, P.: Impact of two root systems, earthworms and mycor-rhizae on the physical properties of an unstable silt loam Luvisol and plant production, Plant Soil, 370, 251–265, 2013.
Lauritzen, C.: Apparent specific volume and shrinkage characteris-tics of soil materials, Soil Sci. Febr., 65, 155–180, 1948. Lavelle, P. and Spain, A.: Soil ecology, Springer Science & Business
Media, Dordrecht, Boston, London, 667–668, 2001.
Lehmann, A. and Stahr, K.: Nature and significance of anthro-pogenic urban soils, J. Soils Sediments, 7, 247–260, 2007. Marinari, S., Masciandaro, G., Ceccanti, B., and Grego, S.:
In-fluence of organic and mineral fertilisers on soil biologi-cal and physibiologi-cal properties, Bioresour. Technol., 72, 9–17, doi:10.1016/S0960-8524(99)00094-2, 2000.
Marshall, R. E. and Farahbakhsh, K.: Systems approaches to inte-grated solid waste management in developing countries, Waste Manage., 33, 988–1003, 2013.
Milleret, R., Le Bayon, R.-C., Lamy, F., Gobat, J. M., and Boivin, P.: Impact of roots, mycorrhizas and earthworms on soil physi-cal properties as assessed by shrinkage analysis, J. Hydrol., 373, 499–507, doi:10.1016/j.jhydrol.2009.05.013, 2009.
Molineux, C. J., Fentiman, C. H., and Gange, A. C.: Charac-terising alternative recycled waste materials for use as green roof growing media in the U.K., Ecol. Eng., 35, 1507–1513, doi:10.1016/j.ecoleng.2009.06.010, 2009.
Monroe, C. D. and Kladivko, E. J.: Aggregate stability of a silt loam soil as affected by roots of corn, soybeans and wheat, Commun. Soil Sci. Plant Anal., 18, 1077–1087, doi:10.1080/00103628709367884, 1987.
Monserie, M.-F., Watteau, F., Villemin, G., Ouvrard, S., and Morel, J. L.: Technosol genesis: identification of organo-mineral asso-ciations in a young Technosol derived from coking plant waste materials, J. Soils Sediments, 9, 537–546, doi:10.1007/s11368-009-0084-y, 2009.
Morel, J. L., Chenu, C., and Lorenz, K.: Ecosystem services pro-vided by soils of urban, industrial, traffic, mining, and mil-itary areas (SUITMAs), J. Soils Sediments, 15, 1659–1666, doi:10.1007/s11368-014-0926-0, 2014.
Nachtergaele, F.: Soil taxonomy – a basic system of soil classifica-tion for making and interpreting soil surveys: Second ediclassifica-tion, by Soil Survey Staff, 1999, USDA–NRCS, Agriculture Handbook number 436, Hardbound, Geoderma, 99, 336–337, 2001. Nemerow, N. L.: Environmental Engineering: Environmental
Health and Safety for Municipal Infrastructure, Land Use and Planning, and Industry, 6th Edn., Wiley, Hoboken, NJ, 56–58, 2009.
Odling-Smee, F. J., Laland, K. N., and Feldman, M. W.: Niche con-struction, Universsity of Chicago Press, New Jersey, 641–648, 1996.
Olszewski, M. W., Holmes, M. H., and Young, C. A.: Assessment of Physical Properties and Stonecrop growth in green roof sub-strates amended with compost and hydrogel, Hort. Technol., 20, 438–444, 2010.
Paradelo, R. and Barral, M. T.: Influence of organic matter and tex-ture on the compactability of Technosols, Catena, 110, 95–99, doi:10.1016/j.catena.2013.05.012, 2013.
Paton, T. R.: The formation of soil material, George Allen and Un-win, London, UK, 143–144, 1978.
Peng, X. and Horn, R.: Modeling soil shrinkage curve across a wide range of soil types, Soil Sci. Soc. Am. J., 69, 584–592, doi:10.2136/sssaj2004.0146, 2005.
R Core Team: R: A Language and environment for statistical com-puting, R Development Core Team, R Foundation for Statistical Computing, Vienna, Austria, 2014.
Reid, J. B. and Goss, M. J.: Interactions between soil drying due to plant water use and decreases in aggregate stability caused by maize roots, J. Soil Sci., 33, 47–53, doi:10.1111/j.1365-2389.1982.tb01746.x, 1982.
Richards, L. A.: Porous plate apparatus for measuring moisture re-tention and transmission by soil, Soil Sci., 66, 105–110, 1948. Rillig, M. C., Wright, S. F., and Eviner, V. T.: The role of
arbus-cular mycorrhizal fungi and glomalin in soil aggregation: com-paring effects of five plant species, Plant Soil, 238, 325–333, doi:10.1023/A:1014483303813, 2002.
Rokia, S., Séré, G., Schwartz, C., Deeb, M., Fournier, F., Nehls, T., Damas, O., and Vidal-Beaudet, L.: Modelling agronomic prop-erties of Technosols constructed with urban wastes, Waste Man-age., doi:10.1016/j.wasman.2013.12.016, in press, 2014. Schaffer, B., Schulin, R., and Boivin, P.: Changes in shrinkage of
restored soil caused by compaction beneath heavy agricultural machinery, Eur. J. Soil Sci., 59, 771–783, 2008.
Scheu, S.: Effects of earthworms on plant growth: patterns and perspectives: The 7th international symposium on earth-worm ecology·Cardiff·Wales·2002, Pedobiologia, 47, 846– 856, doi:10.1078/0031-4056-00270, 2003.
Schrader, S. and Zhang, H.: Earthworm casting: Stabilization or destabilization of soil structure?, Soil Biol. Biochem., 29, 469– 475, doi:10.1016/S0038-0717(96)00103-4, 1997.
Séré, G., Schwartz, C., Ouvrard, S., Renat, J. C., Watteau, F., and Morel, J. L.: Early pedogenic evolution of constructed Tech-nosols, J. Soils Sediments, 10, 1246–1254, doi:10.1007/s11368-010-0206-6, 2010.
Shipitalo, M. and Butt, K.: Occupancy and geometrical properties of Lumbricus terrestris L – burrows affecting infiltration, Pedo-biologia, 43, 782–794, 1999.
Tejada, M. and Gonzalez, J. L.: Effects of the application of com-post originating from crushed cotton gin residues on wheat yield under dryland conditions, Eur. J. Agron., 19, 357–368, doi:10.1016/S1161-0301(02)00089-8, 2003.
Van Groenigen, J. W., Lubbers, I. M., Vos, H. M. J., Brown, G. G., De Deyn, G. B., and van Groenigen, K. J.: Earth-worms increase plant production: a meta-analysis, Sci. Rep., doi:10.1038/srep06365, in press, 2014.
Venables, W. N. and Ripley, B. D.: Modern Applied Statistics with S, 4th Edn., Springer, New York, 302–310, 2002.
Wilkinson, M. T. and Humphreys, G. S.: Exploring pedogenesis via nuclide-based soil production rates and OSL-based bioturbation rates, Soil Res., 43, 767–779, 2005.