www.clim-past.net/3/541/2007/
© Author(s) 2007. This work is licensed under a Creative Commons License.
Climate
of the Past
Direct north-south synchronization of abrupt climate change record
in ice cores using Beryllium 10
G. M. Raisbeck1, F. Yiou1, J. Jouzel2, and T. F. Stocker3
1Centre de Spectrom´etrie Nucl´eaire et de Spectrom´etrie de Masse, IN2P3-CNRS-Universit´e de Paris-Sud, Bˆat. 108, 91405
Orsay, France
2IPSL/LSCE, UMR CEA-CNRS-UVSQ, CE Saclay, 91191 Gif-sur-Yvette, France
3Climate and Environmental Physics, Physics Institute, University of Bern, Sidlerstrasse 5, 3012 Bern, Switzerland
Received: 24 April 2007 – Published in Clim. Past Discuss.: 11 May 2007
Revised: 7 August 2007 – Accepted: 5 September 2007 – Published: 7 September 2007
Abstract. A new, decadally resolved record of the10Be peak at 41 kyr from the EPICA Dome C ice core (Antarctica) is used to match it with the same peak in the GRIP ice core (Greenland). This permits a direct synchronisation of the climatic variations around this time period, independent of uncertainties related to the ice age-gas age difference in ice cores. Dansgaard-Oeschger event 10 is in the period of best synchronisation and is found to be coeval with an Antarctic temperature maximum. Simulations using a thermal bipolar seesaw model agree reasonably well with the observed rela-tive climate chronology in these two cores. They also repro-duce three Antarctic warming events observed between A1 and A2.
1 Introduction
Precise correlation of Northern and Southern Hemisphere ice core records is of critical importance for the understand-ing of the dynamics of abrupt climatic changes durunderstand-ing the last glacial period that have been inferred from the isotopic records in the GRIP (Johnsen et al., 1992; Dansgaard et al., 1993) and GISP2 (Grootes et al., 1993) ice cores from Cen-tral Greenland during the late glacial period. Twenty-five of these so-called Dansgaard/Oeschger events (DO events), characterized by a rapid warming and a more gradual return to glacial conditions, were identified between 110 and 14 kyr BP (North GRIP members, 2004) (1 kyr BP is 1000 years before present). That the largest of these abrupt changes seemed to have attenuated counterparts in Antarctica was noted from a visual comparison with the isotopic record from the East Antarctic Vostok core (Jouzel et al., 1994). Based
Correspondence to: G. M. Raisbeck
on the comparison of theδ18O records in air bubbles, Bender et al. (1994) proposed a first synchronization of Greenland and Antarctic large glacial events for the period>46 kyr BP. Uncertainties of about±3 kyr in relative dating, due in large part to the uncertainty in the ice age – gas age difference (Delta age), made it impossible to determine whether events in Greenland and Antarctic ice cores were in phase or out of phase (Bender et al., 1994), or in a lead/lag relationship (Steig and Alley, 2002; Schmittner et al., 2003).
Yiou et al. (1997) proposed a direct synchronization based on the use of the10Be peak measured in 5 ice cores around 40 kyr BP. The advantages of this method are that 10Be is recorded in the ice rather than in the gases, and that its pro-duction is independent of climate. In Greenland ice this10Be peak straddles DO 10 (Yiou et al., 1997) which occurred be-tween the two major DO events 8 and DO 12. Similar to the Greenland isotopic record, Yiou et al. (1997) noted that in the Vostok core there are 3 secondary isotopic maxima between the Antarctic counterparts of DO 8 and DO 12, later named A1 and A2 (Blunier et al., 1998), with the10Be peak occur-ring slightly after the second of these events. This would imply that the event corresponding to DO 10 occurred in Antarctica slightly earlier than in Greenland. However, the precision of the timing was limited by the fact that the10Be andδD measurements were made on two different Vostok cores (see note added in proof of Yiou et al., 1997).
counterparts by 2 to 3 kyr. This conclusion was extended to the seven major millennial-scale Antarctic warmings, A1 to A7, clearly identified back to 90 kyr (Blunier and Brook, 2001) and further to A8/DO 23 and A9/DO 24 (Caillon et al., 2003; Landais et al., 2006). A further, gas-based syn-chronization was derived from a very detailed comparison of the Vostok and GISP2 δ18O of air records (Bender et al., 1999). It showed that all 15 long and short intersta-dial events identified in the GISP2 ice core between 38 and 72 ka have counterparts in the Vostok record. On average, all these events are in phase between Greenland and Antarctica (within ±1.3 kyr). Importantly, the contradiction between the methane andδ18O of air approaches appears to be largely a matter of definition simply due to the different shapes of Greenland and Antarctic events. As noted in Blunier and Brook (2001), a comparison of peak temperatures as done in Bender et al. (1999), rather than the leading edges, would also lead to the conclusion that Byrd and Greenland (GRIP and GISP2) events are in phase. Most recently, methane syn-chronization of a core from Dronning Maud Land (EDML) with GRIP and NGRIP confirmed that all the DO events had Antarctic counterparts, and improved the relative Greenland-Antarctic chronologies to 400–800 years in the last glacial period (EPICA Community Members, 2006). We adopt the suggestion made in that paper to refer to these Antarctic counterparts as AIM (Antarctic Isotope Maximum).
There are two limitations to the use of gases for synchro-nization: (i) it is applicable only at times where there is a rapid change in the atmospheric value, (ii) the signal is re-tained at the “close-off” depth (typically about 80 m) where the bubbles in the ice are isolated from the overlying atmo-sphere. This signal is thus both smoothed and shifted com-pared to records in the ice itself. The resulting age offset is particularly important in low accumulation rate regions, such as the Antarctic plateau, where it can be as large as 5 kyr or more during glacial periods.
Here we show that the cosmogenic isotope10Be is a pa-rameter that permits the synchronisation of paleoclimatic records, because large changes in its production, caused by modulation of the galactic cosmic ray intensity by the geo-magnetic field and the electric and geo-magnetic fields associated with the out-flowing solar wind, are globally synchronous and independent of climate. The successful application of such a procedure requires that one can extract the10Be pro-duction rate variations from those caused by changes in de-position patterns (which themselves can be dependent on cli-mate), and that the variations are characteristic enough to identify in the records being examined.
The strongest and most reliably identified excursion of high10Be concentrations is found in several ice cores from Antarctica and Greenland (Yiou et al., 1997; Raisbeck et al., 1987; Beer et al., 1992), as well as in marine sediment cores (McHargue et al., 1995; Castagnoli et al., 1995; Robinson et al., 1995)∼40 000 years ago, and now generally accepted to be associated with the Laschamp geomagnetic excursion.
We report here new high resolution measurements of this
10Be peak on samples from the EPICA Dome C ice core and
combine these with a10Be record from the GRIP core in or-der to determine the relative phasing of temperature changes recorded in Greenland and Antarctica.
Although these data are being formally presented here for the first time, the position of this10Be peak in the EPICA core has been available for some time (Raisbeck et al., 2002), and has been used to help construct or support chronologies discussed in several papers of this special issue (Parrenin et al., 2007; Ruth et al., 2007; Blunier et al., 2007; Loulergue et al., 2007) and elsewhere (EPICA Community Members, 2006; Jouzel et al., 2007).
2 Experimental procedure
The ice available for this study was in the form of a contin-uous series of 55 cm strips, each weighing∼300 g. In order to maximize the time resolution, each bag was divided into 5 samples of 11 cm in length, each representing ∼9 years. The amount of ice per sample (∼50 g) is almost an order of magnitude smaller than what we have used for previous stud-ies (Raisbeck et al., 1987; Yiou et al., 1997). We therefore have modified somewhat our previous procedure. The sam-ples were melted in 250 ml centrifuge cones, in the presence of 0.25 mg of9Be carrier. The Be(OH)2 was then
precipi-tated directly with NH4OH. The precipitate was then washed
with water (pH=7), dissolved in a few drops of nitric acid, and transferred to a quartz crucible. The crucible was taken to dryness on a hotplate, then heated to 900◦ over an elec-tric furnace in order to transform the precipitate to BeO. The BeO was mixed with Nb powder (325 mesh) in the ratio 3:1 and pressed into a 1 mm diameter, 1 mm deep hole in a Mo cathode. This cathode was heated in argon to 1200◦ for 1 min, then 1800◦ for an additional minute, in a resis-tively heated carbon furnace. This procedure was found to give better and more stable9Be currents in the ion source, as well as reduce10B interference. The 10Be/9Be ratios were
measured at the Gif-sur-Yvette Tandetron based AMS facil-ity, relative to NIST standard SRM 4325, using the certified ratio of 2.68×10⁻¹¹. For almost all samples, at least 200 Be events were recorded, leading to a 1 sigma statistical uncer-tainty of<7%. Combined with a conservatively estimated 5% machine uncertainty, this leads to an overall uncertainty of∼8.5%.
3 Results
38 40 42 44 Age EDC3 (kyr BP)
700 720 740 760 780
Depth (m) 300
200
100
10Be Concentration (10 3 atoms/g)
10Be Flux (atoms m
−
2 s
−
1)
100
50 90 80 70 60
−420
−430
−440
δ
D (‰ SMOW)
AIM 8
AIM 9
AIM 10 AIM 11
AIM 12
Fig. 1. 10Be concentrations, 10Be flux and deuterium ratio and
its running average as a function of depth and age (EDC3) in the EPICA Dome C ice core. The10Be flux has been calculated us-ing accumulation rates used for EDC3 (Parrenin et al., 2007), and smoothed by summing the 5 first components provided by the sin-gular spectral analysis of the record (Paillard et al., 1996). Antarctic equivalents of DO events 8 to 12 are labeled AIM 8 to 12, where AIM stands for Antarctic Isotope Maximum.
they occur during the interval of low geomagnetic field in-tensity (With a “normal” geomagnetic field, a large fraction of cosmic rays with energies<1 GeV are already excluded from the atmosphere, and are thus insensitive to solar modu-lation). 10Be reaches the Antarctic plateau primarily by dry deposition, and hence concentrations are inversely correlated with the snow accumulation rate. A more appropriate param-eter to use when studying production variations is the10Be flux which is the product of the measured concentrations and the estimated accumulation rates (Raisbeck et al., 1992).
TheδD profile in the interval between 700 and 800 m has 3 features (i.e., AIM 9 to 11) that, based on their position and pattern, were identified as subdued analogues of DO events 9 to 11 observed in Greenland. The most prominent part of the10Be peak straddles the middle one of these events (AIM 10) (Raisbeck et al., 2002), exactly as seen in the GRIP core (Yiou et al., 1997). This implies that DO 10 and its Antarctic counterpart are synchronous in the two ice cores.
Model τ = 1200 yr Model τ = 2200 yr
48 46 44 42 40 38
Age (kyr BP)
10Be Concentration GRIP
(10
3 atoms/g) 60
40
20
10Be Flux GRIP (atoms m
−
2 s
−
1) 200
150
100
10Be Flux EDC (atoms m
−
2 s
−
1) 100
75
50 GRIP
GRIP
EDC
δ
18O GRIP
(‰ SMOW)
−35
−40
Temperature GRIP
(°C)
−30
−40
−50
∆
Temperature EDC (°C)
−6
−8 ∆Temperature model (°C) 0
−10 DO 8
DO 9
DO 10 DO 11 DO 12
AIM 9 AIM 10 AIM 11 AIM 12 AIM 8
TBe1
TBe2
TA1 TA2
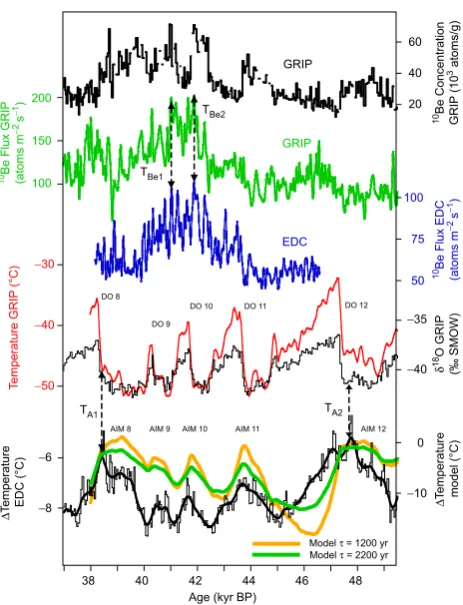
Fig. 2. Synchronization of the GRIP and EPICA Dome C records
on the SS09sea time-scale (North GRIP Members, 2004), using the four tie points of Table 1. 10Be concentrations are mainly from Yiou et al. (1997) with additional measurements from Wagner et al. (2001) and Muscheler et al. (2004). Corrections for10Be re-tained on filters for GRIP samples processed with 0.45 micron fil-ters have been made as described in Yiou et al. (1997). GRIP fluxes, calculated using the accumulation estimates of Johnsen et al. (2001) after applying a correction for the change in the isotopic composi-tion of the ocean (Waelbroeck et al., 2002), are smoothed by sin-gular spectral analysis as in Fig. 1. The two following curves show
δ18O at GRIP and estimated temperature change as given by Hu-ber et al. (2006) at NorthGRIP, these two records being placed on a common timescale (North GRIP Members, 2004) and scaled in such a way that theδ18O record corresponds to the temperature change derived using the present-day temperature isotope relation-ship as observed along traverses (Johnsen et al., 1989). The bot-tom curve represent the Dome C temperature change (Stenni et al., 2004) without source correction and its running average. This can be compared with the predicted southern temperature response us-ing the thermal bipolar seesaw model (Stocker and Johnsen, 2003), with aτof 1200 and 2200 years.
δ 18O GRIP
(‰ SMOW)
−36
−40
δ
18O Byrd
(‰ SMOW)
−38
−40
δ
18O GRIP
(‰ SMOW)
−36
−40
−420
−430
−440
δ
D (‰ SMOW)
48 46 44 42 40 38
Age (kyr BP) 36
AIM 9 AIM 10 AIM 11 AIM 12 AIM 8
Dome C [ EDC3 ] Byrd [ B98 ]
GRIP [ B98 ] GRIP [ SS09sea ]
A1 A2
−39
−41 −42 −38
−38
−42
−44
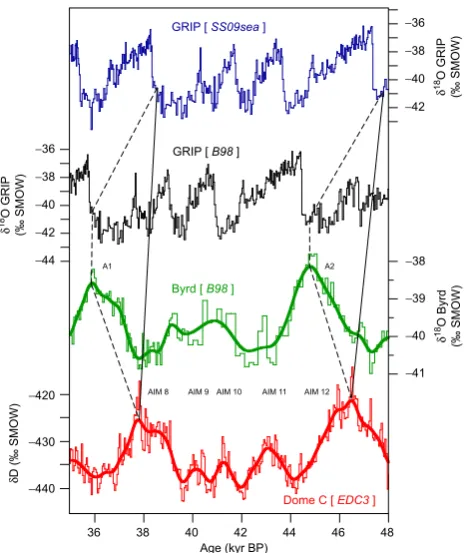
Fig. 3. Isotope profiles of GRIP, Byrd and EDC cores, showing
how the correlation of A1 and A2 by Blunier et al. (1998) (vertical dashed lines) between GRIP and Byrd (on the timescale adopted by Blunier et al.) has been transferred onto those of the SS09sea time scale of GRIP and the EDC3 time scale of Dome C, giving rise to the tie points (solid lines) shown in Table 1 and Fig. 2.
by summing the first 5 components of a singular spectral analysis (Paillard et al., 1996). Using these smoothed curves for alignment, DO 10 and its counterpart, AIM 10 are syn-chronous in the two records, within our ability to resolve, which we presently estimate as∼200 years.
Due to limitations of the GRIP10Be record (time resolu-tion, missing samples, corrections for filtered samples), we do not feel confident in making10Be correlations outside the main peak region. In order to show correlation over a more extended period, we have thus used the A1 and A2 methane events as synchronized between GRIP and the Byrd core by Blunier et al. (1998). These have been transferred from Byrd to EDC as shown in Fig. 3 and Table 1. We then correlated the two curves using the Analyseries program (Paillard et al., 1996). We emphasize that the accuracy of the external corre-lations does not effect the10Be synchronization in the region of AIM 10. As one goes away from this region however, the correlation will become increasingly dependent on these ex-ternal tie points. One observation in favour of at least the older of these external tie points is the near coincidence of a minor10Be peak at∼44 ky, which two reviewers of this pa-per thought should correlate. Interestingly enough, the use of these external tie points also brings a modeled response of
Table 1. Tie points used for correlating GRIP and EDC ice cores in
Fig. 2.
Tie point Depth Depth Age Age GRIP
EDC GRIP EDC3 SS09sea
(m) (m) (kyr) (kyr)
TA1 701.7 2202.0 37.81 38.45
TBe1∗ 734.5 2231.6 40.67 41.04
TBe2∗ 743.8 2245.2 41.54 41.89
TA2 793.1 2327.9 46.5 47.71
∗These values are slightly different, but within the uncertainties, of
those used by Loulergue et al. (2007).
AIM 11 in good phase agreement with the observations (see below).
This synchronism for DO 10 and its Antarctic counterpart complements and reinforces results based on the methane records of Antarctic and Greenland ice cores (Blunier et al., 1998) which demonstrated that the start of the warming as-sociated with events A1 and A2 lead the abrupt warming of DO 8 and 12, respectively, by 2–3 kyr. Because of the dura-tion of A1 and A2, however, this is equivalent to the alterna-tive statement that the maximum temperature during A1 and A2 coincided with that of DO 8 and DO 12, respectively. For the period in between, with the three intervening DO events 9 to 11, a statement regarding the phase relationship between Greenland and Antarctica for other DO events was not possi-ble owing to the noisierδ18O record of the Byrd ice core and the general uncertainty in synchronizing shorter events based on gas records.
4 Implications for bipolar seasaw model
on the seesaw model and the reconstructed Antarctic temper-ature was obtained withτ≈1200 years (Stocker and Johnsen, 2003).
We now test the thermal bipolar seesaw concept with the new synchronization based on10Be. The new temperature reconstructions based on thermal fractionation measured on air enclosed in samples from the NorthGRIP ice core (Huber et al., 2006) is used as input to the seesaw model withτ=1200 and 2200 years. The output is compared to the temperature record at Dome C inferred from theδD signal (Stenni et al., 2004). Because the bipolar seesaw model of Stocker and Johnsen (2003) concerns ocean temperatures, while the input and output are estimates of air temperatures, one cannot ex-pect the predicted temperature variations to be quantitatively comparable to those inferred from the ice cores. Indeed, as seen in Fig. 2, the observed variations are∼5 times smaller than those predicted, emphasizing that the thermal bipolar seesaw model is a simple, conceptual model. Nevertheless, the model captures correctly the phasing, and to some extent also the relative amplitude, of the observed variations. As can be seen in Fig. 2, for both values ofτ the southern temper-ature response of the seesaw model in the time period from 49 to 38 kyr BP exhibits all warmings and coolings which are inferred from theδD record from EPICA Dome C. For AIM 9–11, the time difference between the predicted and ob-served temperature peaks is<200 years, which is about the limit of the estimated uncertainty in our synchronization. Not only the phasing of the simulated signal, but also the relative amplitudes are reasonably well produced.
5 Perspectives
While it would be desirable to apply the10Be technique to other time intervals of the climate records, we unfortunately have not yet identified other events during the last climate cy-cle which are as dramatic as the10Be peaks around 40 kyr BP. However, if continuous high resolution10Be profiles were available, it still should be possible to make such a correla-tion using the centennial scale variacorrela-tions. For example, at Vostok, it was possible to correlate the variations produced by solar modulation with similar variations observed in tree ring14C (Raisbeck et al., 1998). In principle, therefore, it should be feasible to correlate such variations in Antarctic and Greenland ice. As mentioned above, the degree of corre-lation in Fig. 2 is limited by the GRIP10Be record. Thus, an improved Greenland10Be record should allow a better cor-relation. We have now measured such a profile in the North GRIP core at a resolution comparable to that measured at Dome C. This should potentially permit a correlation on a time scale of better than 20 years. As noted earlier, the largest and longest of the10Be production variations should also be identifiable in marine sediments, further permitting a direct correlation of the ice core and ocean climatic records.
Acknowledgements. Constructive comments from three reviewers
are acknowledged. This work is a contribution to the “European Project for Ice Coring in Antarctica” (EPICA), a joint ESF (Euro-pean Science Foundation)/EU scientific programme, funded by the European Commission (EPICA-MIS) and by national contributions from Belgium, Denmark, France, Germany, Italy, Netherlands, Norway, Sweden, Switzerland and the United Kingdom. The main logistic support was provided by IPEV and PNRA (at Dome C) and AWI (at Dronning Maud Land). Tandetron operation was supported by the IN2P3 and INSU divisions of the CNRS. This is EPICA publication no. 183.
Edited by: F. Parrenin
References
Beer, J., Johnsen, S. J., Bonani, G., Finkel, R. C., Langway, C. C., Oeschger, H., Stauffer, B., Suter M., and W¨olfli, W.: 10Be peaks as time markers in polar ice core records, in: The Last Deglaciation: Absolute and Radiocarbon Chronologies, edited by: Bard, E. and Broecker, W. S., Springer, New York, 141–143, 1992.
Bender, M., Sowers, T., Dickson, M.-L., Orchardo, J., Grootes, P., Mayewski, P. A., and Meese, D. A.: Climate correlations be-tween Greenland and Antarctica during the past 100 000 years, Nature, 372, 663–666, 1994.
Bender, M., Malaiz´e, B., Orchardo, J., Sowers, T., and Jouzel, J.: High precision correlations of Greenland and Antarctic ice core records over the last 100 kyr, in: Mechanisms of Global Climate Change at Millennial Time Scales, edited by: Clark, P. U., Webb, D. J., Keigwin, L. D., American Geophysical Union, Washing-ton, vol. 112, pp. 149–164, 1999.
Blunier, T. and Brook, E. J.: Timing of millennial-scale climate change in Antarctica and Greenland during the last glacial pe-riod, Science, 291, 109–112, 2001.
Blunier, T., Chappellaz, J., Schwander, J., Dallenbach, A., Stauf-fer, B., Stocker, T. F., Raynaud, D., Jouzel, J., Clausen, H. B., Hammer, C. U., and Johnsen, S. J., Asynchrony of Antarctic and Greenland climate change during the last glacial period, Nature, 394(6695), 739–743, 1998.
Blunier, T., Spahni, R., Barnola, J. M., Loulergue, L., and Schwan-der, J.: Synchronization of ice core records via atmospheric gases, Clim. Past, 3, 325–330, 2007,
http://www.clim-past.net/3/325/2007/.
Broecker, W. S.: Paleocean circulation during the last deglaciation: a bipolar seesaw?, Paleoceanography, 13, 119–121, 1998. Caillon, N., Jouzel, J., Severinghaus, J. P., Chappellaz, J., and
Blu-nier, T.: A novel method to study the phase relationship between Antarctic and Greenland climate, Geophys. Res. Lett., 30(17), 1899–2002, 2003.
Castagnoli, G. C., Albrecht, A., Beer, J., Bonino, G., Shen, C., Callegari, E., Taricco, C., Dittrich-Hannen, B., Kubik, P., Suter, M., and Zhu, G. M.: Evidence for enhanced Be-10 deposition in Mediterranean sediments 35-Kyr BP, Geophys. Res. Lett., 22(6), 707–710, 1995.
Crowley, T. J.: North Atlantic deep water cools the southern hemi-sphere, Paleoceanography, 7, 489–497, 1992.
J. P., Sveinbj¨ornsdottir, A. E., Jouzel, J., and Bond, G.: Evidence for general instability of past climate from a 250-kyr ice-core record, Nature, 364, 218–220, 1993.
EPICA Community Members: Eight glacial cycles from an Antarc-tic ice core, Nature, 429, 623–628, 2004.
EPICA Community Members: Interhemispheric coupling of mil-lenial scale variability during the last glacial, Nature, 444, 195– 198, 2006.
Grootes, P. M., Stuiver, M., White, J. W. C., Johnsen, S., and Jouzel, J.: Comparison of oxygen isotope records from the GISP2 and GRIP Greenland ice cores, Nature, 366, 552–554, 1993. Huber, C., Leuenberger, M., Spahni, R., Fl¨uckiger, J., Schwander,
J., Stocker, T. F., Johnsen, S., Landais, A., and Jouzel, J.: tope calibrated Greenland temperature record over Marine Iso-tope Stage 3 and its relation to CH4, Earth Planet. Sci. Lett., 243, 504–519, 2006.
Johnsen, S. J., Dansgaard, W., and White, J. W. C.: The origin of Arctic precipitation under present and glacial conditions, Tellus, 41B, 452–468, 1989.
Johnsen, S. J., Clausen, H. B., Dansgaard, W., Fuhrer, K., Gunde-strup, N., Hammer, C. U., Iversen, P., Jouzel, J., Stauffer, B., and Steffensen, J. P.: Irregular glacial interstadials recorded in a new Greenland ice core, Nature, 359, 311–313, 1992.
Johnsen, S. J., DahlJensen, D., Gundestrup, N., Steffensen, J. P., Clausen, H. B., Miller, H., Masson-Delmotte, V., Sveinbjorns-dottir, A. E., and White, J.: Oxygen isotope and palaeotempera-ture records from six Greenland ice-core stations: Camp Cen-tury, Dye-3, GRIP, GISP2, Renland and NorthGRIP, J. Quat. Sci., 16(4), 299–307, 2001.
Jouzel, J., Lorius, C., Johnsen, S., and Grootes, P.: Climate insta-bilities – Greenland and Antarctic records, Comptes Rendus de l’Acad´emie des Sciences S´erie II, 319(1), 65–77, 1994. Jouzel, J., Masson-Delmotte, V., Cattani, O., Dreyfus, G., Falourd,
S.,Hoffmann, G., Minster, B., Nouet, J., Barnola, J. M., Chappel-laz, J., Fischer, H., Gallet, J. C., Johnsen, S., Leuenberger, M., Loulergue, L., Luethi, D., Oerter, H., Parrenin, F., Raisbeck, G., Raynaud, D., Schilt, A., Schwander, J., Selmo, E., Souchez, R., Spahni, R., Stauffer, B., Steffensen, J. P., Stenni, B., Stocker, T. F., Tison, J. L., Werner, M., and Wolff, E. W.: Orbital and mil-lenial Antarctic climate variability over the last 800 000 years, Science, 317, 793–796, doi:10.1126/science.1141038, 2007. Knutti, R., Fl¨uckiger, J., Stocker, T. F., and Timmermann, A.:
Strong hemispheric coupling of glacial climate through freshwa-ter discharge and ocean circulation, Nature, 430, 851–856, 2004. Landais, A., Masson-Delmotte, V., Jouzel, J., Raynaud, D., Johnsen, S., Huber, C., Leuenberger, M., Schwander, J., and Minster, B.: The glacial inception as recorded in the NorthGRIP Greenland ice core: timing, structure and associated abrupt tem-perature changes, Clim. Dynam., 26(2–3), 273–284, 2006. Loulergue, L., Parrenin, F., Blunier, T., Barnola, J.-M., Spahni, R.,
Scilt, A., Raisbeck, G., and Chappellaz, J.: New constraints on the gas age-ice age difference along the EPICA ice cores, 0– 50 kyr, Clim. Past, 3, 527–540, 2007,
http://www.clim-past.net/3/527/2007/.
McHargue, L. R., Damon, P. E., and Donahue, D. J.: Enhanced cosmic-ray production of Be-10 coincident with the Mono Lake and Laschamp geomagnetic excursions, Geophys. Res. Lett., 22(5), 659–662, 1995.
Muscheler, R., Beer, J., Wagner, G., Laj, C., Kissel, C., Raisbeck,
G. M., Yiou, F., and Kubik, P. W.: Changes in the carbon cycle during the last deglaciation as indicated by the comparison of Be-10 and C-14 records, Earth Planet. Sci. Lett., 219(3–4), 325–340, 2004.
North GRIP Members: High-resolution climate record of the north-ern hemisphere back into the last interglacial period, Nature, 431, 147–151, 2004.
Paillard, D., Labeyrie, L. D., and Yiou, P.: Macintosh program per-forms time-series analysis, EOS, Transactions of the American Geophysical Union, 77, 379, 1996.
Parrenin, F., Barnola, J.-M., Beer, J., Blunier, T., Castellano, E., Chappellaz, J., Dreyfus, G., Fischer, H., Fujita, S., Jouzel, J., Kawamura, K., Lemieux, B., Loulergue, L., Masson-Delmotte, V., Narcisi, B., Petit, J.-R., Raisbeck, G. M., Raynaud, D., Ruth, U., Schwander, J., Severi, M., Spahni, R., Steffensen, J. P., Svensson, A., Udisti, R., Waelbroeck, C., and Wolff, E. The EDC3 agescale for the EPICA Dome C ice core, Clim. Past, 3, 485–497, 2007,
http://www.clim-past.net/3/485/2007/.
Raisbeck, G. M., Yiou, F., Bourl`es, D., Lorius, C., Jouzel, J., and Barkov, N. I., Evidence for two intervals of enhanced Be-10 de-position in Antarctic ice during the last glacial period, Nature, 326(6110), 273–277, 1987.
Raisbeck, G. M., Yiou, F., Jouzel, J., Petit, J. R., Bard, E., and Barkov, N. I.:10Be deposition at Vostok, Antarctica, during the last 50000 years and its relationship to possible cosmogenic pro-duction variations during this period, in: The Last Deglaciation: Absolute and Radiocarbon Chronologies, edited by: Bard, E. and Broecker, W. S., Springer, New York, 127–139, 1992.
Raisbeck, G. M., Yiou, F., Bard, E., Dollfus, D., Jouzel, J., and Petit, J. R.: Absolute dating of the last 7000 years of the Vostok ice core using10Be, Mineralogical Magazine, 62A, 1228, 1998. Raisbeck, G. M., Yiou, F., and Jouzel, J.: Cosmogenic10Be as a high resolution correlation tool for climate records, Geochim. Cosmochim. Acta, 66, A623, 2002.
Robinson, C., Raisbeck, G. M., Yiou, F., Lehman, B., and Laj, C.: The relationship between Be-10 and geomagnetic field strength records in central North Atlantic sediments during the last 80 ka, Earth Planet. Sci. Lett., 136(3–4), 551–557, 1995.
Ruth, U., Barnola, J.-M., Beer, J., Bigler, M., Blunier, T., Castel-lano, E., Fischer, H., Fundel, F., Huybrechts, P., Kaufmann, P., Kipfstuhl, J., Lambrecht, A., Morganti, A., Oerter, H., Parrenin, F., Rybak, O., Severi, M., Udisti, R., Wilhelms, F., and Wolff, E.: EDML1: A chronology for the EDML ice core, Antarctica, over the last 150 000 years, Clim. Past, 3, 474–484, 2007,
http://www.clim-past.net/3/474/2007/.
Schmittner, A., Saenko, O. A., and Weaver, A. J.: Coupling of the hemispheres in observations and simulations of glacial climate change, Quat. Sci. Rev., 22, 659–671, 2003.
Steig, E. J. and Alley, R. B.: Phase relationships between Antarc-tic and Greenland climate records, Ann. Glaciol., 35, 451–456, 2002.
Stocker, T. F.: The seesaw effect, Science, 282, 61–62, 1998. Stocker, T. F. and Johnsen, S. J.: A minimum thermodynamic
model for the bipolar seesaw, Paleoceanography, 18, 1087, doi:10.1029/2003PA000920, 2003.
Waelbroeck, C., Labeyrie, L., Michel, E., Duplessy, J. C., Mc-Manus, J. F., Lambeck, K., Balbon, E., and Labracherie, M.: Sea-level and deep water temperature changes derived from ben-thic foraminifera isotopic records, Quat. Sci. Rev., 21(1–3), 295– 305, 2002.
Wagner, G., Beer, J., Masarik, J., Muscheler, R., Kubik, P. W., Mende, W., Laj, C., Raisbeck, G. M., and Yiou, F.: Presence of the solar de Vries cycle (∼205 years) during the last ice age, Geophys. Res. Lett., 28(2), 303–306, 2001.